Ethernet Switch Market Segmentation
Ethernet Switch Market By Product Type (USD Billion, 2025-2035)
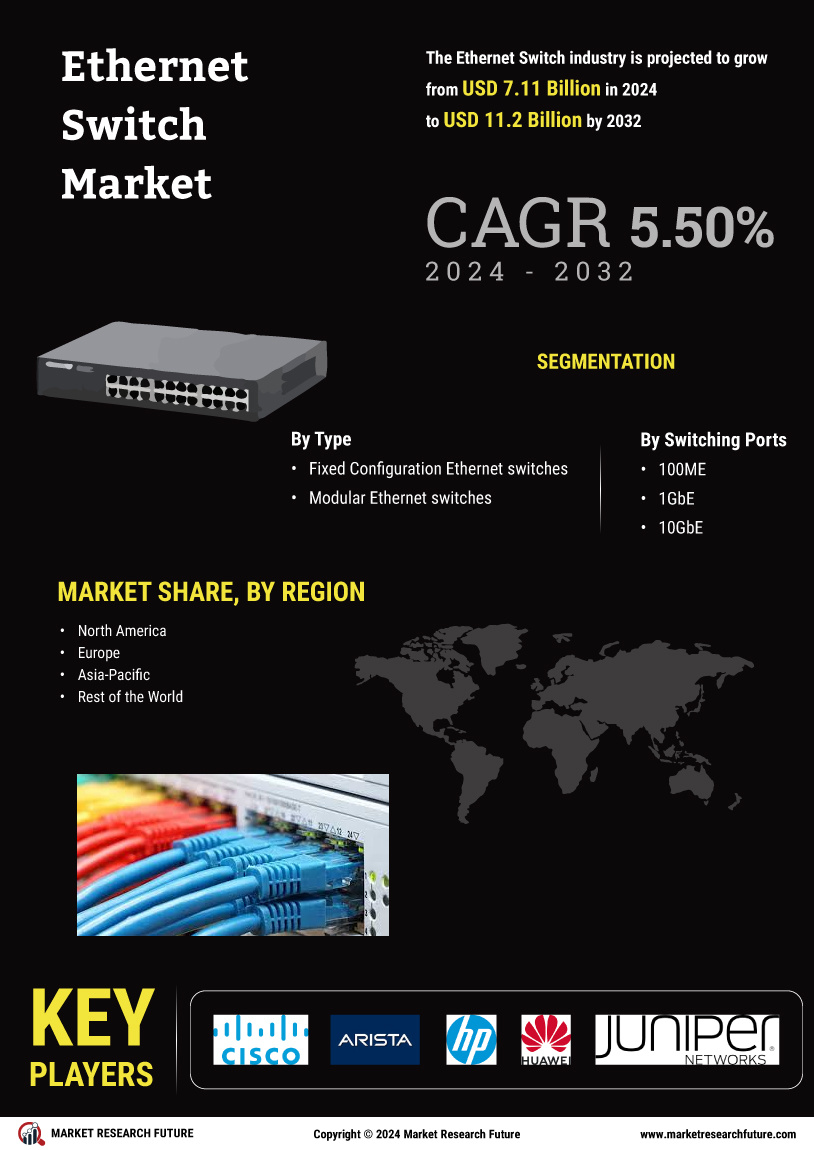
- Modular Ethernet switches
- Fixed Configuration Ethernet switches
- Unmanaged Switches
- Smart Switches
- Managed L2 and L3 Switches
Ethernet Switch Market By Switching Ports (USD Billion, 2025-2035)
- 100ME and 1GbE
- 10GbE
- 40GbE
- 100GbE