Enterprise Data Management Market (2026 - 2035)

ID: MRFR/ICT/4407-HCR
200 Pages
Nirmit Biswas
Last Updated: August 19, 2026
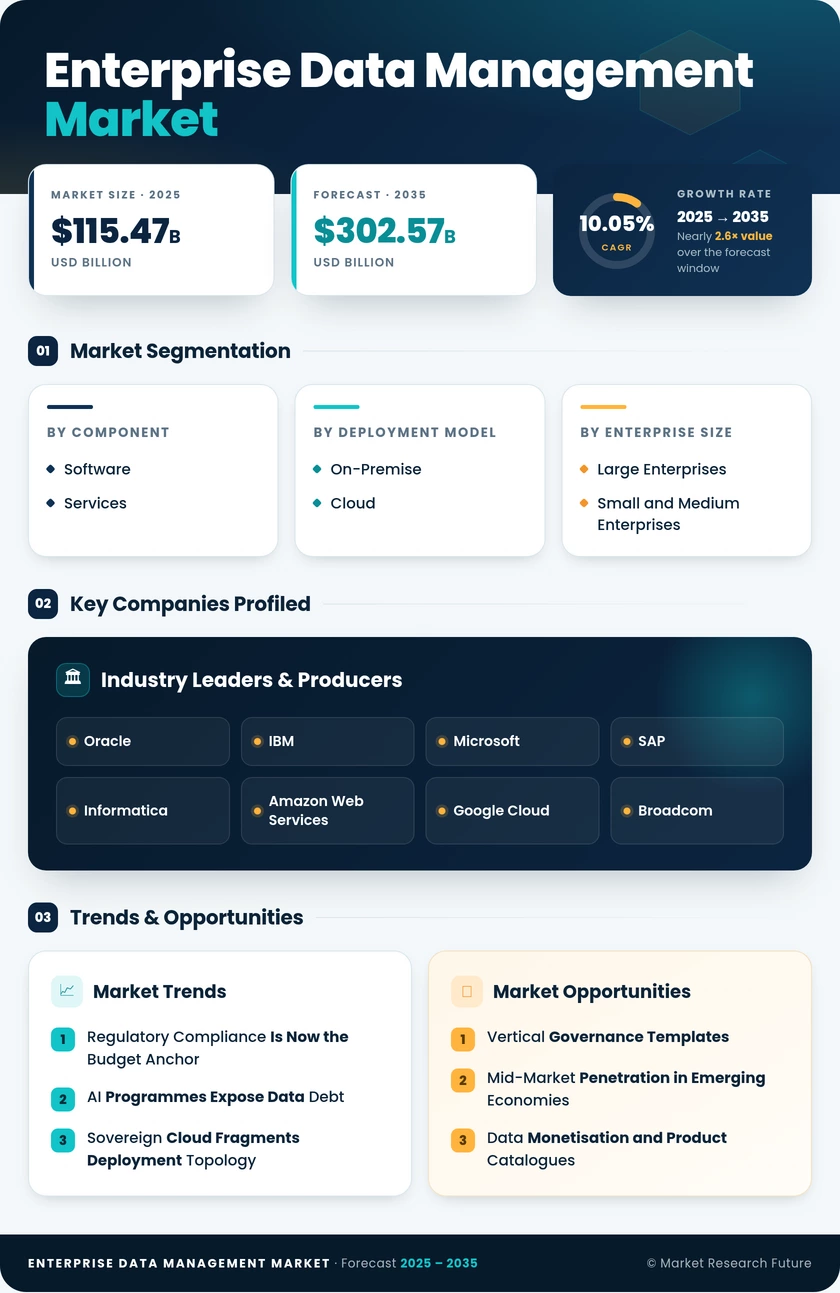
Enterprise Data Management Market Size, Share and Research Report By The Talent Gap Is Structural, Not Cyclical, By Legacy Estates Resist Clean Migration, By Cost Scrutiny Has Returned and By Regional (North America, Europe, South America, South Africa, Asia Pacific, Middle East and Africa) - Industry Forecast to 2035.
Enterprise Data Management Market
Market Size
Forecast Period2026-2035
CAGR (2026-2035)10.05%
2025 Market SizeUSD 115.47 Billion
2035 Market SizeUSD 302.57 Billion
Key Players
Oracle
IBM
Microsoft
SAP
Informatica
Amazon Web Services
Opportunities
  • Vertical Governance Templates
  • Mid-Market Penetration in Emerging Economies
  • Data Monetisation and Product Catalogues
  1. 1 Market Summary |
    1. 1.1 Study Assumptions & Market Definition |
    2. 1.2 Scope of the Study |
    3. 1.3 Research Methodology
  2. 2 Key Report Takeaways |
    1. 2.1 By Technology |
    2. 2.2 By Sector |
    3. 2.3 By Geography
  3. 3 Market Size & Forecast (2021–2035) |
    1. 3.1 Historical Market Size (2021–2024) |
    2. 3.2 Base Year Assessment (2025) |
    3. 3.3 Forecast Market Size (2026–2035) |
    4. 3.4 Year-over-Year Growth Analysis
  4. 4 Driver Impact Analysis |
    1. 4.1 Regulatory Compliance Is Now the Budget Anchor |
    2. 4.2 AI Programmes Expose Data Debt |
    3. 4.3 Sovereign Cloud Fragments Deployment Topology |
    4. 4.4 Unstructured Volume Outpaces Storage Economics
  5. 5 Restraints Impact Analysis |
    1. 5.1 The Talent Gap Is Structural, Not Cyclical |
    2. 5.2 Legacy Estates Resist Clean Migration |
    3. 5.3 Cost Scrutiny Has Returned
  6. 6 Opportunities |
    1. 6.1 Vertical Governance Templates |
    2. 6.2 Mid-Market Penetration in Emerging Economies |
    3. 6.3 Data Monetisation and Product Catalogues |
    4. 6.4 Sovereign and Public Sector Deployments |
    5. 6.5 Agentic AI Access Control
  7. 7 Regional Market Share & Country-Level Analysis |
    1. 7.1 North America | |
      1. 7.1.1 US | |
      2. 7.1.2 Canada | |
      3. 7.1.3 Mexico |
    2. 7.2 Europe | |
      1. 7.2.1 Germany | |
      2. 7.2.2 UK | |
      3. 7.2.3 France | |
      4. 7.2.4 Italy | |
      5. 7.2.5 Spain | |
      6. 7.2.6 Nordic Countries | |
      7. 7.2.7 Russia | |
      8. 7.2.8 Rest of Europe |
    3. 7.3 Asia-Pacific | |
      1. 7.3.1 China | |
      2. 7.3.2 India | |
      3. 7.3.3 Japan | |
      4. 7.3.4 South Korea | |
      5. 7.3.5 ASEAN | |
      6. 7.3.6 Rest of Asia-Pacific |
    4. 7.4 South America | |
      1. 7.4.1 Brazil | |
      2. 7.4.2 Argentina | |
      3. 7.4.3 Rest of South America |
    5. 7.5 Middle East & Africa | |
      1. 7.5.1 Saudi Arabia | |
      2. 7.5.2 UAE | |
      3. 7.5.3 South Africa | |
      4. 7.5.4 Egypt | |
      5. 7.5.5 Rest of Middle East & Africa
  8. 8 Future Outlook (2026–2035) |
    1. 8.1 Autonomous Data Operations |
    2. 8.2 Platform Economics and Consolidation |
    3. 8.3 Semantic Interoperability Becomes Table Stakes |
    4. 8.4 Sustainability and Non-Financial Assurance
  9. 9 Market Segmentation Analysis |
    1. 9.1 By Component | |
      1. 9.1.1 Software | |
      2. 9.1.2 Services |
    2. 9.2 By Deployment Model | |
      1. 9.2.1 Cloud | |
      2. 9.2.2 On-Premise |
    3. 9.3 By Enterprise Size | |
      1. 9.3.1 Large Enterprises | |
      2. 9.3.2 Small and Medium Enterprises |
    4. 9.4 By End-Use Industry | |
      1. 9.4.1 BFSI | |
      2. 9.4.2 IT and Telecommunication | |
      3. 9.4.3 Healthcare and Life Sciences | |
      4. 9.4.4 Retail and E-Commerce | |
      5. 9.4.5 Manufacturing | |
      6. 9.4.6 Government and Public Sector | |
      7. 9.4.7 Others
  10. 10 Competitive Landscape |
    1. 10.1 Market Concentration Analysis |
    2. 10.2 Competitive Benchmarking Matrix |
    3. 10.3 Company Profiles
  11. 11 Recent News & Developments
  12. 12 Report Scope & Methodology
  13. 13 Detailed Sources & Citations
  14. 14 Frequently Asked Questions
  15. 15 LIST OF TABLES |
  16. TABLE 1 Global Enterprise Data Management Market Size & Forecast, by Revenue (USD Billion), 2021–2035 |
  17. TABLE 2 Global Enterprise Data Management Market – Year-over-Year Growth Analysis, 2021–2035 |
  18. TABLE 3 Driver Impact Analysis Matrix, 2026–2035 |
  19. TABLE 4 Restraint Impact Analysis Matrix, 2026–2035 |
  20. TABLE 5 Global Market Size, by Region, 2021–2035 (USD Billion) |
  21. TABLE 6 North America Market Size, by Country, 2021–2035 (USD Billion) |
  22. TABLE 7 Europe Market Size, by Country, 2021–2035 (USD Billion) |
  23. TABLE 8 Asia-Pacific Market Size, by Country, 2021–2035 (USD Billion) |
  24. TABLE 9 South America Market Size, by Country, 2021–2035 (USD Billion) |
  25. TABLE 10 Middle East & Africa Market Size, by Country, 2021–2035 (USD Billion) |
  26. TABLE 11 Global Market Size, by Component, 2021–2035 (USD Billion) |
  27. TABLE 12 Global Market Size, by Deployment Model, 2021–2035 (USD Billion) |
  28. TABLE 13 Global Market Size, by Enterprise Size, 2021–2035 (USD Billion) |
  29. TABLE 14 Global Market Size, by End-Use Industry, 2021–2035 (USD Billion) |
  30. TABLE 15 North America Market Size, by Component and Deployment Model, 2021–2035 (USD Billion) |
  31. TABLE 16 Europe Market Size, by Component and End-Use Industry, 2021–2035 (USD Billion) |
  32. TABLE 17 Asia-Pacific Market Size, by Deployment Model and Enterprise Size, 2021–2035 (USD Billion) |
  33. TABLE 18 South America Market Size, by Component and End-Use Industry, 2021–2035 (USD Billion) |
  34. TABLE 19 Middle East & Africa Market Size, by Deployment Model and Enterprise Size, 2021–2035 (USD Billion) |
  35. TABLE 20 Competitive Benchmarking Matrix, 2026 |
  36. TABLE 21 Company Profiles – Key Players |
  37. TABLE 22 Recent Developments & Strategic Announcements, 2023–2025 |
  38. TABLE 23 Report Scope & Methodology Summary |
  39. TABLE 24 Detailed Sources & Citations Index
  40. 16 LIST OF FIGURES |
  41. FIGURE 1 Market Dynamics – Drivers, Restraints, Opportunities and Challenges |
  42. FIGURE 2 Industry Value Chain Analysis |
  43. FIGURE 3 Porter's Five Forces Analysis |
  44. FIGURE 4 Global Market Size Trend and Forecast, 2021–2035 (USD Billion) |
  45. FIGURE 5 Year-over-Year Growth Trajectory, 2022–2035 (%) |
  46. FIGURE 6 Market Share by Component, 2025 vs 2035 (%) |
  47. FIGURE 7 Market Share by Deployment Model, 2025 vs 2035 (%) |
  48. FIGURE 8 Market Share by Enterprise Size, 2025 vs 2035 (%) |
  49. FIGURE 9 Market Share by End-Use Industry, 2025 (%) |
  50. FIGURE 10 Regional Revenue Share Distribution, 2025 (%) |
  51. FIGURE 11 Regional CAGR Comparison, 2026–2035 (%) |
  52. FIGURE 12 Country-Level Revenue Contribution – Top 10 Markets, 2025 |
  53. FIGURE 13 Competitive Landscape Positioning Map, 2026 |
  54. FIGURE 14 Vendor Revenue Share Range Distribution, 2025 |
  55. FIGURE 15 Technology Adoption Roadmap, 2026–2035

Segmentation Quick Reference

DimensionSub-SegmentsDominant SegmentFastest Growing Segment
By ComponentSoftware; ServicesSoftwareServices
By Deployment ModelCloud; On-PremiseOn-PremiseCloud
By Enterprise SizeLarge Enterprises; Small and Medium EnterprisesLarge EnterprisesSmall and Medium Enterprises
By End-Use IndustryBFSI; IT and Telecommunication; Healthcare and Life Sciences; Retail and E-Commerce; Manufacturing; Government and Public Sector; OthersBFSIHealthcare and Life Sciences
By GeographyNorth America; Europe; Asia-Pacific; South America; Middle East & AfricaNorth AmericaAsia-Pacific


Market Segmentation Overview

By Component

Sub-SegmentKey Trend
SoftwareConsolidation of catalogue, quality, and policy enforcement into unified platform licences
ServicesShift from staff augmentation toward outcome-based managed governance engagements


Software revenue is defended by switching costs that compound with every policy library and audit trail an enterprise accumulates. Services expand faster because implementation capacity, not product availability, constrains deployment schedules across every major geography.

By Deployment Model

Sub-SegmentKey Trend
CloudElastic provisioning aligned to AI workload spikes and marketplace procurement
On-PremisePersistent demand from residency-constrained and latency-sensitive core systems


Residency rules now drive deployment choice more than infrastructure economics. Enterprises increasingly run parallel estates governed from a single policy definition, which raises architectural complexity while preserving compliance defensibility.

By Enterprise Size

Sub-SegmentKey Trend
Large EnterprisesMulti-jurisdiction policy harmonisation and post-merger estate consolidation
Small and Medium EnterprisesMarketplace-led adoption of pre-configured, low-touch governance packages


Large accounts contribute the bulk of revenue through multi-year enterprise agreements. Midsize adoption accelerates as regulatory scope broadens to entities that previously sat below compliance thresholds.

By End-Use Industry

Sub-SegmentKey Trend
BFSISupervisory testing of risk-data aggregation and reporting lineage
IT and TelecommunicationSubscriber consent management across high-volume network telemetry
Healthcare and Life SciencesInteroperability mandates and clinical evidence integrity requirements
Retail and E-CommercePersonalisation rebuilt around consent-constrained first-party data
ManufacturingSupply chain traceability driven by data-space participation requirements
Government and Public SectorNational classification standards and open data publication duties
OthersEnergy, logistics, and education modernisation programmes


Vertical demand correlates tightly with the intensity of sector-specific supervision. Industries where regulators test evidence directly — banking, pharmaceuticals, telecommunications — sustain the highest per-account spending, while sectors adopting voluntary standards follow two to three years behind.

By Region

Sub-SegmentKey Trend
North AmericaFragmented state privacy compliance driving unified policy engine purchases
EuropeData Act interoperability and AI Act documentation obligations
Asia-PacificSovereign cloud requirements and digital public infrastructure scale
South AmericaLGPD enforcement maturity and real-time payment data volumes
Middle East & AfricaNational data strategies tied to sovereign transformation programmes


Regional demand reflects regulatory maturity more closely than economic size. Markets with active enforcement generate sustained platform renewal cycles, while emerging regions convert programme funding into concentrated, government-led procurement waves.




Download PDF ×

We do not share your information with anyone. However, we may send you emails based on your report interest from time to time. You may contact us at any time to opt-out.