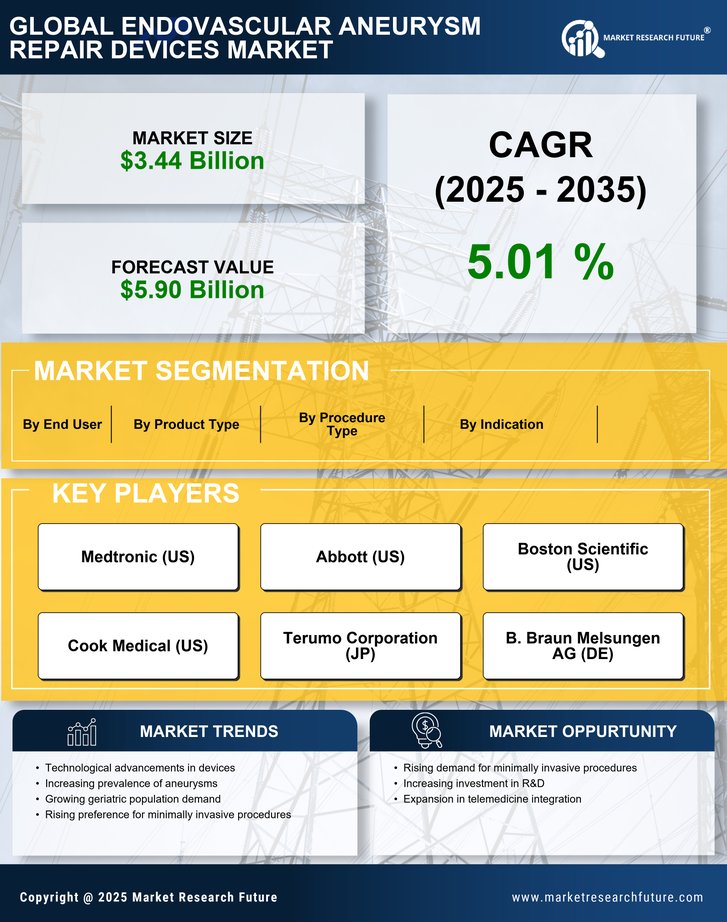
Endovascular Aneurysm Repair Devices Market Research Report – Forecast to 2030

Endovascular Aneurysm Repair Devices Market Research Report Information By Indication (Abdominal Aortic Aneurysm, Thoracic Aortic Aneurysm, and Others), By Site (Infrarenal and Pararenal), By Product (Percutaneous EVAR, and Others), and By Region (North America, Europe, Asia-Pacific, and the Rest of the World)—Forecast till 2030

ID: MRFR/MED/5023-HCR | 100 Pages | Author: Kinjoll Dey | June 2023         

Table of Contents:

Chapter 1. Report Prologue

Chapter 2. Market Introduction

2.1 Definition

2.2 Scope of the Study

2.2.1 Research Objective

2.2.2 Assumptions

2.2.3 Limitations

Chapter 3. Research Methodology

3.1 Introduction

3.2 Primary Research

3.3 Secondary Research

3.4 Market Size Estimation

Chapter 4. Market Dynamics

4.1 Drivers

4.2 Restraints

4.3 Opportunities

4.4 Challenges

4.5 Macroeconomic Indicators

4.6 Technology Trends & Assessment

Chapter 5. Market Factor Analysis

5.1 Porter’s Five Forces Analysis

5.1.1 Bargaining Power of Suppliers

5.1.2 Bargaining Power of Buyers

5.1.3 Threat of New Entrants

5.1.4 Threat of Substitutes

5.1.5 Intensity of Rivalry

5.2 Value Chain Analysis

5.3 Investment Feasibility Analysis

5.4 Pricing Analysis

Chapter 6. Global Endovascular Aneurysm Repair Devices Market, by Indication

6.1 Introduction

6.2 Abdominal Aortic Aneurysm

Market Estimates & Forecast, by Region, 2020-2027

Market Estimates & Forecast, by Country, 2020-2027

6.3 Thoracic Aortic Aneurysm

6.3.1 Ascending Aortic Aneurysm

Market Estimates & Forecast, by Region, 2020-2027

Market Estimates & Forecast, by Country, 2020-2027

6.3.2 Descending Aortic Aneurysm

Market Estimates & Forecast, by Region, 2020-2027

Market Estimates & Forecast, by Country, 2020-2027

6.3.3 Thoracoabdominal Aortic Aneurysm

Market Estimates & Forecast, by Region, 2020-2027

Market Estimates & Forecast, by Country, 2020-2027

6.3.4 Thoracic Arch Aortic Aneurysm

Market Estimates & Forecast, by Region, 2020-2027

Market Estimates & Forecast, by Country, 2020-2027

6.4 Others

Market Estimates & Forecast, by Region, 2020-2027

Market Estimates & Forecast, by Country, 2020-2027

Chapter 7. Global Endovascular Aneurysm Repair Devices Market, by Site

7.1 Introduction

7.2 Infrarenal

Market Estimates & Forecast, by Region, 2020-2027

Market Estimates & Forecast, by Country, 2020-2027

7.3 Pararenal

7.3.1 Juxtarenal

Market Estimates & Forecast, by Region, 2020-2027

Market Estimates & Forecast, by Country, 2020-2027

7.3.2 Suprarenal

Market Estimates & Forecast, by Region, 2020-2027

Market Estimates & Forecast, by Country, 2020-2027

Chapter 8. Global Endovascular Aneurysm Repair Devices Market, by Anatomy

8.1 Introduction

8.2 Traditional

Market Estimates & Forecast, by Region, 2020-2027

Market Estimates & Forecast, by Country, 2020-2027

8.3 Complex

Market Estimates & Forecast, by Region, 2020-2027

Market Estimates & Forecast, by Country, 2020-2027

Chapter 9. Global Endovascular Aneurysm Repair Devices Market, by Products

9.1 Introduction

9.2 Percutaneous EVAR

Market Estimates & Forecast, by Region, 2020-2027

Market Estimates & Forecast, by Country, 2020-2027

9.3 Fenestrated EVAR

Market Estimates & Forecast, by Region, 2020-2027

Market Estimates & Forecast, by Country, 2020-2027

9.4 Aortic Stents & TAA Grafts

Market Estimates & Forecast, by Region, 2020-2027

Market Estimates & Forecast, by Country, 2020-2027

9.5 Others

Market Estimates & Forecast, by Region, 2020-2027

Market Estimates & Forecast, by Country, 2020-2027

Chapter 10. Global Endovascular Aneurysm Repair Devices, by Region

10.1 Introduction

10.2 Americas

10.2.1 North America

10.2.1.1 US

10.2.1.2 Canada

10.2.2 South America

10.3 Europe

10.3.1 Western Europe

10.3.1.1 Germany

10.3.1.2 France

10.3.1.3 Italy

10.3.1.4 Spain

10.3.1.5 UK

10.3.1.6 Rest of Western Europe

10.3.2 Eastern Europe

10.4 Asia-Pacific

10.4.1 Japan

10.4.2 China

10.4.3 India

10.4.4 Australia

10.4.5 South Korea

10.4.6 Rest of Asia-Pacific

10.5 Middle East & Africa

10.5.1 Middle East

10.5.2 Africa

Chapter 11. Company Landscape

11.1 Introduction

11.2 Market Share Analysis

11.3 Key Development & Strategies

Chapter 12. Company Profiles

12.1 Cardiatis SA

12.1.1 Company Overview

12.1.2 Product Overview

12.1.3 Financials Overview

12.1.4 Key Developments

12.1.5 SWOT Analysis

12.2 Cardinal Health

12.2.1 Company Overview

12.2.2 Product Overview

12.2.3 Financial Overview

12.2.4 Key Developments

12.2.5 SWOT Analysis

12.3 Cook Medical LLC

12.3.1 Company Overview

12.3.2 Product Overview

12.3.3 Financial Overview

12.3.4 Key Development

12.3.5 SWOT Analysis

12.4 Endologix, Inc.

12.4.1 Company Overview

12.4.2 Product Overview

12.4.3 Financial Overview

12.4.4 Key Development

12.4.5 SWOT Analysis

12.5 Jotec GmbH

12.5.1 Company Overview

12.5.2 Product Overview

12.5.3 Financial overview

12.5.4 Key Developments

12.5.5 SWOT Analysis

12.6 Medtronic plc

12.6.1 Company Overview

12.6.2 Product Overview

12.6.3 Financial Overview

12.6.4 Key Developments

12.6.5 SWOT Analysis

12.7 Terumo Corporation

12.7.1 Overview

12.7.2 Product Overview

12.7.3 Financial Overview

12.7.4 Key Developments

12.7.5 SWOT Analysis

12.8 W. L. Gore & Associates, Inc.

12.8.1 Overview

12.8.2 Product Overview

12.8.3 Financials

12.8.4 Key Developments

12.8.5 SWOT Analysis

12.9 BiFlow Medical Ltd

12.9.1 Overview

12.9.2 Product Overview

12.9.3 Financials

12.9.4 Key Developments

12.9.5 SWOT Analysis

12.10 Boston Scientific Corporation

12.10.1 Overview

12.10.2 Product Overview

12.10.3 Financials

12.10.4 Key Developments

12.10.5 SWOT Analysis

12.11 Braile Biomédica

12.11.1 Overview

12.11.2 Product Overview

12.11.3 Financials

12.11.4 Key Developments

12.11.5 SWOT Analysis

12.12 Endoluminal Sciences Pty Ltd

12.12.1 Overview

12.12.2 Product Overview

12.12.3 Financials

12.12.4 Key Developments

12.12.5 SWOT Analysis

12.13 Endospan Ltd.

12.13.1 Overview

12.13.2 Product Overview

12.13.3 Financials

12.13.4 Key Developments

12.13.5 SWOT Analysis

12.14 Getinge AB

12.14.1 Overview

12.14.2 Product Overview

12.14.3 Financials

12.14.4 Key Developments

12.14.5 SWOT Analysis

12.15 LeMaitre Vascular, Inc.

12.15.1 Overview

12.15.2 Product Overview

12.15.3 Financials

12.15.4 Key Developments

12.15.5 SWOT Analysis

Chapter 13 MRFR Conclusion

13.1 Key Findings

13.1.1 From CEO’s Viewpoint

13.1.2 Unmet Needs of the Market

13.2 Key Companies to Watch

13.3 Predictions for the Endovascular Aneurysm Repair Devices Industry

Chapter 14. Appendix

LIST OF TABLES

Table 1 Global Endovascular Aneurysm Repair Devices Market Synopsis, 2020-2027

Table 2 Global Endovascular Aneurysm Repair Devices Market Estimates and Forecast, 2020-2027 (USD Million)

Table 3 Global Endovascular Aneurysm Repair Devices Market, by Indication, 2020-2027 (USD Million)

Table 4 Global Endovascular Aneurysm Repair Devices Market, by Site, 2020-2027 (USD Million)

Table 5 Global Endovascular Aneurysm Repair Devices Market, by Anatomy, 2020-2027 (USD Million)

Table 6 Global Endovascular Aneurysm Repair Devices Market, by Products, 2020-2027 (USD Million)

Table 7 Global Endovascular Aneurysm Repair Devices Market, by Region, 2020-2027 (USD Million)

Table 8 North America: Endovascular Aneurysm Repair Devices Market, by Indication, 2020-2027 (USD Million)

Table 9 North America: Endovascular Aneurysm Repair Devices Market, by Site, 2020-2027 (USD Million)

Table 10 North America: Endovascular Aneurysm Repair Devices Market, by Anatomy, 2020-2027 (USD Million)

Table 11 North America: Endovascular Aneurysm Repair Devices Market, by Products, 2020-2027 (USD Million)

Table 12 North America: Endovascular Aneurysm Repair Devices Market, by Region, 2020-2027 (USD Million)

Table 13 US: Endovascular Aneurysm Repair Devices Market, by Indication, 2020-2027 (USD Million)

Table 14 US: Endovascular Aneurysm Repair Devices Market, by Site, 2020-2027 (USD Million)

Table 15 US: Endovascular Aneurysm Repair Devices Market, by Anatomy, 2020-2027 (USD Million)

Table 16 US: Endovascular Aneurysm Repair Devices Market, by Products, 2020-2027 (USD Million)

Table 17 US: Endovascular Aneurysm Repair Devices Market, by Region, 2020-2027 (USD Million)

Table 18 Canada: Endovascular Aneurysm Repair Devices Market, by Indication, 2020-2027 (USD Million)

Table 19 Canada: Endovascular Aneurysm Repair Devices Market, by Site, 2020-2027 (USD Million)

Table 20 Canada: Endovascular Aneurysm Repair Devices Market, by Anatomy, 2020-2027 (USD Million)

Table 21 Canada: Endovascular Aneurysm Repair Devices Market, by Products, 2020-2027 (USD Million)

Table 22 Canada: Endovascular Aneurysm Repair Devices Market, by Region, 2020-2027 (USD Million)

Table 23 South America: Endovascular Aneurysm Repair Devices Market, by Indication, 2020-2027 (USD Million)

Table 24 South America: Endovascular Aneurysm Repair Devices Market, by Site, 2020-2027 (USD Million)

Table 25 South America: Endovascular Aneurysm Repair Devices Market, by Anatomy, 2020-2027 (USD Million)

Table 26 South America: Endovascular Aneurysm Repair Devices Market, by Products, 2020-2027 (USD Million)

Table 27 South America: Endovascular Aneurysm Repair Devices Market, by Region, 2020-2027 (USD Million)

Table 28 Europe: Endovascular Aneurysm Repair Devices Market, by Indication, 2020-2027 (USD Million)

Table 29 Europe: Endovascular Aneurysm Repair Devices Market, by Site, 2020-2027 (USD Million)

Table 30 Europe: Endovascular Aneurysm Repair Devices Market, by Anatomy, 2020-2027 (USD Million)

Table 31 Europe: Endovascular Aneurysm Repair Devices Market, by Products, 2020-2027 (USD Million)

Table 32 Europe: Endovascular Aneurysm Repair Devices Market, by Region, 2020-2027 (USD Million)

Table 33 Western Europe: Endovascular Aneurysm Repair Devices Market, by Indication, 2020-2027 (USD Million)

Table 34 Western Europe: Endovascular Aneurysm Repair Devices Market, by Site, 2020-2027 (USD Million)

Table 35 Western Europe: Endovascular Aneurysm Repair Devices Market, by Anatomy, 2020-2027 (USD Million)

Table 36 Western Europe: Endovascular Aneurysm Repair Devices Market, by Products, 2020-2027 (USD Million)

Table 37 Western Europe: Endovascular Aneurysm Repair Devices Market, by Region, 2020-2027 (USD Million)

Table 38 Eastern Europe: Endovascular Aneurysm Repair Devices Market, by Indication, 2020-2027 (USD Million)

Table 39 Eastern Europe: Endovascular Aneurysm Repair Devices Market, by Site, 2020-2027 (USD Million)

Table 40 Eastern Europe: Endovascular Aneurysm Repair Devices Market, by Anatomy, 2020-2027 (USD Million)

Table 41 Eastern Europe: Endovascular Aneurysm Repair Devices Market, by Products, 2020-2027 (USD Million)

Table 42 Eastern Europe: Endovascular Aneurysm Repair Devices Market, by Region, 2020-2027 (USD Million)

Table 43 Asia-Pacific: Endovascular Aneurysm Repair Devices Market, by Indication, 2020-2027 (USD Million)

Table 44 Asia-Pacific: Endovascular Aneurysm Repair Devices Market, by Site, 2020-2027 (USD Million)

Table 45 Asia-Pacific: Endovascular Aneurysm Repair Devices Market, by Anatomy, 2020-2027 (USD Million)

Table 46 Asia-Pacific: Endovascular Aneurysm Repair Devices Market, by Products, 2020-2027 (USD Million)

Table 47 Asia-Pacific: Endovascular Aneurysm Repair Devices Market, by Region, 2020-2027 (USD Million)

Table 48 Middle East & Africa: Endovascular Aneurysm Repair Devices Market, by Indication, 2020-2027 (USD Million)

Table 49 Middle East & Africa: Endovascular Aneurysm Repair Devices Market, by Site, 2020-2027 (USD Million)

Table 50 Middle East & Africa: Endovascular Aneurysm Repair Devices Market, by Anatomy, 2020-2027 (USD Million)

Table 51 Middle East & Africa: Endovascular Aneurysm Repair Devices Market, by Products, 2020-2027 (USD Million)

Table 52 Middle East & Africa: Endovascular Aneurysm Repair Devices Market, by Region, 2020-2027 (USD Million)

LIST OF FIGURES

Figure 1 Research Process

Figure 2 Segmentation for Global Endovascular Aneurysm Repair Devices Market

Figure 3 Segmentation Market Dynamics for Global Endovascular Aneurysm Repair Devices Market

Figure 4 Global Endovascular Aneurysm Repair Devices Market Share, by Indication, 2020 (%)

Figure 5 Global Endovascular Aneurysm Repair Devices Market Share, by Site, 2020 (%)

Figure 6 Global Endovascular Aneurysm Repair Devices Market Share, by Anatomy, 2020 (%)

Figure 7 Global Endovascular Aneurysm Repair Devices Market Share, by Products, 2020 (%)

Figure 8 Global Endovascular Aneurysm Repair Devices Market Share, by Region, 2020 (%)

Figure 9 North America: Endovascular Aneurysm Repair Devices Market Share, by Country, 2020 (%)

Figure 10 Europe: Endovascular Aneurysm Repair Devices Market Share, by Country, 2020 (%)

Figure 11 Asia-Pacific: Endovascular Aneurysm Repair Devices Market Share, by Country, 2020 (%)

Figure 12 Middle East & Africa: Endovascular Aneurysm Repair Devices Market Share, by Country, 2020 (%)

Figure 13 Global Endovascular Aneurysm Repair Devices Market: Company Share Analysis, 2020 (%)

Figure 14 Cardiatis SA: Key Financials

Figure 15 Cardiatis SA: Segmental Revenue

Figure 16 Cardiatis SA: Geographical Revenue

Figure 17 Cardinal Health: Key Financials

Figure 18 Cardinal Health: Segmental Revenue

Figure 19 Cardinal Health: Geographical Revenue

Figure 20 Cook Medical LLC: Key Financials

Figure 21 Cook Medical LLC: Segmental Revenue

Figure 22 Cook Medical LLC: Geographical Revenue

Figure 23 Endologix, Inc.: Key Financials

Figure 24 Endologix, Inc.: Segmental Revenue

Figure 25 Endologix, Inc.: Geographical Revenue

Figure 26 Jotec GmbH: Key Financials

Figure 27 Jotec GmbH: Segmental Revenue

Figure 28 Jotec GmbH: Geographical Revenue

Figure 29 Medtronic plc: Key Financials

Figure 30 Medtronic plc: Segmental Revenue

Figure 31 Medtronic plc: Geographical Revenue

Figure 32 Terumo Corporation: Key Financials

Figure 33 Terumo Corporation: Segmental Revenue

Figure 34 Terumo Corporation: Geographical Revenue

Figure 35 W. L. Gore & Associates, Inc.: Key Financials

Figure 36 W. L. Gore & Associates, Inc.: Segmental Revenue

Figure 37 W. L. Gore & Associates, Inc.: Geographical Revenue

Figure 38 BiFlow Medical Ltd.: Key Financials

Figure 39 BiFlow Medical Ltd.: Segmental Revenue

Figure 40 BiFlow Medical Ltd.: Geographical Revenue

Figure 41 Boston Scientific Corporation: Key Financials

Figure 42 Boston Scientific Corporation: Segmental Revenue

Figure 43 Boston Scientific Corporation: Geographical Revenue

Figure 44 Braile Biomédica: Key Financials

Figure 45 Braile Biomédica: Segmental Revenue

Figure 46 Braile Biomédica: Geographical Revenue

Figure 47 Endoluminal Sciences Pty Ltd: Key Financials

Figure 48 Endoluminal Sciences Pty Ltd: Segmental Revenue

Figure 49 Endoluminal Sciences Pty Ltd: Geographical Revenue

Figure 50 Endospan Ltd.: Key Financials

Figure 51 Endospan Ltd.: Segmental Revenue

Figure 52 Endospan Ltd.: Geographical Revenue

Figure 53 Getinge AB: Key Financials

Figure 54 Getinge AB: Segmental Revenue

Figure 55 Getinge AB: Geographical Revenue

Figure 56 LeMaitre Vascular, Inc.: Key Financials

Figure 57 LeMaitre Vascular, Inc.: Segmental Revenue

Figure 58 LeMaitre Vascular, Inc.: Geographical Revenue

Leading companies partner with us for data-driven Insights.
Report List icon Report List icon Report List icon Report List icon Report List icon Report List icon Report List icon Report List icon Report List icon Report List icon Report List icon

Kindly complete the form below to receive a free sample of this Report

Please fill in Business Email for Quick Response
Invalid