Segmentation Quick Reference
| Dimension | Sub-Segments | Dominant Segment | Fastest Growing Segment |
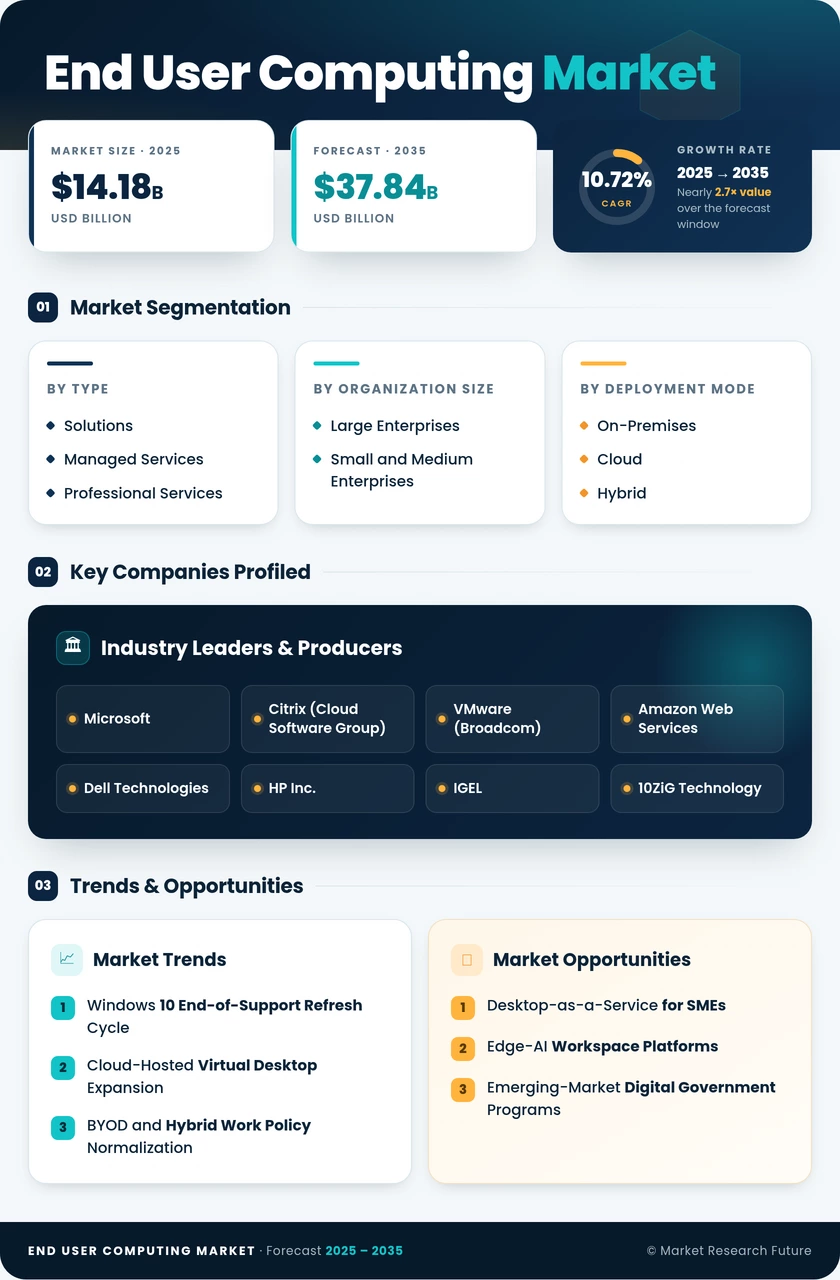
| Product Type | Solutions, Managed Services, Professional Services | Solutions | Managed Services |
| Organization Size | Large Enterprises, Small and Medium Enterprises | Large Enterprises | Small and Medium Enterprises |
| Deployment Mode | On-Premises, Cloud, Hybrid | On-Premises | Cloud |
| End-User Industry | IT and Telecom, BFSI, Healthcare, Government, Manufacturing, Others | IT and Telecom | Healthcare |
| Delivery Model | Virtual Desktop Infrastructure, Desktop-as-a-Service, Remote Browser Isolation, Application Virtualization | Virtual Desktop Infrastructure | Desktop-as-a-Service |
Market Segmentation Overview
By Product Type
| Sub-Segment | Key Trend |
| Solutions | Integrated suites combining VDI, security, and application delivery dominate enterprise procurement |
| Managed Services | Outsourced Desktop-as-a-Service operations accelerating among SMEs seeking OpEx-model pricing |
| Professional Services | Migration consulting demand peaking during the Windows 10 end-of-support transition cycle |
Solutions remain the largest product type as enterprises consolidate virtual desktop infrastructure, endpoint security, and unified endpoint management for EUC into single-vendor platforms. Managed Services are growing fastest as providers absorb operational complexity for cost-sensitive buyers.
By Organization Size
| Sub-Segment | Key Trend |
| Large Enterprises | Multi-site zero-trust endpoint deployments with hybrid VDI-DaaS architectures |
| Small and Medium Enterprises | Consumption-based DaaS subscriptions replacing traditional PC refresh cycles |
Large enterprises drive the majority of absolute spending due to complex, globally distributed workforces. SMEs are the growth engine, attracted by Desktop-as-a-Service models that eliminate upfront infrastructure investment.
By Deployment Mode
| Sub-Segment | Key Trend |
| On-Premises | Still preferred by regulated industries requiring full data sovereignty control |
| Cloud | Fastest-growing mode driven by hyperscaler VDI/DaaS investment |
| Hybrid | Dominant transitional architecture for enterprises migrating from legacy on-premises setups |
Cloud deployments are overtaking on-premises in growth terms as secure remote desktop for distributed teams becomes the default work architecture. Hybrid remains the pragmatic middle ground for organizations with multi-year migration plans.
By End-User Industry
| Sub-Segment | Key Trend |
| IT and Telecom | Largest vertical; massive VDI farms supporting remote developer and BPO workforces |
| BFSI | Regulatory compliance driving secure desktop deployments for trading and contact centers |
| Healthcare | Fastest-growing; telehealth expansion and HIPAA-compliant zero-client thin client computing solutions |
| Government | Zero-trust mandates accelerating endpoint modernization across federal and state agencies |
| Manufacturing | Connected-worker programs deploying thin clients on factory floors |
IT and Telecom anchors the end user computing market with the largest installed base of virtual desktops globally. Healthcare is emerging as the fastest-growing vertical as clinical endpoint security requirements intensify.
By Delivery Model
| Sub-Segment | Key Trend |
| Virtual Desktop Infrastructure | Dominant model for full desktop experience with centralized IT control |
| Desktop-as-a-Service | Fastest-growing; cloud-native pay-per-user model favored by SMEs and hybrid workforces |
| Remote Browser Isolation | Growing niche for web-centric workloads requiring minimal attack surface |
| Application Virtualization | Legacy app delivery without full desktop overhead; steady adoption in regulated industries |
Virtual desktop infrastructure remains the foundational delivery model, while Desktop-as-a-Service is rapidly closing the share gap as hyperscaler capacity expands and pricing becomes increasingly competitive.