EMC Cable Glands Market Segmentation
EMC Cable Glands Market By Type (USD Billion, 2025-2035)
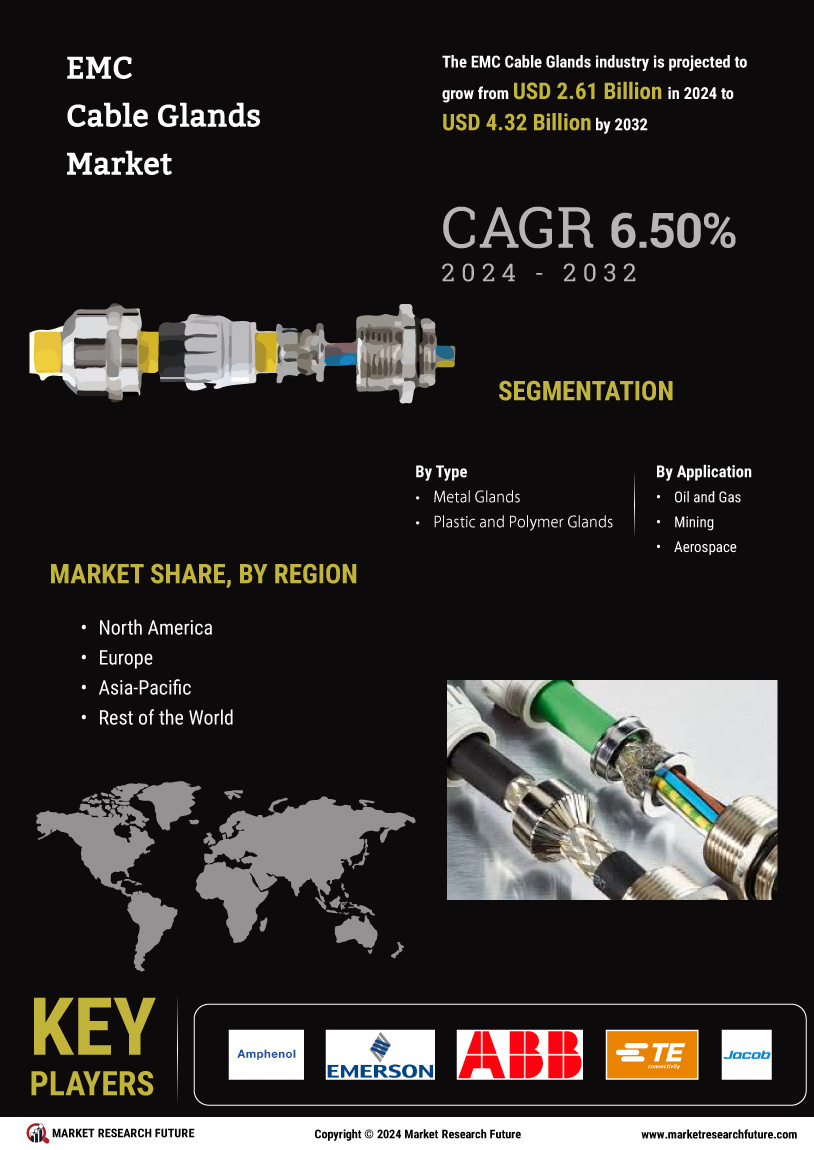
- Metal Glands
- Plastic and Polymer Glands
EMC Cable Glands Market By Application (USD Billion, 2025-2035)
- Oil and Gas
- Mining
- Aerospace
- Chemical Industry
- Others