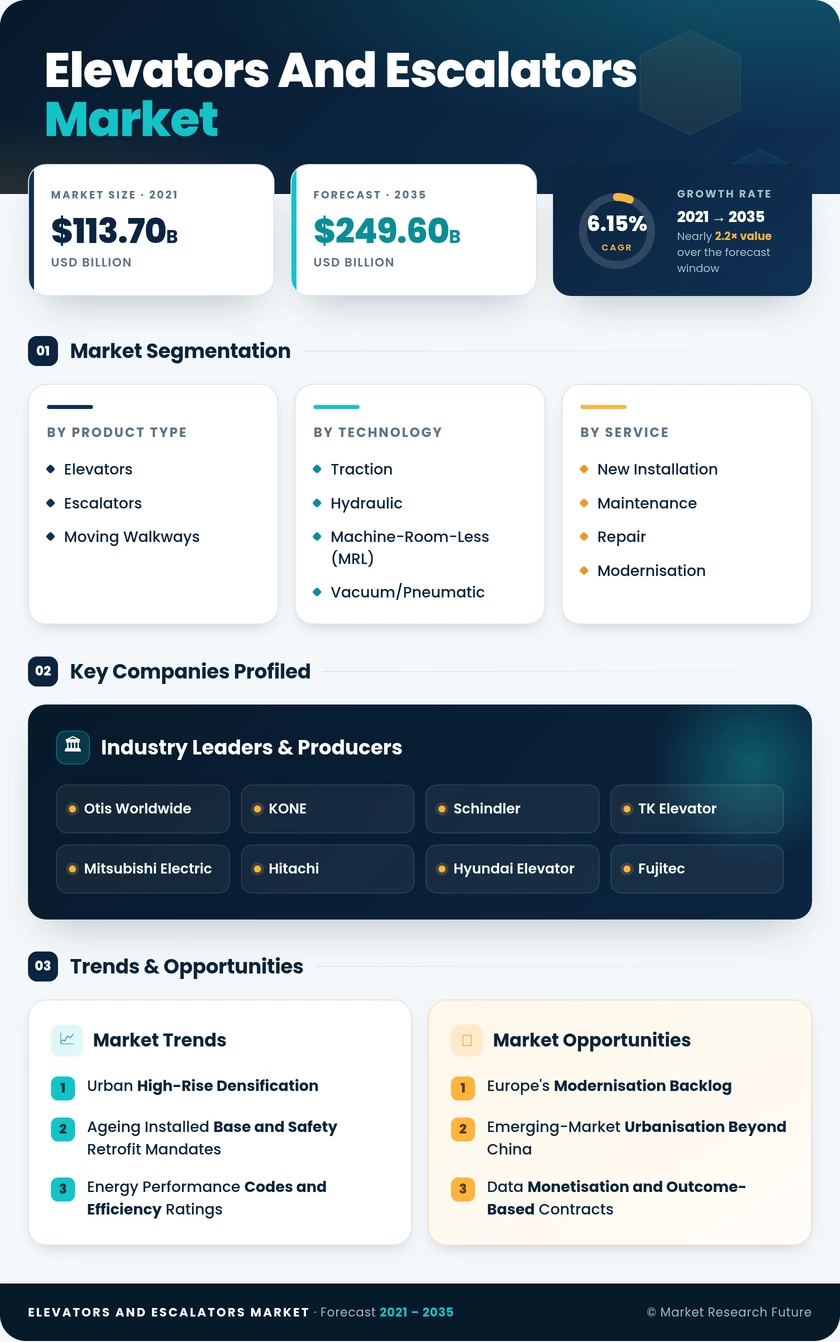
Elevators and Escalators Market (2026 - 2035)

ID: MRFR/PCM/4070-HCR 111 Pages Snehal Singh Last Updated: October 17, 2026
Elevators and Escalators Market Research Report Information By Product Type (Elevators, Escalators, and Moving Walkways), By Technology (Traction, Hydraulic, Machine-Room-Less (MRL), and Vacuum/Pneumatic), By Service (New Installation, Maintenance and Repair, and Modernisation), and By End-user (Residential, Commercial, Infrastructure, and Industrial) – Forecast Till 2035.
Elevators and Escalators Market
Market Size
Forecast Period2026-2035
CAGR (2026-2035)6.15%
2025 Market SizeUSD 137.27 Billion
2035 Market SizeUSD 249.60 Billion
Key Players
Otis Worldwide
KONE
Schindler
TK Elevator
Mitsubishi Electric
Hitachi
Opportunities
  • Europe's Modernisation Backlog
  • Emerging-Market Urbanisation Beyond China
  • Data Monetisation and Outcome-Based Contracts
  1. 1 Market Summary | |
    1. 1.1 Study Assumptions & Market Definition | |
    2. 1.2 Scope of the Study | |
    3. 1.3 Research Methodology | |
  2. 2 Key Report Takeaways | |
    1. 2.1 By Product Type | |
    2. 2.2 By Technology | |
    3. 2.3 By Service | |
    4. 2.4 By End-user | |
    5. 2.5 By Region | |
  3. 3 Market Size and Forecast (2021–2035) | |
    1. 3.1 Historical Market Size (2021–2024) | |
    2. 3.2 Base Year Assessment (2025) | |
    3. 3.3 Forecast Market Size (2026–2035) | |
    4. 3.4 Year-over-Year Growth Analysis | |
  4. 4 Driver Impact Analysis | |
    1. 4.1 Urban High-Rise Densification | |
    2. 4.2 Ageing Installed Base and Safety Retrofit Mandates | |
    3. 4.3 Energy Performance Codes and Efficiency Ratings | |
    4. 4.4 Metro, Rail and Airport Capital Programmes | |
    5. 4.5 Accessibility Legislation and Demographic Ageing | |
    6. 4.6 Digitalised Service and Predictive Maintenance | |
    7. 4.7 Machine-Room-Less Floor-Area Economics | |
  5. 5 Restraints Impact Analysis | |
    1. 5.1 Stalled High-Rise Pipelines and Property Contraction | |
    2. 5.2 Installation and Service Technician Shortage | |
    3. 5.3 Component Cost Volatility and Price Competition | |
    4. 5.4 Certification and Code Fragmentation | |
    5. 5.5 Retrofit Disruption and Building Downtime Cost | |
  6. 6 Opportunities | |
    1. 6.1 Europe's Modernisation Backlog | |
    2. 6.2 Emerging-Market Urbanisation Beyond China | |
    3. 6.3 Data Monetisation and Outcome-Based Contracts | |
    4. 6.4 Destination Dispatch and AI Traffic Management | |
    5. 6.5 Ultra-Tall and High-Speed Niche Applications | |
  7. 7 Regional Market Share and Country-Level Analysis | |
    1. 7.1 North America | | |
      1. 7.1.1 United States | | |
      2. 7.1.2 Canada | | |
      3. 7.1.3 Mexico | |
    2. 7.2 Europe | | |
      1. 7.2.1 Germany | | |
      2. 7.2.2 United Kingdom | | |
      3. 7.2.3 France | | |
      4. 7.2.4 Italy | | |
      5. 7.2.5 NORDIC Countries | | |
      6. 7.2.6 Russia | | |
      7. 7.2.7 Rest of Europe | |
    3. 7.3 Asia-Pacific | | |
      1. 7.3.1 China | | |
      2. 7.3.2 India | | |
      3. 7.3.3 Japan | | |
      4. 7.3.4 South Korea | | |
      5. 7.3.5 ASEAN Countries | | |
      6. 7.3.6 Rest of Asia-Pacific | |
    4. 7.4 South America | | |
      1. 7.4.1 Brazil | | |
      2. 7.4.2 Argentina | | |
      3. 7.4.3 Chile | | |
      4. 7.4.4 Rest of South America | |
    5. 7.5 Middle East and Africa | | |
      1. 7.5.1 Saudi Arabia | | |
      2. 7.5.2 United Arab Emirates | | |
      3. 7.5.3 South Africa | | |
      4. 7.5.4 Egypt | | |
      5. 7.5.5 Rest of Middle East and Africa | |
  8. 8 Future Outlook (2026–2035) | |
    1. 8.1 Autonomous Traffic Management and AI Dispatch | |
    2. 8.2 Service Platform Economics | |
    3. 8.3 Electrification, Efficiency and Emissions Reporting | |
    4. 8.4 Circularity and Embodied Carbon | |
  9. 9 Segmentation Analysis | |
    1. 9.1 By Product Type | | |
      1. 9.1.1 Elevators | | |
      2. 9.1.2 Escalators | | |
      3. 9.1.3 Moving Walkways | |
    2. 9.2 By Technology | | |
      1. 9.2.1 Traction | | |
      2. 9.2.2 Hydraulic | | |
      3. 9.2.3 Machine-Room-Less (MRL) | | |
      4. 9.2.4 Vacuum/Pneumatic | |
    3. 9.3 By Service | | |
      1. 9.3.1 New Installation | | |
      2. 9.3.2 Maintenance and Repair | | |
      3. 9.3.3 Modernisation | |
    4. 9.4 By End-user | | |
      1. 9.4.1 Residential | | |
      2. 9.4.2 Commercial | | |
      3. 9.4.3 Infrastructure | | |
      4. 9.4.4 Industrial | |
  10. 10 Competitive Landscape | |
    1. 10.1 Market Concentration Analysis (2026) | |
    2. 10.2 Competitive Benchmarking Matrix | |
    3. 10.3 Company Profiles | |
  11. 11 Recent News & Developments | |
  12. 12 Report Scope and Methodology | |
    1. 12.1 Study Period & Base Year | |
    2. 12.2 Data Sources & Citations | |
    3. 12.3 Abbreviations | |
  13. 13 Detailed Sources and Citations | |
  14. 14 Frequently Asked Questions (FAQs) | | LIST OF TABLES | |
  15. TABLE 1 Global Market Size & Forecast, by Revenue (USD Billion), 2021–2035 | |
  16. TABLE 2 Year-over-Year Growth Analysis, 2021–2035 | |
  17. TABLE 3 Driver Impact Analysis Matrix, 2026–2035 | |
  18. TABLE 4 Restraint Impact Analysis Matrix, 2026–2035 | |
  19. TABLE 5 Global Market Size, by Region, 2021–2035 (USD Billion) | |
  20. TABLE 6 North America Market Size, by Country, 2021–2035 (USD Billion) | |
  21. TABLE 7 Europe Market Size, by Country, 2021–2035 (USD Billion) | |
  22. TABLE 8 Asia-Pacific Market Size, by Country, 2021–2035 (USD Billion) | |
  23. TABLE 9 South America Market Size, by Country, 2021–2035 (USD Billion) | |
  24. TABLE 10 Middle East and Africa Market Size, by Country, 2021–2035 (USD Billion) | |
  25. TABLE 11 Global Market Size, by Product Type, 2021–2035 (USD Billion) | |
  26. TABLE 12 Global Market Size, by Technology, 2021–2035 (USD Billion) | |
  27. TABLE 13 Global Market Size, by Service, 2021–2035 (USD Billion) | |
  28. TABLE 14 Global Market Size, by End-user, 2021–2035 (USD Billion) | |
  29. TABLE 15 Competitive Benchmarking Matrix, 2026 | |
  30. TABLE 16 Company Profiles — Key Players | |
  31. TABLE 17 Recent Developments & Strategic Announcements, 2023–2025 | |
  32. TABLE 18 Report Scope & Methodology Summary | |
  33. TABLE 19 Detailed Sources and Citations Index | |
  34. TABLE 20 Segmentation Quick Reference — Dominant and Fastest-Growing Segments | | LIST OF FIGURES | |
  35. FIGURE 1 Market Dynamics — Drivers, Restraints and Opportunities Overview | |
  36. FIGURE 2 Industry Value Chain Analysis | |
  37. FIGURE 3 Porter's Five Forces Analysis | |
  38. FIGURE 4 Global Market Size Trend, 2021–2035 (USD Billion) | |
  39. FIGURE 5 Year-over-Year Growth Curve, 2022–2035 | |
  40. FIGURE 6 Market Share by Product Type, 2025 vs 2035 | |
  41. FIGURE 7 Market Share by Technology, 2025 vs 2035 | |
  42. FIGURE 8 Market Share by Service, 2025 vs 2035 | |
  43. FIGURE 9 Market Share by End-user, 2025 vs 2035 | |
  44. FIGURE 10 Regional Revenue Share, 2025 | |
  45. FIGURE 11 Regional CAGR Comparison, 2026–2035 | |
  46. FIGURE 12 Competitive Landscape — Estimated Revenue Share Bands, 2026 | |
  47. FIGURE 13 Service Revenue Mix Evolution, 2025–2035

Segmentation Quick Reference

DimensionSub-SegmentsDominant SegmentFastest Growing Segment
By Product TypeElevators; Escalators; Moving WalkwaysElevators (74.0% share, 2025)Moving Walkways (6.9% CAGR, 2026–2035)
By TechnologyTraction; Hydraulic; Machine-Room-Less (MRL); Vacuum/PneumaticTraction (65.1% share, 2025)Machine-Room-Less (MRL) (7.3% CAGR, 2026–2035)
By ServiceNew Installation; Maintenance and Repair; ModernisationNew Installation (44.5% share, 2025)Modernisation (7.4% CAGR, 2026–2035)
By End-userResidential; Commercial; Infrastructure; IndustrialResidential (40.3% share, 2025)Infrastructure (6.4% CAGR, 2026–2035)


Market Segmentation Overview

By Product Type

Sub-SegmentKey Trend
ElevatorsPassenger units dominate volume; high-speed and home variants expand at opposite ends of the price ladder
EscalatorsParallel layouts anchor retail and metro demand; heavy-duty specification rises in Asian transit hubs
Moving WalkwaysHorizontal units scale with airport concourse length; inclined variants stay confined to hillside and multi-level retail


Elevators lead this dimension at 74.0% of 2025 revenue because every mid- and high-rise building requires them by code, whereas escalators and walkways are specified only where footfall justifies them. Moving Walkways grow fastest at a 6.9% CAGR, driven by terminal expansion programmes where walking distances between gates exceed comfortable thresholds. Escalators occupy a stable middle position: retail and metro operators replace them on a roughly 20-year cycle, and supertall developers increasingly reallocate budget from escalator banks toward express passenger cars and sky lobbies.

By Technology

Sub-SegmentKey Trend
TractionCarbon-fibre rope and permanent-magnet gearless machines extend travel height beyond 500 metres
HydraulicEnvironmental restrictions on mineral-oil systems erode share outside low-rise freight duty
Machine-Room-Less (MRL)Recovered shaft-adjacent floor area and top ISO 25745 efficiency classes drive substitution
Vacuum/PneumaticMinimal pit depth suits residential retrofit; capacity limited to three or four passengers


Traction holds 65.1% of 2025 revenue because speed and travel-height requirements above roughly six storeys leave no practical alternative, and rope innovation has widened that advantage. Machine-Room-Less (MRL) is the fastest-growing sub-segment at a 7.3% CAGR, since eliminating the machine room returns 10–15 m² per shaft to the developer and delivers efficiency classes that Hydraulic systems cannot achieve. Hydraulic units decline as oil-containment rules tighten, retaining relevance only where low rise and heavy freight loads coincide.

By Service

Sub-SegmentKey Trend
New InstallationConcentrated in Asia-Pacific and Gulf construction cycles; sensitive to developer credit conditions
Maintenance and RepairPredictive platforms convert emergency callouts into scheduled work, lifting margin and retention
ModernisationEN 81-80 compliance deadlines and leasing structures accelerate replacement of pre-2000 equipment


New Installation retains the largest share at 44.5% of 2025 revenue, but its dependence on construction credit makes it the most cyclical line in the portfolio. Modernisation grows fastest at a 7.4% CAGR because European upgrade schedules attach hard dates to work that owners would otherwise defer indefinitely, and vendor financing removes the capital hurdle. Maintenance and Repair sits between the two as the annuity that funds branch networks, with contractual penetration above 90% of the installed base in mature European markets.

By End-user

Sub-SegmentKey Trend
ResidentialHigh-rise housing in Asia plus accessibility retrofits into ageing European and Japanese walk-up stock
CommercialOffices specify touchless and destination dispatch; retail and hospitality prioritise peak-crowd escalator capacity
InfrastructureMetro, rail and airport programmes generate the largest single-order volumes in the industry
IndustrialWarehouse freight duty remains cost-sensitive and favours lower-capital drive configurations


Residential leads at 40.3% of 2025 revenue, combining new Asian tower construction with a steady European and Japanese retrofit stream tied to demographic ageing. Infrastructure grows fastest at a 6.4% CAGR as national metro and airport programmes commit multi-year capital, exemplified by Gulf contract awards that concentrate very large orders in few hands. Commercial demand is renewal-led rather than volume-led, since landlords upgrade dispatch and energy performance to defend occupancy, while Industrial buyers stay the most price-sensitive cohort.




Download PDF ×

We do not share your information with anyone. However, we may send you emails based on your report interest from time to time. You may contact us at any time to opt-out.