Segmentation Quick Reference
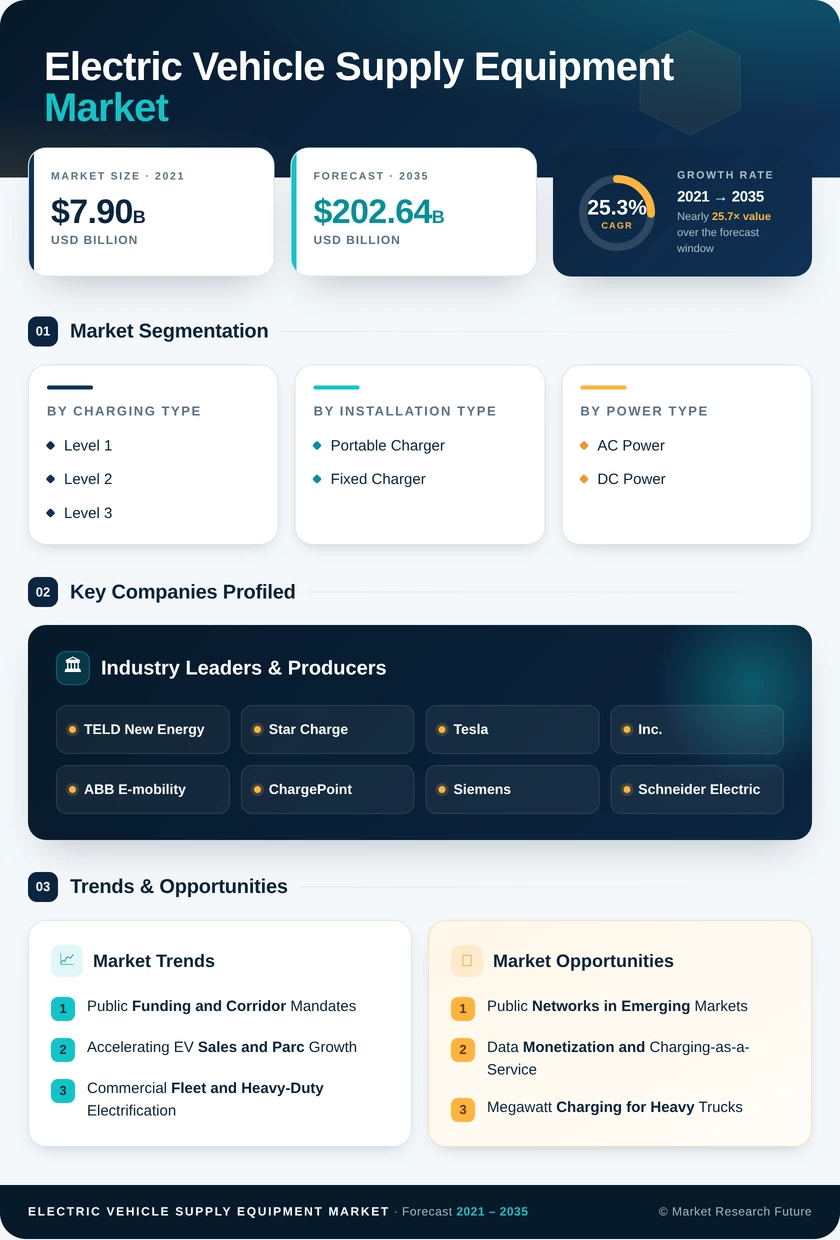
| Dimension | Sub-Segments | Dominant Segment | Fastest Growing Segment |
|---|---|---|---|
| By Charging Type | Level 1, Level 2, Level 3 | Level 2 (60.0% share) | Level 3 (28.4% CAGR) |
| By Installation Type | Portable Charger, Fixed Charger | Fixed Charger (77.5% share) | Portable Charger (31.0% CAGR) |
| By Power Type | AC Power, DC Power | AC Power (68.6% share) | DC Power (27.7% CAGR) |
| By Application | Residential, Commercial | Commercial (61.5% share) | Commercial (61.5% share) |
| By End User | EV Owners, Fleet Operators, CPOs, Others | EV Owners (38.1% share) | CPOs (28.9% CAGR) |
| By Region | North America, Europe, Asia-Pacific, South America, Middle East & Africa | Asia-Pacific (52.4% share) | Middle East & Africa (31.6% CAGR) |
Market Segmentation Overview
By Charging Type
| Sub-Segment | Key Trend |
|---|---|
| Level 1 | Declining role as backup charging |
| Level 2 | Load-managed units for homes, workplaces and multifamily sites |
| Level 3 | 250–400 kW corridor and urban hub deployments |
Level 2 leads with a 60.0% share because its cost and power level fit long dwell times at homes and workplaces. Level 3 grows fastest at a 28.4% CAGR as newer vehicles accept higher charging power and NEVI and AFIR specify high-power corridor sites. Level 1 continues to lose relevance outside emergency and portable use.
By Installation Type
| Sub-Segment | Key Trend |
|---|---|
| Portable Charger | Battery-backed trailer units for depots and events |
| Fixed Charger | Permanent, weatherproof units tied to dedicated circuits |
Fixed Charger installations lead with a 77.5% share, since permanent grid connections give hosts reliability, security and predictable insurance terms. Portable Charger demand grows fastest at a 31.0% CAGR because battery-buffered units avoid grid upgrade queues and let fleets trial depot locations before committing capital.
By Power Type
| Sub-Segment | Key Trend |
|---|---|
| AC Power | High-efficiency wallboxes with smart-charging functions |
| DC Power | Modular cabinets scaling from 150 kW to 600 kW |
AC Power leads with a 68.6% share because it uses existing building wiring and suits overnight residential and workplace charging. DC Power grows faster at a 27.7% CAGR, driven by corridor mandates and fleets that need short turnaround times, with modular cabinets reducing the risk of hardware obsolescence.
By Application
| Sub-Segment | Key Trend |
|---|---|
| Residential | Smart chargers integrated with home solar and batteries |
| Commercial | Public hubs, retail co-location and megawatt fleet depots |
Commercial applications lead with a 61.5% share and also grow fastest, as public hubs, workplaces and fleet depots absorb most new high-power capacity. Residential installations hold 38.5% but expand more slowly as early-adopter homes reach saturation, with future growth tied to multifamily retrofits required under building codes.
By End User
| Sub-Segment | Key Trend |
|---|---|
| EV Owners | Home chargers bundled with vehicle purchases |
| Fleet Operators | Depot charging with energy management and telematics |
| CPOs | Rapid public network expansion backed by automakers and energy majors |
| Others | Municipal, utility and property-owner deployments |
EV Owners lead with a 38.1% share, as most new EV buyers install a home charger at purchase. CPOs grow fastest at a 28.9% CAGR, backed by corridor funding and automaker joint ventures, while Fleet Operators buy high-value megawatt connections and multi-year service contracts that raise average deal sizes.


 Noah Malgeri
Co-Founder

 Peter Groot koerkamp
Account and Business Manager

 Younghwan Choi
Senior Retail Manager

 Mark Irwin
Management Consultant

 Akif Moroglu
Strategy & Business Development Director

 Guilherme Gomes Martins
Product Management Director

 Joseph Aguayo
Sales Operations & Pricing Manager

 La Terria Dodd
Program Support Specialist

 Rob Kooiker
Group Product Manager HVAC & Fire Protection GMA