Electric Vehicle Battery Manufacturing Equipment Market (2026 - 2035)

ID: MRFR/EnP/39762-HCR 100 Pages Snehal Singh Last Updated: October 23, 2026
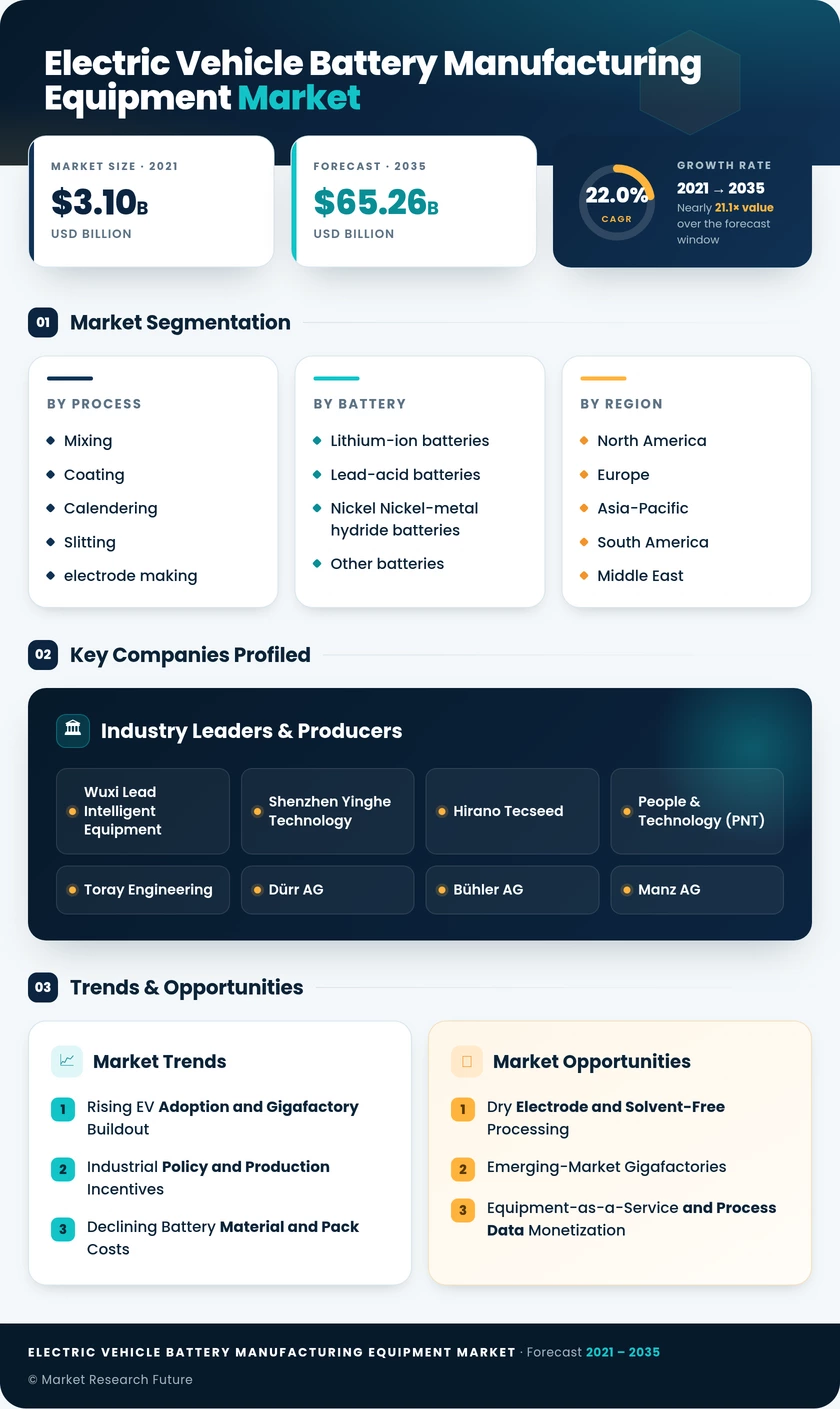
Electric Vehicle Battery Manufacturing Equipment Market Research Report By Process (Mixing, Coating, Calendering, Slitting and Electrode Making, Other Processes), By Battery (Lithium-ion Batteries, Lead-acid Batteries, Nickel Metal Hydride Batteries, Other Batteries) and By Regional (North America, Europe, South America, Asia Pacific, Middle East and Africa) - Forecast to 2035
Electric Vehicle Battery Manufacturing Equipment Market
Market Size
Forecast Period2026-2035
CAGR (2026-2035)22.0%
2025 Market SizeUSD 8.70 Billion
2035 Market SizeUSD 65.26 Billion
Key Players
Wuxi Lead Intelligent Equipment
Shenzhen Yinghe Technology
Hirano Tecseed
People & Technology
Toray Engineering
Dürr AG
Opportunities
  • Dry Electrode and Solvent-Free Processing
  • Emerging-Market Gigafactories
  • Equipment-as-a-Service and Process Data Monetization
  1. 1 Market Summary | |
  2. 2 Key Report Takeaways | |
    1. 2.1 By Process | |
    2. 2.2 By Battery | |
    3. 2.3 By Region | |
  3. 3 Market Size and Forecast (2021–2035) | |
    1. 3.1 Historical Market Size (2021–2024) | |
    2. 3.2 Base Year Market Size (2025) | |
    3. 3.3 Forecast Market Size (2026–2035) | |
    4. 3.4 Year-over-Year Growth Analysis | |
  4. 4 Driver Impact Analysis | |
    1. 4.1 Rising EV Adoption and Gigafactory Buildout | |
    2. 4.2 Industrial Policy and Production Incentives | |
    3. 4.3 Declining Battery Material and Pack Costs | |
    4. 4.4 Chemistry Diversification | |
    5. 4.5 Automation and AI-Based Quality Control | |
    6. 4.6 Supply Chain Localization and Traceability Rules | |
  5. 5 Restraints Impact Analysis | |
    1. 5.1 Capital Intensity and Project Cancellations | |
    2. 5.2 Continued Dependence on Internal Combustion Vehicles | |
    3. 5.3 Overcapacity and Price Pressure in China | |
    4. 5.4 Skilled Labor Shortages and Ramp-Up Risk | |
    5. 5.5 Trade Barriers and Tariffs | |
  6. 6 Opportunities | |
    1. 6.1 Dry Electrode and Solvent-Free Processing | |
    2. 6.2 Emerging-Market Gigafactories | |
    3. 6.3 Equipment-as-a-Service and Process Data Monetization | |
    4. 6.4 Next-Generation Chemistry Pilot Lines | |
  7. 7 Regional Market Share and Country-Level Analysis | |
    1. 7.1 North America | | |
      1. 7.1.1 United States | | |
      2. 7.1.2 Canada | | |
      3. 7.1.3 Rest of North America | |
    2. 7.2 Europe | | |
      1. 7.2.1 United Kingdom | | |
      2. 7.2.2 Spain | | |
      3. 7.2.3 NORDIC Countries | | |
      4. 7.2.4 Turkey | | |
      5. 7.2.5 Russia | | |
      6. 7.2.6 Rest of Europe | |
    3. 7.3 Asia-Pacific | | |
      1. 7.3.1 China | | |
      2. 7.3.2 India | | |
      3. 7.3.3 Malaysia | | |
      4. 7.3.4 Thailand | | |
      5. 7.3.5 Indonesia | | |
      6. 7.3.6 Vietnam | | |
      7. 7.3.7 South Korea | | |
      8. 7.3.8 Rest of Asia-Pacific | |
    4. 7.4 South America | | |
      1. 7.4.1 Brazil | | |
      2. 7.4.2 Argentina | | |
      3. 7.4.3 Colombia | | |
      4. 7.4.4 Rest of South America | |
    5. 7.5 Middle East and Africa | | |
      1. 7.5.1 United Arab Emirates | | |
      2. 7.5.2 Saudi Arabia | | |
      3. 7.5.3 Egypt | | |
      4. 7.5.4 Nigeria | | |
      5. 7.5.5 Qatar | | |
      6. 7.5.6 Rest of Middle East and Africa | |
  8. 8 Future Outlook (2026–2035) | |
    1. 8.1 AI-Driven Process Control and Digital Twins | |
    2. 8.2 Chemistry Retooling Cycles | |
    3. 8.3 Localization Supercycle | |
    4. 8.4 Carbon Footprint and Sustainability Reporting | |
  9. 9 Segmentation Analysis | |
    1. 9.1 By Process | | |
      1. 9.1.1 Mixing | | |
      2. 9.1.2 Coating | | |
      3. 9.1.3 Calendering | | |
      4. 9.1.4 Slitting and electrode making | | |
      5. 9.1.5 Other processes | |
    2. 9.2 By Battery | | |
      1. 9.2.1 Lithium-ion batteries | | |
      2. 9.2.2 Lead-acid batteries | | |
      3. 9.2.3 Nickel metal hydride batteries | | |
      4. 9.2.4 Other batteries | |
  10. 10 Competitive Landscape | |
    1. 10.1 Market Concentration Analysis | |
    2. 10.2 Competitive Benchmarking Matrix | |
    3. 10.3 Company Profiles | | |
      1. 10.3.1 Wuxi Lead Intelligent Equipment | | |
      2. 10.3.2 Shenzhen Yinghe Technology | | |
      3. 10.3.3 Hirano Tecseed | | |
      4. 10.3.4 People & Technology (PNT) | | |
      5. 10.3.5 Toray Engineering | | |
      6. 10.3.6 Dürr AG | | |
      7. 10.3.7 Bühler AG | | |
      8. 10.3.8 Manz AG | | |
      9. 10.3.9 Hitachi High-Tech | | |
      10. 10.3.10 Schuler AG | | |
      11. 10.3.11 CKD Corporation | |
  11. 11 Recent News & Developments | |
  12. 12 Report Scope and Methodology | |
  13. 13 Detailed Sources and Citations | |
  14. 14 Frequently Asked Questions (FAQs) | | LIST OF TABLES | |
  15. TABLE 1 Global Market Summary Snapshot, 2025 and 2035 | |
  16. TABLE 2 Global EV Battery Manufacturing Equipment Market Size & Forecast, by Revenue (USD Billion), 2021–2035 | |
  17. TABLE 3 Year-over-Year Growth Analysis, 2021–2035 | |
  18. TABLE 4 Driver Impact Analysis | |
  19. TABLE 5 Restraints Impact Analysis | |
  20. TABLE 6 Regional Market Summary, 2025 | |
  21. TABLE 7 North America, by Country, 2025 | |
  22. TABLE 8 Europe, by Country, 2025 | |
  23. TABLE 9 Asia-Pacific, by Country, 2025 | |
  24. TABLE 10 South America, by Country, 2025 | |
  25. TABLE 11 Middle East and Africa, by Country, 2025 | |
  26. TABLE 12 Segmentation by Process, 2025 | |
  27. TABLE 13 Segmentation by Battery, 2025 | |
  28. TABLE 14 Competitive Benchmarking Matrix | |
  29. TABLE 15 Report Scope and Methodology | |
  30. TABLE 16 Detailed Sources and Citations | |
  31. TABLE 17 Segmentation Quick Reference | |
  32. TABLE 18 Process Sub-Segment Key Trends | |
  33. TABLE 19 Battery Sub-Segment Key Trends | | LIST OF FIGURES | |
  34. FIGURE 1 Market Dynamics Overview (Drivers, Restraints, Opportunities) | |
  35. FIGURE 2 Industry Value Chain Analysis | |
  36. FIGURE 3 Porter's Five Forces Analysis | |
  37. FIGURE 4 Global Market Size Trend, 2021–2035 (USD Billion) | |
  38. FIGURE 5 Year-over-Year Growth Rate, 2021–2035 | |
  39. FIGURE 6 Market Share by Process, 2025 | |
  40. FIGURE 7 Market Share by Battery, 2025 | |
  41. FIGURE 8 Regional Market Share, 2025 | |
  42. FIGURE 9 Regional CAGR Comparison, 2026–2035 | |
  43. FIGURE 10 Asia-Pacific Country Share, 2025 | |
  44. FIGURE 11 Competitive Landscape Positioning Matrix | |
  45. FIGURE 12 Estimated Revenue Share Ranges of Key Players

Segmentation Quick Reference

DimensionSub-SegmentsDominant SegmentFastest Growing Segment
By ProcessMixing; Coating; Calendering; Slitting and electrode making; Other processesCoating (31.2% share)Slitting and electrode making (23.9% CAGR)
By BatteryLithium-ion batteries; Lead-acid batteries; Nickel-metal hydride batteries; Other batteriesLithium-ion batteries (86.5% share)Other batteries (31.5% CAGR)
By RegionNorth America; Europe; Asia-Pacific; South America; Middle East and AfricaAsia-Pacific (58.4% share)North America (26.8% CAGR)

Market Segmentation Overview

By Process

Sub-SegmentKey Trend
MixingShift from batch planetary mixers to continuous twin-screw systems
CoatingWider webs, faster lines and early dry electrode adoption
CalenderingHigher-pressure rolls for denser, thicker electrodes.
Slitting and electrode makingLaser notching replacing mechanical die cutting.
Other processesFaster formation cycles and inline end-of-line testing

Coating leads this dimension with a 31.2% share because coating weight uniformity sets cell capacity and safety, making coaters the costliest and most closely specified machines on an electrode line. Slitting and electrode making grow fastest, at a 23.9% CAGR, as stacking-ready formats for prismatic and pouch cells require precise laser notching. Mixing and calendering follow the same push toward continuous, higher-density processing.

By Battery

Sub-SegmentKey Trend
Lithium-ion batteriesLFP gaining ground alongside high-nickel NMC lines
Lead-acid batteriesStable demand for auxiliary and low-speed vehicle batteries
Nickel metal hydride batteriesNiche demand tied to hybrid vehicle output.
Other batteriesSodium-ion scale-up and solid-state pilot lines

Lithium-ion batteries dominate with an 86.5% share because nearly every battery-electric vehicle relies on NMC or LFP cells, and new gigafactories are designed around them. Other batteries grow fastest at a 31.5% CAGR, led by sodium-ion lines in China and solid-state pilot programs that need dry-room handling and high-pressure stacking. Nickel metal hydride and lead-acid batteries remain mature niches with replacement-driven equipment demand.


Download PDF ×

We do not share your information with anyone. However, we may send you emails based on your report interest from time to time. You may contact us at any time to opt-out.