EV Battery Electrolyte Market (2026 - 2035)

ID: MRFR/EnP/63876-HCR 128 Pages Snehal Singh Last Updated: October 16, 2026
Electric Vehicle Battery Electrolyte Market Research Report By Battery Type (Lithium-ion Batteries, Lead-acid Batteries, Other Battery Types), By Electrolyte Type (Liquid Electrolytes, Gel Electrolytes, Solid Electrolytes) - Forecast to 2035
EV Battery Electrolyte Market
Market Size
Forecast Period2026-2035
CAGR (2026-2035)11.85%
2025 Market SizeUSD 9.8 Billion
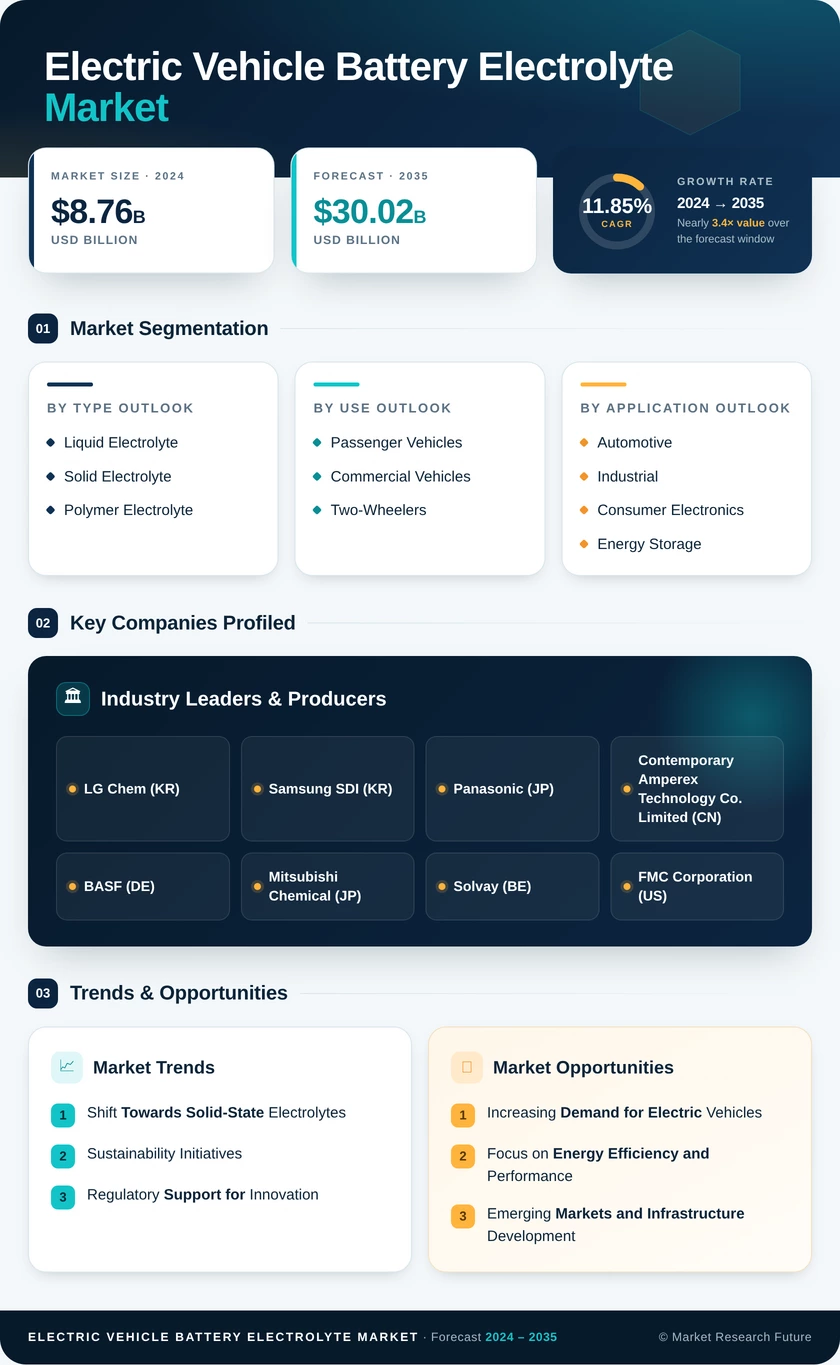
2035 Market SizeUSD 30.02 Billion
Key Players
Guangzhou Tinci Materials Technology
Shenzhen Capchem Technology
Jiangsu Guotai Super Power New Materials
Zhuhai Smoothway Electronic Materials
Mitsubishi Chemical Group
Soulbrain
Opportunities
  • Sodium-Ion Electrolyte Supply
  • Localized Blending Near Western Gigafactories
  • Emerging-Market Cell Manufacturing
  1. 1 Market Summary | |
  2. 2 Key Report Takeaways | |
    1. 2.1 By Battery Type | |
    2. 2.2 By Electrolyte Type | |
    3. 2.3 By Region | |
  3. 3 Market Size and Forecast (2021–2035) | |
    1. 3.1 Historical Market Size (2021–2025) | |
    2. 3.2 Forecast Market Size (2026–2035) | |
    3. 3.3 Year-over-Year Growth Analysis | |
  4. 4 Driver Impact Analysis | |
    1. 4.1 Accelerating EV Adoption | |
    2. 4.2 Supply Chain Localization Incentives | |
    3. 4.3 Fast-Charging and High-Voltage Cell Designs | |
    4. 4.4 Tightening Thermal Safety Standards | |
    5. 4.5 Cost-Down Pressure Favoring LFP Cells | |
    6. 4.6 Solid-State Battery Commercialization Programs | |
  5. 5 Restraints Impact Analysis | |
    1. 5.1 Lithium Salt Price Volatility | |
    2. 5.2 Chinese Overcapacity and Margin Compression | |
    3. 5.3 High Cost of Advanced Chemistries | |
    4. 5.4 Flammability and Thermal Safety Concerns | |
    5. 5.5 Fluorochemical and PFAS Regulation | |
  6. 6 Opportunities | |
    1. 6.1 Sodium-Ion Electrolyte Supply | |
    2. 6.2 Localized Blending Near Western Gigafactories | |
    3. 6.3 Emerging-Market Cell Manufacturing | |
    4. 6.4 Data-Driven Formulation Services and Licensing | |
    5. 6.5 Electrolyte Recovery Within Recycling Loops | |
  7. 7 Regional Market Share and Country-Level Analysis | |
    1. 7.1 North America | | |
      1. 7.1.1 United States | | |
      2. 7.1.2 Canada | | |
      3. 7.1.3 Rest of North America | |
    2. 7.2 Europe | | |
      1. 7.2.1 Germany | | |
      2. 7.2.2 France | | |
      3. 7.2.3 United Kingdom | | |
      4. 7.2.4 Spain | | |
      5. 7.2.5 NORDIC | | |
      6. 7.2.6 Turkey | | |
      7. 7.2.7 Russia | | |
      8. 7.2.8 Rest of Europe | |
    3. 7.3 Asia-Pacific | | |
      1. 7.3.1 China | | |
      2. 7.3.2 India | | |
      3. 7.3.3 Japan | | |
      4. 7.3.4 South Korea | | |
      5. 7.3.5 Thailand | | |
      6. 7.3.6 Indonesia | | |
      7. 7.3.7 Vietnam | | |
      8. 7.3.8 Malaysia | | |
      9. 7.3.9 Rest of Asia-Pacific | |
    4. 7.4 South America | | |
      1. 7.4.1 Brazil | | |
      2. 7.4.2 Argentina | | |
      3. 7.4.3 Colombia | | |
      4. 7.4.4 Rest of South America | |
    5. 7.5 Middle East & Africa | | |
      1. 7.5.1 Saudi Arabia | | |
      2. 7.5.2 United Arab Emirates | | |
      3. 7.5.3 South Africa | | |
      4. 7.5.4 Egypt | | |
      5. 7.5.5 Nigeria | | |
      6. 7.5.6 Qatar | | |
      7. 7.5.7 Rest of Middle East & Africa | |
  8. 8 Future Outlook (2026–2035) | |
    1. 8.1 AI-Accelerated Formulation Discovery | |
    2. 8.2 The Liquid-to-Solid Transition | |
    3. 8.3 Electrification Supercycle | |
    4. 8.4 ESG, Carbon Footprint, and Circularity | |
  9. 9 Segmentation Analysis | |
    1. 9.1 By Battery Type | | |
      1. 9.1.1 Lithium-ion Batteries | | |
      2. 9.1.2 Lead-acid Batteries | | |
      3. 9.1.3 Other Battery Types | |
    2. 9.2 By Electrolyte Type | | |
      1. 9.2.1 Liquid Electrolytes | | |
      2. 9.2.2 Gel Electrolytes | | |
      3. 9.2.3 Solid Electrolytes | |
  10. 10 Competitive Landscape | |
    1. 10.1 Market Concentration Analysis | |
    2. 10.2 Competitive Benchmarking Matrix | |
    3. 10.3 Company Profiles | | |
      1. 10.3.1 Guangzhou Tinci Materials Technology | | |
      2. 10.3.2 Shenzhen Capchem Technology | | |
      3. 10.3.3 Jiangsu Guotai Super Power New Materials | | |
      4. 10.3.4 Zhuhai Smoothway Electronic Materials | | |
      5. 10.3.5 Mitsubishi Chemical Group (MU Ionic Solutions) | | |
      6. 10.3.6 Soulbrain | | |
      7. 10.3.7 Enchem | | |
      8. 10.3.8 Dongwha Electrolyte | | |
      9. 10.3.9 Central Glass | | |
      10. 10.3.10 Idemitsu Kosan | | |
      11. 10.3.11 Solid Power | |
  11. 11 Recent News & Developments | |
  12. 12 Report Scope and Methodology | |
  13. 13 Detailed Sources and Citations | |
  14. 14 Frequently Asked Questions (FAQs) | | LIST OF TABLES | |
  15. TABLE 1 Global Market Summary Snapshot, 2025–2035 | |
  16. TABLE 2 Global Market Size & Forecast, by Revenue (USD Billion), 2021–2035 | |
  17. TABLE 3 Driver Impact Analysis, 2026–2035 | |
  18. TABLE 4 Restraints Impact Analysis, 2026–2035 | |
  19. TABLE 5 Regional Summary, by Region, 2025 (USD Billion) | |
  20. TABLE 6 North America Market, by Country, 2021–2035 (USD Billion) | |
  21. TABLE 7 Europe Market, by Country, 2021–2035 (USD Billion) | |
  22. TABLE 8 Asia-Pacific Market, by Country, 2021–2035 (USD Billion) | |
  23. TABLE 9 South America Market, by Country, 2021–2035 (USD Billion) | |
  24. TABLE 10 Middle East & Africa Market, by Country, 2021–2035 (USD Billion) | |
  25. TABLE 11 Global Market, by Battery Type, 2021–2035 (USD Billion) | |
  26. TABLE 12 Global Market, by Electrolyte Type, 2021–2035 (USD Billion) | |
  27. TABLE 13 Competitive Benchmarking Matrix, 2025 | |
  28. TABLE 14 Recent Developments & Strategic Announcements, 2023–2025 | |
  29. TABLE 15 Report Scope and Methodology | |
  30. TABLE 16 Detailed Sources and Citations | | LIST OF FIGURES | |
  31. FIGURE 1 Market Dynamics Overview — Drivers, Restraints, Opportunities | |
  32. FIGURE 2 Electrolyte Value Chain Analysis (Salts, Solvents, Additives, Formulation, Cell Integration) | |
  33. FIGURE 3 Porter's Five Forces Analysis | |
  34. FIGURE 4 Global Market Size Trend, 2021–2035 (USD Billion) | |
  35. FIGURE 5 Year-over-Year Growth Rate, 2022–2035 | |
  36. FIGURE 6 Market Share, by Battery Type, 2025 | |
  37. FIGURE 7 Market Share, by Electrolyte Type, 2025 | |
  38. FIGURE 8 Regional Market Share, 2025 | |
  39. FIGURE 9 Regional Growth Comparison, 2026–2035 | |
  40. FIGURE 10 Competitive Landscape — Estimated Revenue Share Ranges, 2025 | |
  41. FIGURE 11 Competitive Positioning Matrix — Liquid vs. Solid Electrolyte Specialists

Segmentation Quick Reference

DimensionSub-SegmentsDominant SegmentFastest Growing Segment
By Battery TypeLithium-ion Batteries, Lead-acid Batteries, Other Battery TypesLithium-ion Batteries (88.7% share)Other Battery Types (16.8% CAGR)
By Electrolyte TypeLiquid Electrolytes, Gel Electrolytes, Solid ElectrolytesLiquid Electrolytes (84.2% share)Solid Electrolytes (27.9% CAGR)
By RegionNorth America, Europe, Asia-Pacific, South America, Middle East & AfricaAsia-Pacific (71.4% share)Europe (12.4% CAGR)


Market Segmentation Overview

By Battery Type

Sub-SegmentKey Trend
Lithium-ion BatteriesLFP share rising; additive-rich formulations for fast charging
Lead-acid BatteriesStable 12V auxiliary and low-speed vehicle demand
Other Battery TypesSodium-ion commercialization with NaPF6 electrolytes


Lithium-ion Batteries lead because both LFP and nickel-rich traction cells rely on LiPF6-based liquid formulations, and GB 38031-2025 increases additive content per cell. Other Battery Types grow fastest as sodium-ion cells enter entry-level vehicles, creating a new need for NaPF6 salts and hard-carbon-compatible additives. Lead-acid Batteries remain a low-growth auxiliary niche.

By Electrolyte Type

Sub-SegmentKey Trend
Liquid ElectrolytesLiFSI co-salts and flame-retardant additives
Gel ElectrolytesSemi-solid designs on existing filling lines
Solid ElectrolytesSulfide pilot lines scaling toward 2027–2028 launches


Liquid Electrolytes lead because every high-volume gigafactory is built around vacuum filling, and reformulation rather than replacement is the lowest-risk path to safety compliance. Solid Electrolytes grow fastest as the Toyota–Idemitsu and Solid Power programs move sulfide materials toward vehicle production. Gel Electrolytes sit between the two, offering semi-solid safety gains without new capital equipment.




Download PDF ×

We do not share your information with anyone. However, we may send you emails based on your report interest from time to time. You may contact us at any time to opt-out.