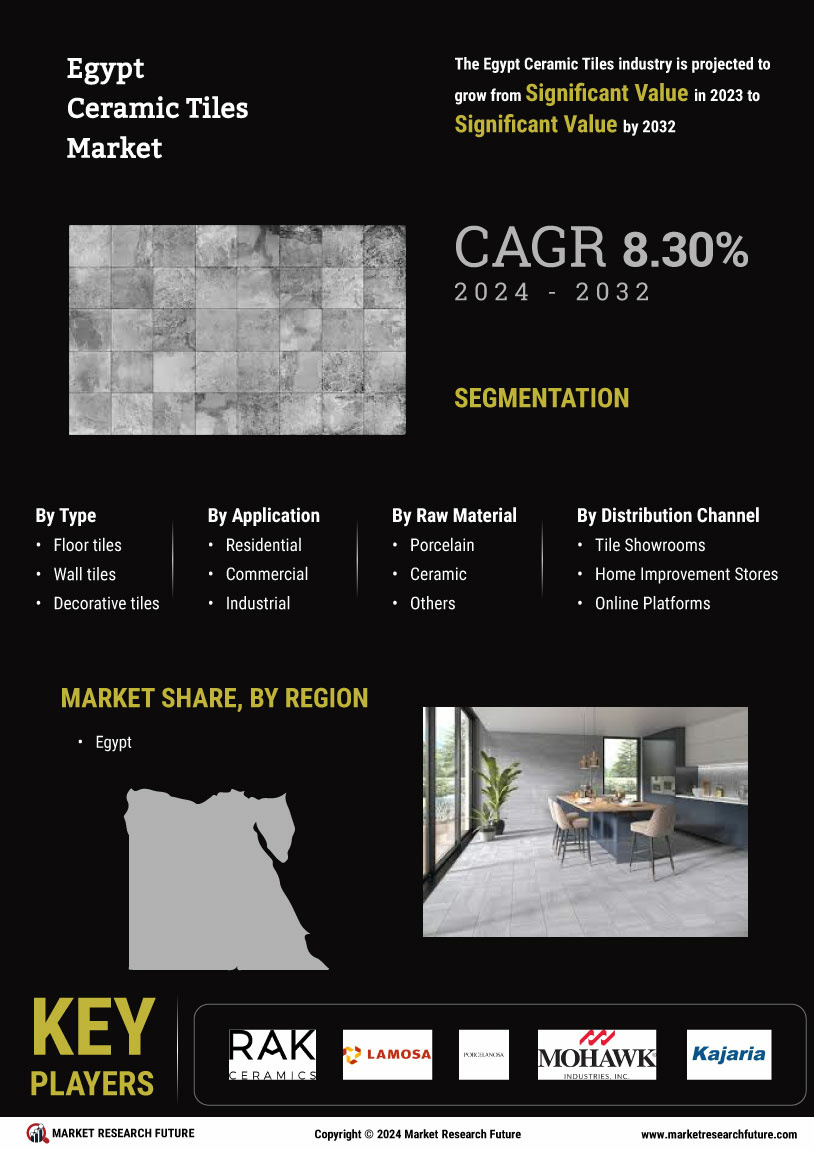
Request Free Sample ×

Kindly complete the form below to receive a free sample of this Report

* Please use a valid business email

Leading companies partner with us for data-driven Insights

clients tt-cursor
Hero Background

Egypt Ceramic Tiles Market

ID: MRFR/PCM/20170-HCR
128 Pages
Varsha More
Last Updated: April 06, 2026

Egypt Ceramic Tiles Market Research Report Information By Type (Floor Tiles, Wall Tiles, And Decorative Tiles), By Application (Residential, Commercial, Industrial, and Others), By Raw Material (Porcelain, Ceramic, and Other Materials), By Distribution Channel (Tile Showrooms, Home Improvement Stores, and Online Platforms) – Egypt Market Forecast Till 2035

Share:
Download PDF ×

We do not share your information with anyone. However, we may send you emails based on your report interest from time to time. You may contact us at any time to opt-out.

  1. 1 SECTION I: EXECUTIVE SUMMARY AND KEY HIGHLIGHTS
    1. 1.1 EXECUTIVE SUMMARY
      1. 1.1.1 Market Overview
      2. 1.1.2 Key Findings
      3. 1.1.3 Market Segmentation
      4. 1.1.4 Competitive Landscape
      5. 1.1.5 Challenges and Opportunities
      6. 1.1.6 Future Outlook
  2. 2 SECTION II: SCOPING, METHODOLOGY AND MARKET STRUCTURE
    1. 2.1 MARKET INTRODUCTION
      1. 2.1.1 Definition
      2. 2.1.2 Scope of the study
        1. 2.1.2.1 Research Objective
        2. 2.1.2.2 Assumption
        3. 2.1.2.3 Limitations
    2. 2.2 RESEARCH METHODOLOGY
      1. 2.2.1 Overview
      2. 2.2.2 Data Mining
      3. 2.2.3 Secondary Research
      4. 2.2.4 Primary Research
        1. 2.2.4.1 Primary Interviews and Information Gathering Process
        2. 2.2.4.2 Breakdown of Primary Respondents
      5. 2.2.5 Forecasting Model
      6. 2.2.6 Market Size Estimation
        1. 2.2.6.1 Bottom-Up Approach
        2. 2.2.6.2 Top-Down Approach
      7. 2.2.7 Data Triangulation
      8. 2.2.8 Validation
  3. 3 SECTION III: QUALITATIVE ANALYSIS
    1. 3.1 MARKET DYNAMICS
      1. 3.1.1 Overview
      2. 3.1.2 Drivers
      3. 3.1.3 Restraints
      4. 3.1.4 Opportunities
    2. 3.2 MARKET FACTOR ANALYSIS
      1. 3.2.1 Value chain Analysis
      2. 3.2.2 Porter's Five Forces Analysis
        1. 3.2.2.1 Bargaining Power of Suppliers
        2. 3.2.2.2 Bargaining Power of Buyers
        3. 3.2.2.3 Threat of New Entrants
        4. 3.2.2.4 Threat of Substitutes
        5. 3.2.2.5 Intensity of Rivalry
      3. 3.2.3 COVID-19 Impact Analysis
        1. 3.2.3.1 Market Impact Analysis
        2. 3.2.3.2 Regional Impact
        3. 3.2.3.3 Opportunity and Threat Analysis
  4. 4 SECTION IV: QUANTITATIVE ANALYSIS
    1. 4.1 Packaging & Transport, BY Application (USD Billion)
      1. 4.1.1 Residential
      2. 4.1.2 Commercial
      3. 4.1.3 Industrial
      4. 4.1.4 Institutional
    2. 4.2 Packaging & Transport, BY Material Type (USD Billion)
      1. 4.2.1 Ceramic
      2. 4.2.2 Porcelain
      3. 4.2.3 Stoneware
      4. 4.2.4 Glazed
      5. 4.2.5 Unglazed
    3. 4.3 Packaging & Transport, BY Surface Finish (USD Billion)
      1. 4.3.1 Polished
      2. 4.3.2 Matte
      3. 4.3.3 Textured
      4. 4.3.4 Glossy
    4. 4.4 Packaging & Transport, BY Size (USD Billion)
      1. 4.4.1 Small Format
      2. 4.4.2 Medium Format
      3. 4.4.3 Large Format
      4. 4.4.4 Custom Size
  5. 5 SECTION V: COMPETITIVE ANALYSIS
    1. 5.1 Competitive Landscape
      1. 5.1.1 Overview
      2. 5.1.2 Competitive Analysis
      3. 5.1.3 Market share Analysis
      4. 5.1.4 Major Growth Strategy in the Packaging & Transport
      5. 5.1.5 Competitive Benchmarking
      6. 5.1.6 Leading Players in Terms of Number of Developments in the Packaging & Transport
      7. 5.1.7 Key developments and growth strategies
        1. 5.1.7.1 New Product Launch/Service Deployment
        2. 5.1.7.2 Merger & Acquisitions
        3. 5.1.7.3 Joint Ventures
      8. 5.1.8 Major Players Financial Matrix
        1. 5.1.8.1 Sales and Operating Income
        2. 5.1.8.2 Major Players R&D Expenditure. 2023
    2. 5.2 Company Profiles
      1. 5.2.1 Saudi Ceramics (SA)
        1. 5.2.1.1 Financial Overview
        2. 5.2.1.2 Products Offered
        3. 5.2.1.3 Key Developments
        4. 5.2.1.4 SWOT Analysis
        5. 5.2.1.5 Key Strategies
      2. 5.2.2 RAK Ceramics (AE)
        1. 5.2.2.1 Financial Overview
        2. 5.2.2.2 Products Offered
        3. 5.2.2.3 Key Developments
        4. 5.2.2.4 SWOT Analysis
        5. 5.2.2.5 Key Strategies
      3. 5.2.3 Arabian Tile Company (SA)
        1. 5.2.3.1 Financial Overview
        2. 5.2.3.2 Products Offered
        3. 5.2.3.3 Key Developments
        4. 5.2.3.4 SWOT Analysis
        5. 5.2.3.5 Key Strategies
      4. 5.2.4 Ceramica Cleopatra (EG)
        1. 5.2.4.1 Financial Overview
        2. 5.2.4.2 Products Offered
        3. 5.2.4.3 Key Developments
        4. 5.2.4.4 SWOT Analysis
        5. 5.2.4.5 Key Strategies
      5. 5.2.5 Lamosa (MX)
        1. 5.2.5.1 Financial Overview
        2. 5.2.5.2 Products Offered
        3. 5.2.5.3 Key Developments
        4. 5.2.5.4 SWOT Analysis
        5. 5.2.5.5 Key Strategies
      6. 5.2.6 Mohawk Industries (US)
        1. 5.2.6.1 Financial Overview
        2. 5.2.6.2 Products Offered
        3. 5.2.6.3 Key Developments
        4. 5.2.6.4 SWOT Analysis
        5. 5.2.6.5 Key Strategies
      7. 5.2.7 Porcelanosa (ES)
        1. 5.2.7.1 Financial Overview
        2. 5.2.7.2 Products Offered
        3. 5.2.7.3 Key Developments
        4. 5.2.7.4 SWOT Analysis
        5. 5.2.7.5 Key Strategies
      8. 5.2.8 Marazzi (IT)
        1. 5.2.8.1 Financial Overview
        2. 5.2.8.2 Products Offered
        3. 5.2.8.3 Key Developments
        4. 5.2.8.4 SWOT Analysis
        5. 5.2.8.5 Key Strategies
      9. 5.2.9 Grespania (ES)
        1. 5.2.9.1 Financial Overview
        2. 5.2.9.2 Products Offered
        3. 5.2.9.3 Key Developments
        4. 5.2.9.4 SWOT Analysis
        5. 5.2.9.5 Key Strategies
    3. 5.3 Appendix
      1. 5.3.1 References
      2. 5.3.2 Related Reports
  6. 6 LIST OF FIGURES
    1. 6.1 MARKET SYNOPSIS
    2. 6.2 MEA MARKET ANALYSIS BY APPLICATION
    3. 6.3 MEA MARKET ANALYSIS BY MATERIAL TYPE
    4. 6.4 MEA MARKET ANALYSIS BY SURFACE FINISH
    5. 6.5 MEA MARKET ANALYSIS BY SIZE
    6. 6.6 KEY BUYING CRITERIA OF PACKAGING & TRANSPORT
    7. 6.7 RESEARCH PROCESS OF MRFR
    8. 6.8 DRO ANALYSIS OF PACKAGING & TRANSPORT
    9. 6.9 DRIVERS IMPACT ANALYSIS: PACKAGING & TRANSPORT
    10. 6.10 RESTRAINTS IMPACT ANALYSIS: PACKAGING & TRANSPORT
    11. 6.11 SUPPLY / VALUE CHAIN: PACKAGING & TRANSPORT
    12. 6.12 PACKAGING & TRANSPORT, BY APPLICATION, 2024 (% SHARE)
    13. 6.13 PACKAGING & TRANSPORT, BY APPLICATION, 2024 TO 2035 (USD Billion)
    14. 6.14 PACKAGING & TRANSPORT, BY MATERIAL TYPE, 2024 (% SHARE)
    15. 6.15 PACKAGING & TRANSPORT, BY MATERIAL TYPE, 2024 TO 2035 (USD Billion)
    16. 6.16 PACKAGING & TRANSPORT, BY SURFACE FINISH, 2024 (% SHARE)
    17. 6.17 PACKAGING & TRANSPORT, BY SURFACE FINISH, 2024 TO 2035 (USD Billion)
    18. 6.18 PACKAGING & TRANSPORT, BY SIZE, 2024 (% SHARE)
    19. 6.19 PACKAGING & TRANSPORT, BY SIZE, 2024 TO 2035 (USD Billion)
    20. 6.20 BENCHMARKING OF MAJOR COMPETITORS
  7. 7 LIST OF TABLES
    1. 7.1 LIST OF ASSUMPTIONS
  8. 7.1.1
    1. 7.2 MEA MARKET SIZE ESTIMATES; FORECAST
      1. 7.2.1 BY APPLICATION, 2026-2035 (USD Billion)
      2. 7.2.2 BY MATERIAL TYPE, 2026-2035 (USD Billion)
      3. 7.2.3 BY SURFACE FINISH, 2026-2035 (USD Billion)
      4. 7.2.4 BY SIZE, 2026-2035 (USD Billion)
    2. 7.3 PRODUCT LAUNCH/PRODUCT DEVELOPMENT/APPROVAL
  9. 7.3.1
    1. 7.4 ACQUISITION/PARTNERSHIP
  10. 7.4.1

MEA Packaging & Transport Market Segmentation

Packaging & Transport By Application (USD Billion, 2026-2035)

  • Residential
  • Commercial
  • Industrial
  • Institutional

Packaging & Transport By Material Type (USD Billion, 2026-2035)

  • Ceramic
  • Porcelain
  • Stoneware
  • Glazed
  • Unglazed

Packaging & Transport By Surface Finish (USD Billion, 2026-2035)

  • Polished
  • Matte
  • Textured
  • Glossy

Packaging & Transport By Size (USD Billion, 2026-2035)

  • Small Format
  • Medium Format
  • Large Format
  • Custom Size

Compare Licence

×
Features License Type
Single User Multiuser License Enterprise User
Price $4,950 $5,950 $7,250
Maximum User Access Limit 1 User Upto 10 Users Unrestricted Access Throughout the Organization
Free Customization
Direct Access to Analyst
Deliverable Format
Platform Access
Discount on Next Purchase 10% 15% 15%
Printable Versions