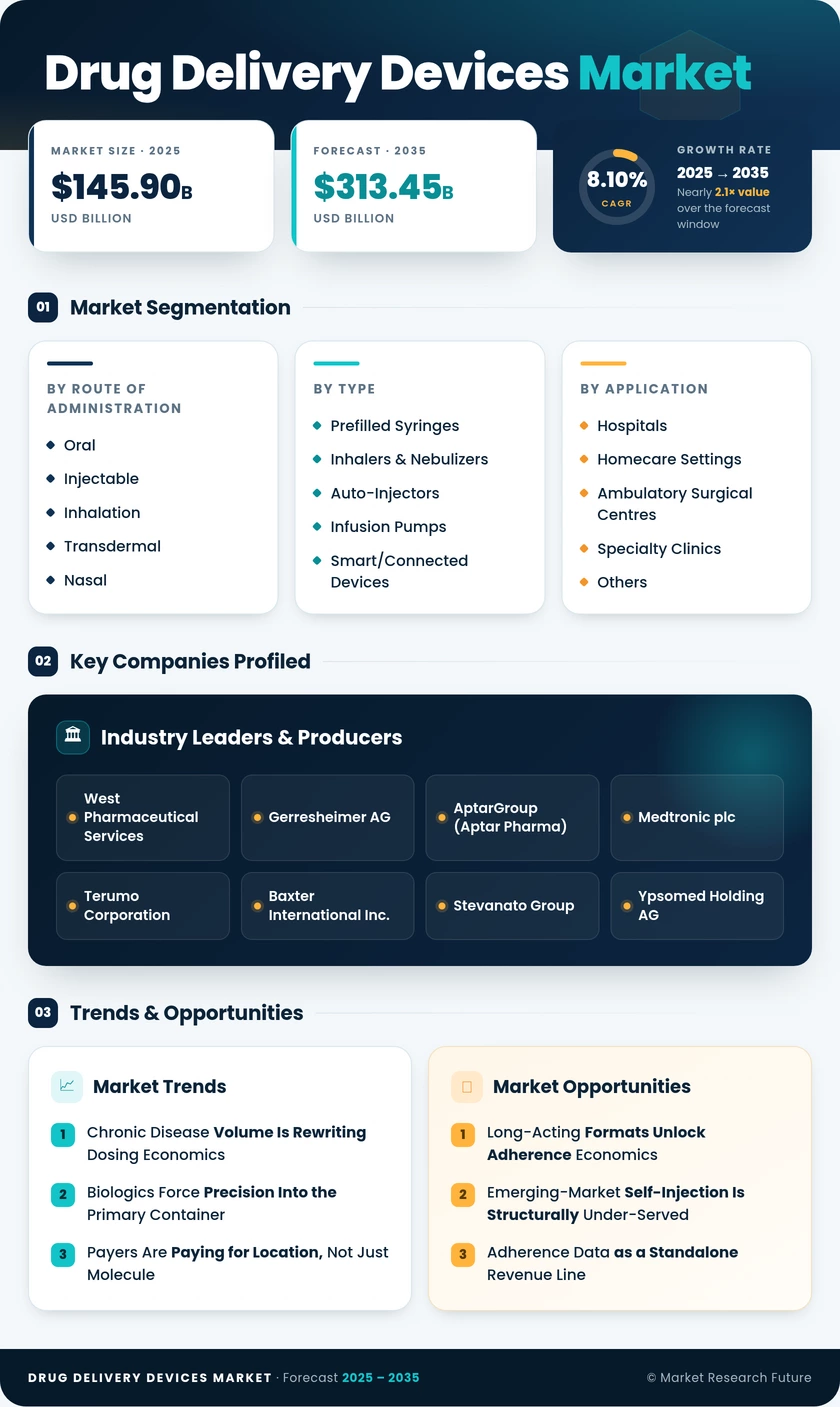
Drug Delivery Devices Market (2026 - 2035)

ID: MRFR/HC/10320-HCR 128 Pages Vikita Thakur Last Updated: October 27, 2026
Drug Delivery Devices Market Research Report: Size, Share, Trend Analysis By Drug Delivery Route (Oral, Injectable, Transdermal, Inhalation, Implantable), By Device Type (Syringes, Pumps, Inhalers, Patch Delivery Systems, Nebulizers), By Applications (Diabetes, Cancer, Cardiovascular, Autoimmune Disorders, Pain Management), By End Users (Hospitals, Homecare, Pharmaceutical Companies, Research Institutions) and By Regional (North America, Europe, South America, Asia Pacific, Middle East and Africa) - Growth Outlook & Industry Forecast 2026 To 2035
Drug Delivery Devices Market
Market Size
Forecast Period2026-2035
CAGR (2026-2035)8.10%
2025 Market SizeUSD 145.90 Billion
2035 Market SizeUSD 313.45 Billion
Key Players
West Pharmaceutical Services
Gerresheimer AG
AptarGroup
Medtronic plc
Terumo Corporation
Baxter International Inc.
Opportunities
  • Long-Acting Formats Unlock Adherence Economics
  • Emerging-Market Self-Injection Is Structurally Under-Served
  • Adherence Data as a Standalone Revenue Line
  1. 1 Market Summary |
    1. 1.1 Study Assumptions & Market Definition |
    2. 1.2 Scope of the Study |
    3. 1.3 Research Methodology
  2. 2 Key Report Takeaways |
    1. 2.1 By Technology |
    2. 2.2 By Sector |
    3. 2.3 By Geography
  3. 3 Market Size & Forecast (2021–2035) |
    1. 3.1 Historical Market Size (2021–2024) |
    2. 3.2 Base Year Assessment (2025) |
    3. 3.3 Forecast Market Size (2026–2035) |
    4. 3.4 Year-over-Year Growth Analysis
  4. 4 Driver Impact Analysis |
    1. 4.1 Chronic Disease Volume and Dosing Economics |
    2. 4.2 Biologics and Primary Container Precision |
    3. 4.3 Payer-Driven Site-of-Care Migration |
    4. 4.4 Asia-Pacific Manufacturing and Demand Convergence
  5. 5 Restraints Impact Analysis |
    1. 5.1 Primary Container Supply Constraints |
    2. 5.2 Combination-Product Regulatory Ambiguity |
    3. 5.3 Connected Device Recall Exposure
  6. 6 Opportunities |
    1. 6.1 Long-Acting Formats and Adherence Economics |
    2. 6.2 Emerging-Market Self-Injection Access |
    3. 6.3 Adherence Data Monetisation |
    4. 6.4 Sustainability-Led Device Redesign |
    5. 6.5 Contract Development Capacity Constraints
  7. 7 Regional Market Share & Country-Level Analysis |
    1. 7.1 North America | |
      1. 7.1.1 US | |
      2. 7.1.2 Canada | |
      3. 7.1.3 Mexico |
    2. 7.2 Europe | |
      1. 7.2.1 Germany | |
      2. 7.2.2 UK | |
      3. 7.2.3 France | |
      4. 7.2.4 Italy | |
      5. 7.2.5 Spain | |
      6. 7.2.6 Nordic Countries | |
      7. 7.2.7 Russia | |
      8. 7.2.8 Rest of Europe |
    3. 7.3 Asia-Pacific | |
      1. 7.3.1 China | |
      2. 7.3.2 India | |
      3. 7.3.3 Japan | |
      4. 7.3.4 South Korea | |
      5. 7.3.5 ASEAN | |
      6. 7.3.6 Rest of Asia-Pacific |
    4. 7.4 South America | |
      1. 7.4.1 Brazil | |
      2. 7.4.2 Argentina | |
      3. 7.4.3 Rest of South America |
    5. 7.5 Middle East & Africa | |
      1. 7.5.1 Saudi Arabia | |
      2. 7.5.2 UAE | |
      3. 7.5.3 South Africa | |
      4. 7.5.4 Egypt | |
      5. 7.5.5 Rest of Middle East & Africa
  8. 8 Future Outlook (2026–2035) |
    1. 8.1 Algorithmic Dosing and Closed-Loop Systems |
    2. 8.2 Platform Economics and Supplier Relationships |
    3. 8.3 Supply Chain Redundancy as Purchase Criterion |
    4. 8.4 Sustainability Reporting and Bill of Materials
  9. 9 Market Segmentation Analysis |
    1. 9.1 By Route of Administration | |
      1. 9.1.1 Oral | |
      2. 9.1.2 Injectable | |
      3. 9.1.3 Inhalation | |
      4. 9.1.4 Transdermal | |
      5. 9.1.5 Nasal | |
      6. 9.1.6 Ocular |
    2. 9.2 By Device Type | |
      1. 9.2.1 Prefilled Syringes | |
      2. 9.2.2 Auto-Injectors | |
      3. 9.2.3 Inhalers & Nebulizers | |
      4. 9.2.4 Infusion Pumps | |
      5. 9.2.5 Smart/Connected Devices | |
      6. 9.2.6 Implantable Systems | |
      7. 9.2.7 Others |
    3. 9.3 By End User | |
      1. 9.3.1 Hospitals | |
      2. 9.3.2 Home Healthcare Settings | |
      3. 9.3.3 Ambulatory Surgical Centres | |
      4. 9.3.4 Specialty Clinics | |
      5. 9.3.5 Others |
    4. 9.4 By Therapeutic Area | |
      1. 9.4.1 Oncology | |
      2. 9.4.2 Diabetes | |
      3. 9.4.3 Cardiovascular | |
      4. 9.4.4 Respiratory / Pulmonology | |
      5. 9.4.5 Autoimmune & Inflammatory | |
      6. 9.4.6 Others
  10. 10 Competitive Landscape |
    1. 10.1 Market Concentration Analysis (2026) |
    2. 10.2 Competitive Benchmarking Matrix |
    3. 10.3 Company Profiles | |
      1. 10.3.1 Becton, Dickinson and Company | |
      2. 10.3.2 West Pharmaceutical Services | |
      3. 10.3.3 Gerresheimer AG | |
      4. 10.3.4 AptarGroup (Aptar Pharma) | |
      5. 10.3.5 Medtronic plc | |
      6. 10.3.6 Terumo Corporation | |
      7. 10.3.7 Baxter International Inc. | |
      8. 10.3.8 Stevanato Group | |
      9. 10.3.9 Ypsomed Holding AG | |
      10. 10.3.10 SHL Medical AG | |
      11. 10.3.11 Schott Pharma AG
  11. 11 Recent News & Developments
  12. 12 Report Scope & Methodology |
    1. 12.1 Study Period & Base Year |
    2. 12.2 Data Sources & Citations |
    3. 12.3 Abbreviations
  13. 13 Detailed Sources & Citations
  14. 14 Frequently Asked Questions
  15. 15 LIST OF TABLES |
  16. TABLE 1 Global Drug Delivery Devices Market Size & Forecast, by Revenue (USD Billion), 2021–2035 |
  17. TABLE 2 Global Drug Delivery Devices Market – Year-over-Year Growth Analysis, 2021–2035 |
  18. TABLE 3 Driver Impact Analysis Matrix, 2026–2035 |
  19. TABLE 4 Restraint Impact Analysis Matrix, 2026–2035 |
  20. TABLE 5 Global Market Size, by Region, 2021–2035 (USD Billion) |
  21. TABLE 6 North America Market Size, by Country, 2021–2035 (USD Billion) |
  22. TABLE 7 Europe Market Size, by Country, 2021–2035 (USD Billion) |
  23. TABLE 8 Asia-Pacific Market Size, by Country, 2021–2035 (USD Billion) |
  24. TABLE 9 South America Market Size, by Country, 2021–2035 (USD Billion) |
  25. TABLE 10 Middle East & Africa Market Size, by Country, 2021–2035 (USD Billion) |
  26. TABLE 11 Global Market Size, by Route of Administration, 2021–2035 (USD Billion) |
  27. TABLE 12 Global Market Size, by Device Type, 2021–2035 (USD Billion) |
  28. TABLE 13 Global Market Size, by End User, 2021–2035 (USD Billion) |
  29. TABLE 14 Global Market Size, by Therapeutic Area, 2021–2035 (USD Billion) |
  30. TABLE 15 North America Market Size, by Route of Administration, 2021–2035 (USD Billion) |
  31. TABLE 16 North America Market Size, by Device Type, 2021–2035 (USD Billion) |
  32. TABLE 17 Europe Market Size, by Route of Administration, 2021–2035 (USD Billion) |
  33. TABLE 18 Europe Market Size, by Device Type, 2021–2035 (USD Billion) |
  34. TABLE 19 Asia-Pacific Market Size, by Route of Administration, 2021–2035 (USD Billion) |
  35. TABLE 20 Asia-Pacific Market Size, by Device Type, 2021–2035 (USD Billion) |
  36. TABLE 21 South America Market Size, by End User, 2021–2035 (USD Billion) |
  37. TABLE 22 Middle East & Africa Market Size, by End User, 2021–2035 (USD Billion) |
  38. TABLE 23 US Market Size, by Device Type, 2021–2035 (USD Billion) |
  39. TABLE 24 China Market Size, by Device Type, 2021–2035 (USD Billion) |
  40. TABLE 25 India Market Size, by Therapeutic Area, 2021–2035 (USD Billion) |
  41. TABLE 26 Competitive Benchmarking Matrix, 2026 |
  42. TABLE 27 Company Profiles – Key Players |
  43. TABLE 28 Recent Developments & Strategic Announcements, 2023–2025 |
  44. TABLE 29 Report Scope & Methodology Summary |
  45. TABLE 30 Detailed Sources & Citations Index
  46. 16 LIST OF FIGURES |
  47. FIGURE 1 Market Dynamics – Drivers, Restraints, Opportunities and Challenges |
  48. FIGURE 2 Industry Value Chain Analysis |
  49. FIGURE 3 Porter's Five Forces Analysis |
  50. FIGURE 4 Global Market Size Trend & Forecast, 2021–2035 (USD Billion) |
  51. FIGURE 5 Year-over-Year Growth Trajectory, 2022–2035 (%) |
  52. FIGURE 6 Market Share by Route of Administration, 2025 vs 2035 (%) |
  53. FIGURE 7 Market Share by Device Type, 2025 vs 2035 (%) |
  54. FIGURE 8 Market Share by End User, 2025 (%) |
  55. FIGURE 9 Market Share by Therapeutic Area, 2025 (%) |
  56. FIGURE 10 Regional Revenue Share, 2025 (%) |
  57. FIGURE 11 Regional CAGR Comparison, 2026–2035 (%) |
  58. FIGURE 12 North America Country-Level Share, 2025 (%) |
  59. FIGURE 13 Europe Country-Level Share, 2025 (%) |
  60. FIGURE 14 Asia-Pacific Country-Level Share, 2025 (%) |
  61. FIGURE 15 Competitive Landscape – Estimated Revenue Share Bands, 2026 |
  62. FIGURE 16 Strategic Positioning Map – Platform Breadth vs Regulatory Depth |
  63. FIGURE 17 Future Outlook Scenario Bands, 2026–2035

Segmentation Quick Reference

DimensionSub-SegmentsDominant SegmentFastest Growing Segment
By Route of AdministrationOral, Injectable, Inhalation, Transdermal, Nasal, OcularOralInjectable
By Device TypePrefilled Syringes, Auto-Injectors, Inhalers & Nebulizers, Infusion Pumps, Smart/Connected Devices, Implantable Systems, OthersPrefilled SyringesSmart/Connected Devices
By End UserHospitals, Homecare Settings, Ambulatory Surgical Centres, Specialty Clinics, OthersHospitalsHomecare Settings
By Therapeutic AreaOncology, Diabetes, Cardiovascular, Respiratory / Pulmonology, Autoimmune & Inflammatory, OthersOncologyDiabetes
By GeographyNorth America, Europe, Asia-Pacific, South America, Middle East & AfricaNorth AmericaAsia-Pacific


Market Segmentation Overview

By Route of Administration

Sub-SegmentKey Trend
OralModified-release and gastro-retentive formats extend device content into solid dosage.
InjectableHigh-concentration biologics push volume limits and drive on-body formats.
InhalationPropellant transition to low-GWP alternatives forces portfolio requalification
TransdermalMicroneedle arrays move from pain management into vaccine and peptide delivery.
NasalRescue therapies and CNS-targeted delivery expand device-grade nasal spray demand.
OcularSustained-release implants displace repeated intravitreal injection schedules.


Route economics diverge sharply. Oral retains the broadest patient base while injectable captures the fastest revenue expansion, and ocular commands the highest per-device value despite modest volumes.

By Device Type

Sub-SegmentKey Trend
Prefilled SyringesPolymer barrels gain qualification traction against constrained borosilicate supply.
Auto-InjectorsPlatform licensing replaces bespoke design across multi-asset biologic portfolios.
Inhalers & NebulizersDose counters and adherence sensors become standard on premium respiratory devices.
Infusion PumpsInteroperability and cybersecurity hardening dominate hospital procurement criteria.
Smart/Connected DevicesSubscription data services decouple revenue from hardware replacement cycles.
Implantable SystemsLong-acting depots convert chronic dosing into scheduled clinical events.
OthersSpecialty and niche applications sustain fragmented supplier participation.


Device selection is increasingly made at portfolio level rather than per molecule, concentrating volume among platform owners while leaving component suppliers exposed to consolidation pressure.

By End User

Sub-SegmentKey Trend
HospitalsComplex first-dose administration and oncology regimens anchor institutional demand.
Homecare SettingsReimbursement follows the patient, lifting untrained-user design requirements.
Ambulatory Surgical CentresDay-case migration expands demand for pre-metered single-use formats.
Specialty ClinicsImmunology and ophthalmology throughput supports premium device adoption.
OthersLong-term care and retail channels widen distribution reach.


Institutional buyers still set technical specifications, but homecare volume growth is what redirects design budgets toward simplicity, error tolerance and instructional clarity.

By Therapeutic Area

Sub-SegmentKey Trend
OncologySubcutaneous conversion of intravenous biologics reshapes administration settings.
DiabetesEmerging-market pen penetration drives the steepest unit-volume expansion.
CardiovascularAnticoagulant and lipid-lowering self-injection normalises patient administration.
Respiratory / PulmonologyBiologic aerosols and propellant reformulation reset device requirements
Autoimmune & InflammatoryBiosimilar competition makes device experience a primary differentiator.
OthersCNS, rare disease and ophthalmology sustain high-value niche demand


Therapeutic mix determines pricing headroom. Oncology and immunology absorb device costs that primary care cannot, which is why premium platforms launch there first and migrate downward later.




Download PDF ×

We do not share your information with anyone. However, we may send you emails based on your report interest from time to time. You may contact us at any time to opt-out.