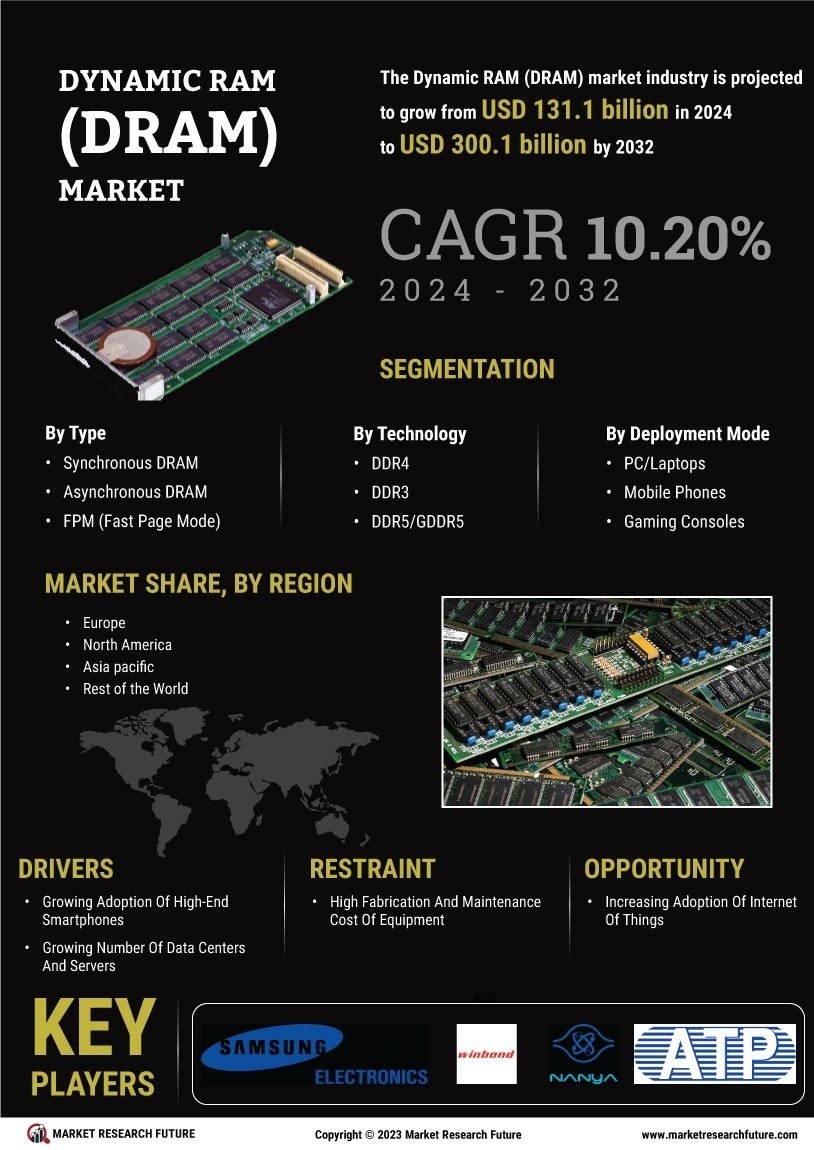
ID: MRFR/SEM/0472-CR | 115 Pages | Author: Aarti Dhapte | February 2020
1 Executive Summary
2 Market Introduction
2.1 Definition 16
2.2 Scope Of The Study 16
2.3 List Of Assumptions 17
2.4 Market Structure 17
3 Research Methodology
3.1 Research Process 19
3.2 Secondary Research 19
3.3 Primary Research 20
3.4 Forecast Model 22
4 Market Dynamics
4.1 Introduction 24
4.2 Drivers 24
4.2.1 Growing Adoption Of High-End Smartphones 24
4.2.2 Growing Number Of Data Centers And Servers 24
4.2.3 Growing Demand From The Automotive Sector 25
4.2.4 Driver Impact Analysis 25
4.3 Restraints 26
4.3.1 High Fabrication And Maintenance Cost Of Equipment 26
4.4 Opportunities 26
4.4.1 Increasing Adoption Of Internet Of Things 26
4.5 Value Chain Analysis 27
4.5.1 Material Suppliers And Foundries 27
4.5.2 Component Manufacturers 27
4.5.3 Sub-System Integrators/Assemblers 27
4.5.4 End-Use Applications 27
4.6 Porter’s Five Forces Model 28
4.6.1 Threat Of New Entrant 28
4.6.2 Bargaining Power Of Supplier 29
4.6.3 Bargaining Power Of Buyers 29
4.6.4 Threat Of Substitute 29
4.6.5 Intensity Of Rivalry 29
5 Global DRAM Market, By Type
5.1 Overview 31
5.1.1 Synchronous DRAM 32
5.1.2 BEDO (Burst Extended Data Output) 32
5.1.3 EDO (Extended Data Output) 32
5.1.4 Asynchronous DRAM 32
5.1.5 FPM (Fast Page Mode) 32
6 Global DRAM Market, By Technology
6.1 Overview 34
6.1.1 DDR4 35
6.1.2 DDR3 35
6.1.3 DDR5/GDDR5 35
6.1.4 DDR2 35
7 Global DRAM Market, By Application
7.1 Overview 37
7.1.1 PC/Laptops 38
7.1.2 Mobile Phones 38
7.1.3 Gaming Consoles 38
7.1.4 Networking Devices 38
8 DRAM Market, By Region
8.1 Introduction 40
8.2 North America 42
8.2.1 US 46
8.2.2 Canada 48
8.2.3 Mexico 50
8.3 Europe 52
8.3.1 UK 56
8.3.2 Germany 58
8.3.3 France 60
8.3.4 Rest Of Europe 62
8.4 Asia-Pacific 64
8.4.1 China 68
8.4.2 Japan 70
8.4.3 India 72
8.4.4 South Korea 74
8.4.5 Rest Of Asia-Pacific 76
8.5 Rest Of The World 78
8.5.1 Middle East & Africa 82
8.5.2 Latin America 84
9 Competitive Landscape
9.1 Competitive Landscape Overview 87
10 Company Profiles
10.1 Samsung Electronics Co., Ltd 91
10.1.1 Company Overview 91
10.1.2 Financial Overview 91
10.1.3 Product/Solution/Service Offered 92
10.1.4 Key Developments 92
10.1.5 SWOT Analysis 92
10.1.6 Key Strategy 92
10.2 Winbond Electronics Corporation 93
10.2.1 Company Overview 93
10.2.2 Financial Overview 93
10.2.3 Product/Solution/Service Offered 94
10.2.4 Key Developments 94
10.2.5 SWOT Analysis 94
10.2.6 Key Strategy 94
10.3 Transcend Information, Inc. 95
10.3.1 Company Overview 95
10.3.2 Financial Overview 95
10.3.3 Product/Solution/Service Offered 96
10.3.4 SWOT Analysis 97
10.3.5 Key Strategy 97
10.4 Powerchip Technology Corporation 98
10.4.1 Company Overview 98
10.4.2 Financial Overview 98
10.4.3 Product/Solution/Service Offered 99
10.4.4 Key Developments 99
10.4.5 SWOT Analysis 99
10.4.6 Key Strategy 99
10.5 Nanya Technology Corporation 100
10.5.1 Company Overview 100
10.5.2 Financial Overview 100
10.5.3 Product/Solution/Service Offered 101
10.5.4 Key Developments 102
10.5.5 SWOT Analysis 102
10.5.6 Key Strategy 102
10.6 Kingston Technology Corporation 103
10.6.1 Company Overview 103
10.6.2 Product/Solution/Service Offered 103
10.6.3 Key Developments 103
10.6.4 SWOT Analysis 103
10.6.5 Key Strategy 104
10.7 Micron Technology, Inc. 105
10.7.1 Company Overview 105
10.7.2 Financial Overview 105
10.7.3 Product/Solution/Service Offered 106
10.7.4 Key Developments 106
10.7.5 SWOT Analysis 106
10.7.6 Key Strategy 107
10.8 SK Hynix Inc. 108
10.8.1 Company Overview 108
10.8.2 Financial Overview 108
10.8.3 Product/Solution/Service Offered 109
10.8.4 Key Developments 109
10.8.5 SWOT Analysis 109
10.8.6 Key Strategy 110
10.9 ATP Electronics, Inc. 111
10.9.1 Company Overview 111
10.9.2 Product/Solution/Service Offered 111
10.9.3 Key Developments 111
10.9.4 SWOT Analysis 112
10.9.5 Key Strategy 112
10.10 Integrated Silicon Solution Inc. 113
10.10.1 Company Overview 113
10.10.2 Products/Services/Solutions Offered 113
10.10.3 SWOT Analysis 114
11 List Of Tables
TABLE 1 MARKET SYNOPSIS 14
TABLE 2 LIST OF ASSUMPTIONS 17
TABLE 3 GLOBAL DRAM MARKET, BY TYPE, 2022-2030(USD BILLION) 31
TABLE 4 GLOBAL DRAM MARKET, BY TECHNOLOGY, 2022-2030(USD BILLION) 34
TABLE 5 GLOBAL DRAM MARKET, BY APPLICATION, 2022-2030(USD BILLION) 37
TABLE 6 GLOBAL DRAM MARKET, BY REGION, 2022-2030(USD BILLION) 41
TABLE 7 NORTH AMERICA: DRAM MARKET, BY COUNTRY, 2022-2030(USD BILLION) 43
TABLE 8 NORTH AMERICA: DRAM MARKET, BY TYPE, 2022-2030(USD BILLION) 43
TABLE 9 NORTH AMERICA: DRAM MARKET, BY TECHNOLOGY, 2022-2030(USD BILLION) 44
TABLE 10 NORTH AMERICA: DRAM MARKET, BY APPLICATION, 2022-2030(USD BILLION) 45
TABLE 11 US: DRAM MARKET, BY TYPE, 2022-2030(USD BILLION) 46
TABLE 12 US: DRAM MARKET, BY TECHNOLOGY, 2022-2030(USD BILLION) 46
TABLE 13 US: DRAM MARKET, BY APPLICATION, 2022-2030(USD BILLION) 47
TABLE 14 CANADA: DRAM MARKET, BY TYPE, 2022-2030(USD BILLION) 48
TABLE 15 CANADA: DRAM MARKET, BY TECHNOLOGY, 2022-2030(USD BILLION) 48
TABLE 16 CANADA: DRAM MARKET, BY APPLICATION, 2022-2030(USD BILLION) 49
TABLE 17 MEXICO: DRAM MARKET, BY TYPE, 2022-2030(USD BILLION) 50
TABLE 18 MEXICO: DRAM MARKET, BY TECHNOLOGY, 2022-2030(USD BILLION) 50
TABLE 19 MEXICO: DRAM MARKET, BY APPLICATION, 2022-2030(USD BILLION) 51
TABLE 20 EUROPE: DRAM MARKET, BY COUNTRY, 2022-2030(USD BILLION) 53
TABLE 21 EUROPE: DRAM MARKET, BY TYPE, 2022-2030(USD BILLION) 54
TABLE 22 EUROPE: DRAM MARKET, BY TECHNOLOGY, 2022-2030(USD BILLION) 55
TABLE 23 EUROPE: DRAM MARKET, BY APPLICATION, 2022-2030(USD BILLION) 55
TABLE 24 UK: DRAM MARKET, BY TYPE, 2022-2030(USD BILLION) 56
TABLE 25 UK: DRAM MARKET, BY TECHNOLOGY, 2022-2030(USD BILLION) 56
TABLE 26 UK: DRAM MARKET, BY APPLICATION, 2022-2030(USD BILLION) 57
TABLE 27 GERMANY: DRAM MARKET, BY TYPE, 2022-2030(USD BILLION) 58
TABLE 28 GERMANY: DRAM MARKET, BY TECHNOLOGY, 2022-2030(USD BILLION) 58
TABLE 29 GERMANY: DRAM MARKET, BY APPLICATION, 2022-2030(USD BILLION) 59
TABLE 30 FRANCE: DRAM MARKET, BY TYPE, 2022-2030(USD BILLION) 60
TABLE 31 FRANCE: DRAM MARKET, BY TECHNOLOGY, 2022-2030(USD BILLION) 60
TABLE 32 FRANCE: DRAM MARKET, BY APPLICATION, 2022-2030(USD BILLION) 61
TABLE 33 REST OF EUROPE: DRAM MARKET, BY TYPE, 2022-2030(USD BILLION) 62
TABLE 34 REST OF EUROPE: DRAM MARKET, BY TECHNOLOGY, 2022-2030(USD BILLION) 62
TABLE 35 REST OF EUROPE: DRAM MARKET, BY APPLICATION, 2022-2030(USD BILLION) 63
TABLE 36 ASIA-PACIFIC: DRAM MARKET, BY COUNTRY, 2022-2030(USD BILLION) 65
TABLE 37 ASIA-PACIFIC: DRAM MARKET, BY TYPE, 2022-2030(USD BILLION) 66
TABLE 38 ASIA-PACIFIC: DRAM MARKET, BY TECHNOLOGY, 2022-2030(USD BILLION) 67
TABLE 39 ASIA-PACIFIC: DRAM MARKET, BY APPLICATION, 2022-2030(USD BILLION) 67
TABLE 40 CHINA: DRAM MARKET, BY TYPE, 2022-2030(USD BILLION) 68
TABLE 41 CHINA: DRAM MARKET, BY TECHNOLOGY, 2022-2030(USD BILLION) 68
TABLE 42 CHINA: DRAM MARKET, BY APPLICATION, 2022-2030(USD BILLION) 69
TABLE 43 JAPAN: DRAM MARKET, BY TYPE, 2022-2030(USD BILLION) 70
TABLE 44 JAPAN: DRAM MARKET, BY TECHNOLOGY, 2022-2030(USD BILLION) 70
TABLE 45 JAPAN: DRAM MARKET, BY APPLICATION, 2022-2030(USD BILLION) 71
TABLE 46 INDIA: DRAM MARKET, BY TYPE, 2022-2030(USD BILLION) 72
TABLE 47 INDIA: DRAM MARKET, BY TECHNOLOGY, 2022-2030(USD BILLION) 72
TABLE 48 INDIA: DRAM MARKET, BY APPLICATION, 2022-2030(USD BILLION) 73
TABLE 49 SOUTH KOREA: DRAM MARKET, BY TYPE, 2022-2030(USD BILLION) 74
TABLE 50 SOUTH KOREA: DRAM MARKET, BY TECHNOLOGY, 2022-2030(USD BILLION) 74
TABLE 51 SOUTH KOREA: DRAM MARKET, BY APPLICATION, 2022-2030(USD BILLION) 75
TABLE 52 REST OF ASIA-PACIFIC: DRAM MARKET, BY TYPE, 2022-2030(USD BILLION) 76
TABLE 53 REST OF ASIA-PACIFIC: DRAM MARKET, BY TECHNOLOGY, 2022-2030(USD BILLION) 76
TABLE 54 REST OF ASIA-PACIFIC: DRAM MARKET, BY APPLICATION, 2022-2030(USD BILLION) 77
TABLE 55 REST OF THE WORLD: DRAM MARKET, BY COUNTRY, 2022-2030(USD BILLION) 79
TABLE 56 REST OF THE WORLD: DRAM MARKET, BY TYPE, 2022-2030(USD BILLION) 79
TABLE 57 REST OF THE WORLD: DRAM MARKET, BY TECHNOLOGY, 2022-2030(USD BILLION) 80
TABLE 58 REST OF THE WORLD: DRAM MARKET, BY APPLICATION, 2022-2030(USD BILLION) 81
TABLE 59 MIDDLE EAST & AFRICA: DRAM MARKET, BY TYPE, 2022-2030(USD BILLION) 82
TABLE 60 MIDDLE EAST & AFRICA: DRAM MARKET, BY TECHNOLOGY, 2022-2030(USD BILLION) 82
TABLE 61 MIDDLE EAST & AFRICA: DRAM MARKET, BY APPLICATION, 2022-2030(USD BILLION) 83
TABLE 62 LATIN AMERICA: DRAM MARKET, BY TYPE, 2022-2030(USD BILLION) 84
TABLE 63 LATIN AMERICA: DRAM MARKET, BY TECHNOLOGY, 2022-2030(USD BILLION) 84
TABLE 64 LATIN AMERICA: DRAM MARKET, BY APPLICATION, 2022-2030(USD BILLION) 85
12 List Of Figures
FIGURE 1 GLOBAL DRAM MARKET: MARKET STRUCTURE 17
FIGURE 2 TOP DOWN & BOTTOM UP APPROACH 22
FIGURE 3 DRIVERS, RESTRAINT, AND OPPORTUNITY ANALYSIS OF GLOBAL DRAM MARKET 24
FIGURE 4 VALUE CHAIN: DRAM MARKET 27
FIGURE 5 PORTER'S FIVE FORCES ANALYSIS OF THE GLOBAL DRAM MARKET 28
FIGURE 6 GLOBAL DRAM MARKET, BY TYPE, 2022 VS 2030 (USD BILLION) 31
FIGURE 7 GLOBAL DRAM MARKET, BY TECHNOLOGY 2022 VS 2030 (USD BILLION) 34
FIGURE 8 GLOBAL DRAM MARKET, BY APPLICATION 2022 VS 2030 (USD BILLION) 37
FIGURE 9 GLOBAL DRAM MARKET, BY REGION, GROWTH RATE, 2018-2027 (%) 40
FIGURE 10 GLOBAL DRAM MARKET, BY REGION, 2022 VS 2030 (USD BILLION) 40
FIGURE 11 NORTH AMERICA: DRAM MARKET GROWTH RATE, 2022-2030(%) 42
FIGURE 12 NORTH AMERICA: DRAM MARKET SIZE, BY COUNTRY, 2022 VS 2030 (USD BILLION) 42
FIGURE 13 NORTH AMERICA: DRAM MARKET, BY TYPE, 2022 VS 2030 (USD BILLION) 43
FIGURE 14 NORTH AMERICA: DRAM MARKET, BY TECHNOLOGY, 2022 VS 2030 (USD BILLION) 44
FIGURE 15 NORTH AMERICA: DRAM MARKET, BY APPLICATION, 2022 VS 2030 (USD BILLION) 44
FIGURE 16 EUROPE: DRAM MARKET GROWTH RATE, 2022-2030(%) 52
FIGURE 17 EUROPE: DRAM MARKET SIZE, BY COUNTRY, 2022 VS 2030 (USD BILLION) 52
FIGURE 18 EUROPE: DRAM MARKET, BY TYPE, 2022 VS 2030 (USD BILLION) 53
FIGURE 19 EUROPE: DRAM MARKET, BY TECHNOLOGY, 2022 VS 2030 (USD BILLION) 54
FIGURE 20 EUROPE: DRAM MARKET, BY APPLICATION, 2022 VS 2030 (USD BILLION) 55
FIGURE 21 ASIA-PACIFIC: DRAM MARKET GROWTH RATE, 2022-2030(%) 64
FIGURE 22 ASIA-PACIFIC: DRAM MARKET SIZE, BY COUNTRY, 2022 VS 2030 (USD BILLION) 65
FIGURE 23 ASIA-PACIFIC: DRAM MARKET, BY TYPE, 2022 VS 2030 (USD BILLION) 65
FIGURE 24 ASIA-PACIFIC: DRAM MARKET, BY TECHNOLOGY, 2022 VS 2030 (USD BILLION) 66
FIGURE 25 ASIA-PACIFIC: DRAM MARKET, BY APPLICATION, 2022 VS 2030 (USD BILLION) 67
FIGURE 26 REST OF THE WORLD: DRAM MARKET GROWTH RATE, 2022-2030(%) 78
FIGURE 27 REST OF THE WORLD: DRAM MARKET SIZE, BY COUNTRY, 2022 VS 2030 (USD BILLION) 78
FIGURE 28 REST OF THE WORLD: DRAM MARKET, BY TYPE, 2022 VS 2030 (USD BILLION) 79
FIGURE 29 REST OF THE WORLD: DRAM MARKET, BY TECHNOLOGY, 2022 VS 2030 (USD BILLION) 80
FIGURE 30 REST OF THE WORLD: DRAM MARKET, BY APPLICATION, 2022 VS 2030 (USD BILLION) 81
FIGURE 31 TOP 5 MAJOR COMPETITORS MARKET SHARE, 2022 (%) 88
FIGURE 32 COMPETITIVE BENCHMARKING OF MAJOR COMPETITORS 89
Dynamic RAM (DRAM) Market Segmentation
Global Dynamic RAM (DRAM), By Type Outlook (USD Billion, 2018-2030)
Synchronous DRAM
BEDO (Burst Extended Data Output)
EDO (Extended Data Output)
Asynchronous DRAM
FPM (Fast Page Mode)
Global Dynamic RAM (DRAM), By Technology (USD Billion, 2018-2030)
DDR4
DDR3
DDR5/GDDR5
DDR2
Global Dynamic RAM (DRAM), By Deployment Mode Outlook (USD Billion, 2018-2030)
PC/Laptops
Mobile Phones
Gaming Consoles
Networking Devices
Global Dynamic RAM (DRAM) Regional Outlook (USD Billion, 2018-2030)
North America Outlook (USD Billion, 2018-2030)
North America Dynamic RAM (DRAM), By Type Outlook (USD Billion, 2018-2030)
Synchronous DRAM
BEDO (Burst Extended Data Output)
EDO (Extended Data Output)
Asynchronous DRAM
FPM (Fast Page Mode)
North America Dynamic RAM (DRAM), By Technology (USD Billion, 2018-2030)
DDR4
DDR3
DDR5/GDDR5
DDR2
North America Dynamic RAM (DRAM), By Deployment Mode Outlook (USD Billion, 2018-2030)
PC/Laptops
Mobile Phones
Gaming Consoles
Networking Devices
US Outlook (USD Billion, 2018-2030)
US Dynamic RAM (DRAM), By Type Outlook (USD Billion, 2018-2030)
Synchronous DRAM
BEDO (Burst Extended Data Output)
EDO (Extended Data Output)
Asynchronous DRAM
FPM (Fast Page Mode)
US Dynamic RAM (DRAM), By Technology (USD Billion, 2018-2030)
DDR4
DDR3
DDR5/GDDR5
DDR2
US Dynamic RAM (DRAM), By Deployment Mode Outlook (USD Billion, 2018-2030)
PC/Laptops
Mobile Phones
Gaming Consoles
Networking Devices
Canada Outlook (USD Billion, 2018-2030)
Canada Dynamic RAM (DRAM), By Type Outlook (USD Billion, 2018-2030)
Synchronous DRAM
BEDO (Burst Extended Data Output)
EDO (Extended Data Output)
Asynchronous DRAM
FPM (Fast Page Mode)
Canada Dynamic RAM (DRAM), By Technology (USD Billion, 2018-2030)
DDR4
DDR3
DDR5/GDDR5
DDR2
Canada Dynamic RAM (DRAM), By Deployment Mode Outlook (USD Billion, 2018-2030)
PC/Laptops
Mobile Phones
Gaming Consoles
Networking Devices
Mexico Outlook (USD Billion, 2018-2030)
Mexico Dynamic RAM (DRAM), By Type Outlook (USD Billion, 2018-2030)
Synchronous DRAM
BEDO (Burst Extended Data Output)
EDO (Extended Data Output)
Asynchronous DRAM
FPM (Fast Page Mode)
Mexico Dynamic RAM (DRAM), By Technology (USD Billion, 2018-2030)
DDR4
DDR3
DDR5/GDDR5
DDR2
Mexico Dynamic RAM (DRAM), By Deployment Mode Outlook (USD Billion, 2018-2030)
PC/Laptops
Mobile Phones
Gaming Consoles
Networking Devices
Europe Outlook (USD Billion, 2018-2030)
Europe Dynamic RAM (DRAM), By Type Outlook (USD Billion, 2018-2030)
Synchronous DRAM
BEDO (Burst Extended Data Output)
EDO (Extended Data Output)
Asynchronous DRAM
FPM (Fast Page Mode)
Europe Dynamic RAM (DRAM), By Technology (USD Billion, 2018-2030)
DDR4
DDR3
DDR5/GDDR5
DDR2
Europe Dynamic RAM (DRAM), By Deployment Mode Outlook (USD Billion, 2018-2030)
PC/Laptops
Mobile Phones
Gaming Consoles
Networking Devices
Germany Outlook (USD Billion, 2018-2030)
Germany Dynamic RAM (DRAM), By Type Outlook (USD Billion, 2018-2030)
Synchronous DRAM
BEDO (Burst Extended Data Output)
EDO (Extended Data Output)
Asynchronous DRAM
FPM (Fast Page Mode)
Germany Dynamic RAM (DRAM), By Technology (USD Billion, 2018-2030)
DDR4
DDR3
DDR5/GDDR5
DDR2
Germany Dynamic RAM (DRAM), By Deployment Mode Outlook (USD Billion, 2018-2030)
PC/Laptops
Mobile Phones
Gaming Consoles
Networking Devices
France Outlook (USD Billion, 2018-2030)
France Dynamic RAM (DRAM), By Type Outlook (USD Billion, 2018-2030)
Synchronous DRAM
BEDO (Burst Extended Data Output)
EDO (Extended Data Output)
Asynchronous DRAM
FPM (Fast Page Mode)
France Dynamic RAM (DRAM), By Technology (USD Billion, 2018-2030)
DDR4
DDR3
DDR5/GDDR5
DDR2
France Dynamic RAM (DRAM), By Deployment Mode Outlook (USD Billion, 2018-2030)
PC/Laptops
Mobile Phones
Gaming Consoles
Networking Devices
UK Outlook (USD Billion, 2018-2030)
UK Dynamic RAM (DRAM), By Type Outlook (USD Billion, 2018-2030)
Synchronous DRAM
BEDO (Burst Extended Data Output)
EDO (Extended Data Output)
Asynchronous DRAM
FPM (Fast Page Mode)
UK Dynamic RAM (DRAM), By Technology (USD Billion, 2018-2030)
DDR4
DDR3
DDR5/GDDR5
DDR2
UK Dynamic RAM (DRAM), By Deployment Mode Outlook (USD Billion, 2018-2030)
PC/Laptops
Mobile Phones
Gaming Consoles
Networking Devices
Rest of Europe Outlook (USD Billion, 2018-2030)
Rest of Europe Dynamic RAM (DRAM), By Type Outlook (USD Billion, 2018-2030)
Synchronous DRAM
BEDO (Burst Extended Data Output)
EDO (Extended Data Output)
Asynchronous DRAM
FPM (Fast Page Mode)
Rest of Europe Dynamic RAM (DRAM), By Technology (USD Billion, 2018-2030)
DDR4
DDR3
DDR5/GDDR5
DDR2
Rest of Europe Dynamic RAM (DRAM), By Deployment Mode Outlook (USD Billion, 2018-2030)
PC/Laptops
Mobile Phones
Gaming Consoles
Networking Devices
Asia-Pacific Outlook (USD Billion, 2018-2030)
Asia-Pacific Dynamic RAM (DRAM), By Type Outlook (USD Billion, 2018-2030)
Synchronous DRAM
BEDO (Burst Extended Data Output)
EDO (Extended Data Output)
Asynchronous DRAM
FPM (Fast Page Mode)
Asia-Pacific Dynamic RAM (DRAM), By Technology (USD Billion, 2018-2030)
DDR4
DDR3
DDR5/GDDR5
DDR2
Asia-Pacific Dynamic RAM (DRAM), By Deployment Mode Outlook (USD Billion, 2018-2030)
PC/Laptops
Mobile Phones
Gaming Consoles
Networking Devices
China Outlook (USD Billion, 2018-2030)
China Dynamic RAM (DRAM), By Type Outlook (USD Billion, 2018-2030)
Synchronous DRAM
BEDO (Burst Extended Data Output)
EDO (Extended Data Output)
Asynchronous DRAM
FPM (Fast Page Mode)
China Dynamic RAM (DRAM), By Technology (USD Billion, 2018-2030)
DDR4
DDR3
DDR5/GDDR5
DDR2
China Dynamic RAM (DRAM), By Deployment Mode Outlook (USD Billion, 2018-2030)
PC/Laptops
Mobile Phones
Gaming Consoles
Networking Devices
India Outlook (USD Billion, 2018-2030)
India Dynamic RAM (DRAM), By Type Outlook (USD Billion, 2018-2030)
Synchronous DRAM
BEDO (Burst Extended Data Output)
EDO (Extended Data Output)
Asynchronous DRAM
FPM (Fast Page Mode)
India Dynamic RAM (DRAM), By Technology (USD Billion, 2018-2030)
DDR4
DDR3
DDR5/GDDR5
DDR2
India Dynamic RAM (DRAM), By Deployment Mode Outlook (USD Billion, 2018-2030)
PC/Laptops
Mobile Phones
Gaming Consoles
Networking Devices
Japan Outlook (USD Billion, 2018-2030)
Japan Dynamic RAM (DRAM), By Type Outlook (USD Billion, 2018-2030)
Synchronous DRAM
BEDO (Burst Extended Data Output)
EDO (Extended Data Output)
Asynchronous DRAM
FPM (Fast Page Mode)
Japan Dynamic RAM (DRAM), By Technology (USD Billion, 2018-2030)
DDR4
DDR3
DDR5/GDDR5
DDR2
Japan Dynamic RAM (DRAM), By Deployment Mode Outlook (USD Billion, 2018-2030)
PC/Laptops
Mobile Phones
Gaming Consoles
Networking Devices
Rest of Asia-Pacific Outlook (USD Billion, 2018-2030)
Rest of Asia-Pacific Dynamic RAM (DRAM), By Type Outlook (USD Billion, 2018-2030)
Synchronous DRAM
BEDO (Burst Extended Data Output)
EDO (Extended Data Output)
Asynchronous DRAM
FPM (Fast Page Mode)
Rest of Asia-Pacific Dynamic RAM (DRAM), By Technology (USD Billion, 2018-2030)
DDR4
DDR3
DDR5/GDDR5
DDR2
Rest of Asia-Pacific Dynamic RAM (DRAM), By Deployment Mode Outlook (USD Billion, 2018-2030)
PC/Laptops
Mobile Phones
Gaming Consoles
Networking Devices
Rest of the World Outlook (USD Billion, 2018-2030)
Rest of the World Dynamic RAM (DRAM), By Type Outlook (USD Billion, 2018-2030)
Synchronous DRAM
BEDO (Burst Extended Data Output)
EDO (Extended Data Output)
Asynchronous DRAM
FPM (Fast Page Mode)
Rest of the World Dynamic RAM (DRAM), By Technology (USD Billion, 2018-2030)
DDR4
DDR3
DDR5/GDDR5
DDR2
Rest of the World Dynamic RAM (DRAM), By Deployment Mode Outlook (USD Billion, 2018-2030)
PC/Laptops
Mobile Phones
Gaming Consoles
Networking Devices
Middle East & Africa Outlook (USD Billion, 2018-2030)
Middle East & Africa Dynamic RAM (DRAM), By Type Outlook (USD Billion, 2018-2030)
Synchronous DRAM
BEDO (Burst Extended Data Output)
EDO (Extended Data Output)
Asynchronous DRAM
FPM (Fast Page Mode)
Middle East & Africa Dynamic RAM (DRAM), By Technology (USD Billion, 2018-2030)
DDR4
DDR3
DDR5/GDDR5
DDR2
Middle East & Africa Dynamic RAM (DRAM), By Deployment Mode Outlook (USD Billion, 2018-2030)
PC/Laptops
Mobile Phones
Gaming Consoles
Networking Devices
South America Outlook (USD Billion, 2018-2030)
South America Dynamic RAM (DRAM), By Type Outlook (USD Billion, 2018-2030)
Synchronous DRAM
BEDO (Burst Extended Data Output)
EDO (Extended Data Output)
Asynchronous DRAM
FPM (Fast Page Mode)
South America Dynamic RAM (DRAM), By Technology (USD Billion, 2018-2030)
DDR4
DDR3
DDR5/GDDR5
DDR2
South America Dynamic RAM (DRAM), By Deployment Mode Outlook (USD Billion, 2018-2030)
PC/Laptops
Mobile Phones
Gaming Consoles
Networking Devices
Research Methodology on Dynamic Ram (Dram) Market
Introduction
The research methodology is the collection of methods and processes used in research. It involves writing up the research hypothesis, selecting the tools to be used, defining the population and sample size, designing the questionnaire or other tools, conducting the research, analyzing the data, and generalizing the results. This report focuses on the research methodology selected for the Market Research Future Report titled “Global DRAM Market: Forecast till 2030.”
Objectives of the Research
The main objective of this research is to provide an analysis of the global DRAM market through the study of Market Size, pricing structure, product type, and application. The Market Research Future report identifies and examines the global DRAM market by considering its past performance and current trends. The report seeks to understand the direction of the DRAM market, its growth rate, and the challenges and opportunities it faces in the near future.
Research Methodology
This research is conducted using a qualitative approach, wherein the data is obtained from primary and secondary sources, and the nature and type of data are the main focus. The research methodology used in the Market Research Future Report consists of the following components:
Primary Data:
Primary data is collected through a survey questionnaire, interviews and/or group discussions with industry experts. This information is used to provide detailed insights into the market and identify any potential opportunities or threats.
Secondary Data:
Secondary data is obtained from a review of relevant books, reports, articles and other publications related to the DRAM market. The secondary data provides the necessary background information to supplement the primary data collected.
Research Process
The research process employed in the creation of the Market Research Future report is divided into four main stages:
Stage 1: Data Collection
A thorough literature review is conducted to gain an understanding of the DRAM market and its various components. Relevant books, articles, reports and other publications are reviewed to obtain data on market size, pricing structure, product type, and application.
Stage 2: Survey Design
The survey questionnaire is designed to coincide with the objectives of the research and provide the necessary data for the analysis. It is reviewed by industry experts to ensure the accuracy and appropriateness of the questions.
Stage 3: Data Collection
The survey is distributed to a wide range of industry experts to obtain their opinions and insights on the DRAM market. The survey results provide the necessary data for the analysis and interpretation of the DRAM market.
Stage 4: Data Analysis
The collected data is analyzed using Excel and SPSS software to obtain the necessary insights into the DRAM market. The collected data is categorized and sorted into meaningful segments and analyzed to identify any potential opportunities or threats.
Conclusion
This research report has outlined the research methodology utilized in the creation of the Market Research Future Report on the Global DRAM Market: Forecast to 2030. A thorough literature review is conducted, survey design and sample selection methods are employed and data is collected through a survey questionnaire, interviews and group discussions with industry experts. The data is analyzed and interpreted to gain better insights and identify any potential opportunities or threats in the DRAM market.