Disposable Endoscope Market (2026 - 2035)

ID: MRFR/HC/10245-HCR 128 Pages Rahul Gotadki Last Updated: September 15, 2026
Disposable Endoscope Market Research Report: Size, Share, Trend Analysis By Product Type (Rigid Endoscope, Flexible Endoscope, Video Endoscope), By Applications (Gastroenterology, Urology, Pulmonology, ENT, Cardiology), By End Users (Hospitals, Ambulatory Surgical Centers, Specialty Clinics), By Distribution Channel (Direct Sales, Distributors, Online Sales) and By Regional (North America, Europe, South America, Asia Pacific, Middle East and Africa) - Growth Outlook & Industry Forecast 2025 To 2035
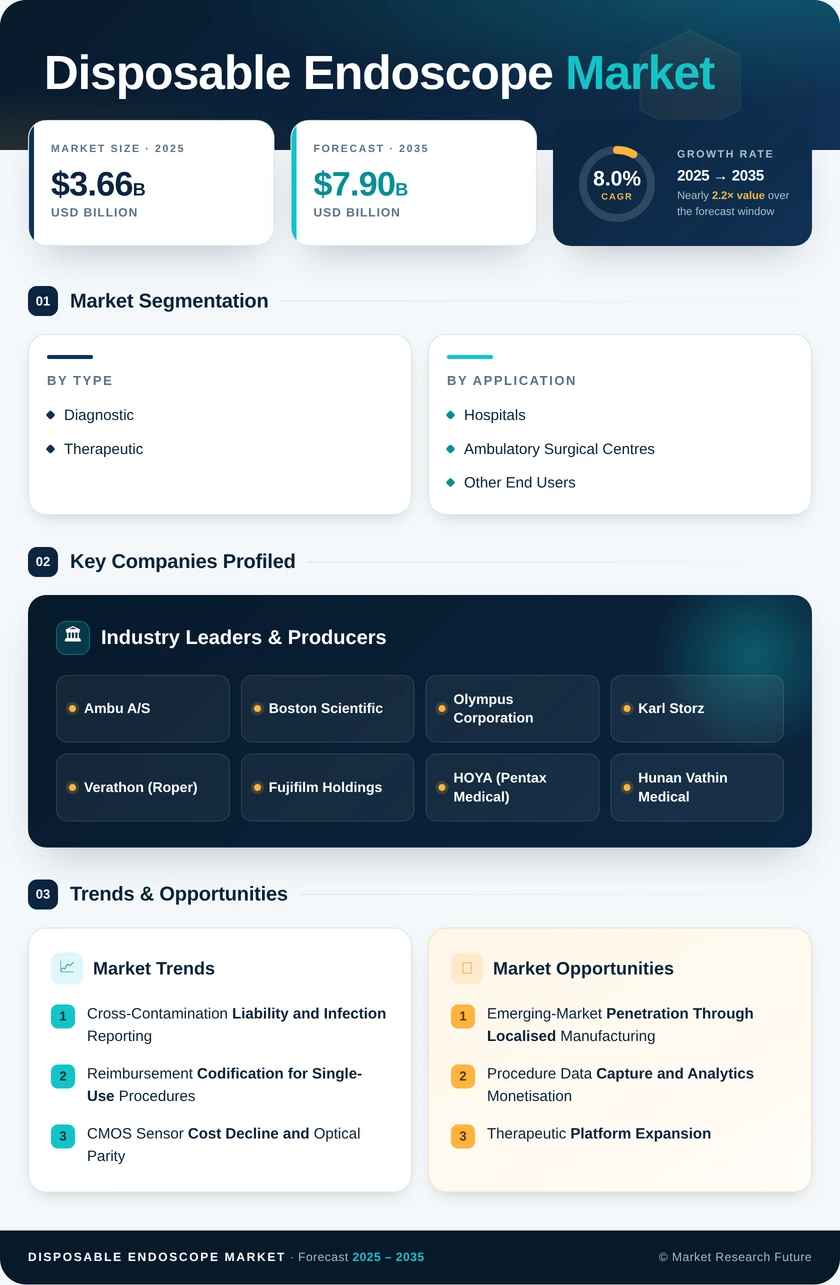
Disposable Endoscope Market
Market Size
Forecast Period2026-2035
CAGR (2026-2035)8.0%
2025 Market SizeUSD 3.66 Billion
2035 Market SizeUSD 7.90 Billion
Key Players
Ambu A/S
Boston Scientific
Olympus Corporation
Karl Storz
Verathon
Fujifilm Holdings
Opportunities
  • Emerging-Market Penetration Through Localised Manufacturing
  • Procedure Data Capture and Analytics Monetisation
  • Therapeutic Platform Expansion
  1. 1 Market Summary | |
    1. 1.1 Study Assumptions & Market Definition | |
    2. 1.2 Scope of the Study | |
    3. 1.3 Research Methodology | |
  2. 2 Key Report Takeaways | |
    1. 2.1 By Product | |
    2. 2.2 By Application Type | |
    3. 2.3 By Procedure Type | |
    4. 2.4 By End User | |
    5. 2.5 By Region | |
  3. 3 Market Size and Forecast (2021–2035) | |
    1. 3.1 Historical Market Size (2021–2024) | |
    2. 3.2 Base Year Assessment (2025) | |
    3. 3.3 Current & Forecast Market Size (2026–2035) | |
    4. 3.4 Year-over-Year Growth Analysis | |
  4. 4 Driver Impact Analysis | |
    1. 4.1 Cross-Contamination Liability and Infection Reporting | |
    2. 4.2 Reimbursement Codification for Single-Use Procedures | |
    3. 4.3 CMOS Sensor Cost Decline and Optical Parity | |
    4. 4.4 Sterile Processing Labour Shortage | |
    5. 4.5 Ambulatory Surgical Centre Expansion | |
    6. 4.6 FDA Duodenoscope Transition Guidance | |
    7. 4.7 ICU Bronchoscopy Volume Growth | |
  5. 5 Restraints Impact Analysis | |
    1. 5.1 Per-Procedure Cost Premium Versus Amortised Fleets | |
    2. 5.2 Medical Plastic Waste and Decarbonisation Mandates | |
    3. 5.3 Therapeutic Channel and Accessory Limitations | |
    4. 5.4 Image Quality Gaps in High-Acuity Procedures | |
    5. 5.5 Polymer Resin Price and Supply Concentration | |
  6. 6 Opportunities | |
    1. 6.1 Emerging-Market Penetration Through Localised Manufacturing | |
    2. 6.2 Procedure Data Capture and Analytics Monetisation | |
    3. 6.3 Therapeutic Platform Expansion | |
    4. 6.4 Capital-Light Subscription and Bundled Service Models | |
    5. 6.5 Low-Carbon and Recyclable Device Engineering | |
  7. 7 Regional Market Share and Country-Level Analysis | |
    1. 7.1 North America | | |
      1. 7.1.1 US | | |
      2. 7.1.2 Canada | | |
      3. 7.1.3 Mexico | |
    2. 7.2 Europe | | |
      1. 7.2.1 Germany | | |
      2. 7.2.2 UK | | |
      3. 7.2.3 France | | |
      4. 7.2.4 Italy | | |
      5. 7.2.5 Spain | | |
      6. 7.2.6 Nordic Countries | | |
      7. 7.2.7 Russia | | |
      8. 7.2.8 Rest of Europe | |
    3. 7.3 Asia-Pacific | | |
      1. 7.3.1 China | | |
      2. 7.3.2 India | | |
      3. 7.3.3 Japan | | |
      4. 7.3.4 South Korea | | |
      5. 7.3.5 ASEAN | | |
      6. 7.3.6 Rest of Asia-Pacific | |
    4. 7.4 South America | | |
      1. 7.4.1 Brazil | | |
      2. 7.4.2 Argentina | | |
      3. 7.4.3 Rest of South America | |
    5. 7.5 Middle East & Africa | | |
      1. 7.5.1 Saudi Arabia | | |
      2. 7.5.2 UAE | | |
      3. 7.5.3 South Africa | | |
      4. 7.5.4 Egypt | | |
      5. 7.5.5 Rest of MEA | |
  8. 8 Future Outlook (2026–2035) | |
    1. 8.1 Embedded AI Detection as a Platform Differentiator | |
    2. 8.2 Razor-and-Blade Economics and Installed Base Lock-In | |
    3. 8.3 Carbon Accounting and Circular Design Requirements | |
    4. 8.4 Manufacturing Regionalisation and Cost Deflation | |
  9. 9 Segmentation Analysis | |
    1. 9.1 By Product | | |
      1. 9.1.1 Gastroscopes | | |
      2. 9.1.2 Bronchoscopes | | |
      3. 9.1.3 Duodenoscopes | | |
      4. 9.1.4 Other Product Types | |
    2. 9.2 By Application Type | | |
      1. 9.2.1 Gastroenterology | | |
      2. 9.2.2 Pulmonology | | |
      3. 9.2.3 Urology | | |
      4. 9.2.4 Other Application Types | |
    3. 9.3 By Procedure Type | | |
      1. 9.3.1 Diagnostic | | |
      2. 9.3.2 Therapeutic | |
    4. 9.4 By End User | | |
      1. 9.4.1 Hospitals | | |
      2. 9.4.2 Ambulatory Surgical Centres | | |
      3. 9.4.3 Other End Users | |
  10. 10 Competitive Landscape | |
    1. 10.1 Market Concentration Analysis (2025) | |
    2. 10.2 Competitive Benchmarking Matrix | |
    3. 10.3 Company Profiles | | |
      1. 10.3.1 Ambu A/S | | |
      2. 10.3.2 Boston Scientific | | |
      3. 10.3.3 Olympus Corporation | | |
      4. 10.3.4 Karl Storz | | |
      5. 10.3.5 Verathon | | |
      6. 10.3.6 Fujifilm Holdings | | |
      7. 10.3.7 HOYA (Pentax Medical) | | |
      8. 10.3.8 Hunan Vathin Medical | | |
      9. 10.3.9 Flexicare Medical | | |
      10. 10.3.10 Cook Medical | | |
      11. 10.3.11 UroViu Corporation | |
  11. 11 Recent News & Developments | |
  12. 12 Report Scope and Methodology | |
    1. 12.1 Study Period & Base Year | |
    2. 12.2 Data Sources & Citations | |
    3. 12.3 Abbreviations | |
  13. 13 Detailed Sources and Citations | |
  14. 14 Frequently Asked Questions (FAQs) | | LIST OF TABLES | |
  15. TABLE 1 Global Disposable Endoscope Market Size & Forecast, by Revenue (USD Billion), 2021–2035 | |
  16. TABLE 2 Global Disposable Endoscope Market – Year-over-Year Growth Analysis, 2021–2035 | |
  17. TABLE 3 Driver Impact Analysis Matrix, 2026–2035 | |
  18. TABLE 4 Restraint Impact Analysis Matrix, 2026–2035 | |
  19. TABLE 5 Global Disposable Endoscope Market Size, by Region, 2021–2035 (USD Billion) | |
  20. TABLE 6 North America Disposable Endoscope Market Size, by Country, 2021–2035 (USD Billion) | |
  21. TABLE 7 Europe Disposable Endoscope Market Size, by Country, 2021–2035 (USD Billion) | |
  22. TABLE 8 Asia-Pacific Disposable Endoscope Market Size, by Country, 2021–2035 (USD Billion) | |
  23. TABLE 9 South America Disposable Endoscope Market Size, by Country, 2021–2035 (USD Billion) | |
  24. TABLE 10 Middle East & Africa Disposable Endoscope Market Size, by Country, 2021–2035 (USD Billion) | |
  25. TABLE 11 Global Disposable Endoscope Market Size, by Product, 2021–2035 (USD Billion) | |
  26. TABLE 12 Global Disposable Endoscope Market Size, by Application Type, 2021–2035 (USD Billion) | |
  27. TABLE 13 Global Disposable Endoscope Market Size, by Procedure Type, 2021–2035 (USD Billion) | |
  28. TABLE 14 Global Disposable Endoscope Market Size, by End User, 2021–2035 (USD Billion) | |
  29. TABLE 15 North America Disposable Endoscope Market Size, by Product, 2021–2035 (USD Billion) | |
  30. TABLE 16 North America Disposable Endoscope Market Size, by Application Type, 2021–2035 (USD Billion) | |
  31. TABLE 17 North America Disposable Endoscope Market Size, by End User, 2021–2035 (USD Billion) | |
  32. TABLE 18 Europe Disposable Endoscope Market Size, by Product, 2021–2035 (USD Billion) | |
  33. TABLE 19 Europe Disposable Endoscope Market Size, by Application Type, 2021–2035 (USD Billion) | |
  34. TABLE 20 Asia-Pacific Disposable Endoscope Market Size, by Product, 2021–2035 (USD Billion) | |
  35. TABLE 21 Asia-Pacific Disposable Endoscope Market Size, by End User, 2021–2035 (USD Billion) | |
  36. TABLE 22 Competitive Benchmarking Matrix – Global Disposable Endoscope Market, 2025 | |
  37. TABLE 23 Company Profiles – Key Players, Global Disposable Endoscope Market | |
  38. TABLE 24 Recent Developments & Strategic Announcements, 2023–2025 | |
  39. TABLE 25 Report Scope & Methodology Summary | |
  40. TABLE 26 Detailed Sources and Citations | | LIST OF FIGURES | |
  41. FIGURE 1 Market Dynamics Overview – Drivers, Restraints and Opportunities | |
  42. FIGURE 2 Industry Value Chain Analysis – Disposable Endoscope Market | |
  43. FIGURE 3 Porter's Five Forces Analysis | |
  44. FIGURE 4 Global Market Size Trend and Forecast, 2021–2035 (USD Billion) | |
  45. FIGURE 5 Year-over-Year Growth Rate Trend, 2022–2035 (%) | |
  46. FIGURE 6 Market Share by Product, 2025 vs 2035 (%) | |
  47. FIGURE 7 Market Share by Application Type, 2025 (%) | |
  48. FIGURE 8 Market Share by Procedure Type, 2025 (%) | |
  49. FIGURE 9 Market Share by End User, 2025 (%) | |
  50. FIGURE 10 Regional Market Share Distribution, 2025 (%) | |
  51. FIGURE 11 Regional CAGR Comparison, 2026–2035 (%) | |
  52. FIGURE 12 North America Country-Level Share Breakdown, 2025 (%) | |
  53. FIGURE 13 Asia-Pacific Country-Level Growth Comparison, 2026–2035 (%) | |
  54. FIGURE 14 Competitive Landscape – Revenue Share Positioning, 2025 | |
  55. FIGURE 15 Strategic Positioning Matrix – Key Players | |
  56. FIGURE 16 Adoption Curve by Product Line, 2021–2035

Segmentation Quick Reference

DimensionSub-SegmentsDominant SegmentFastest Growing Segment
By ProductGastroscopes; Bronchoscopes; Duodenoscopes; Other Product TypesBronchoscopes (29.7% share, 2025)Duodenoscopes (9.8% CAGR, 2026–2035)
By Application TypeGastroenterology; Pulmonology; Urology; Other Application TypesGastroenterology (37.5% share, 2025)Pulmonology (9.5% CAGR, 2026–2035)
By Procedure TypeDiagnostic; TherapeuticDiagnostic (7.3% CAGR, 2026–2035)Therapeutic (28.5% share, 2025)
By End UserHospitals; Ambulatory Surgical Centres; Other End UsersHospitals (65.7% share, 2025)Ambulatory Surgical Centres (10.4% CAGR, 2026–2035)


Market Segmentation Overview

By Product

Sub-SegmentKey Trend
GastroscopesOutpatient upper-GI diagnostic conversion accelerates as channel width improves
BronchoscopesICU bedside deployment and resident training standardisation sustain leadership
DuodenoscopesRegulatory transition from fixed-endcap reusables drives premium-priced adoption
Other Product TypesUreteroscopy and cystoscopy fragment across regional and cost-led suppliers


Bronchoscopes lead this dimension because critical care generates the sharpest reprocessing pain point — isolation-room transport, drying cycles, and borescope inspection all disappear when the device arrives sterile-packaged. Duodenoscopes grow fastest despite a smaller revenue base, since FDA transition guidance places a replacement clock on installed ERCP fleets and average selling prices run four to six times bronchoscope levels. Gastroscopes hold steady volume in outpatient diagnostics but remain constrained by working-channel limits that keep therapeutic upper-GI work on reusable platforms.

By Application Type

Sub-SegmentKey Trend
GastroenterologyERCP contamination concern and outpatient colonoscopy density sustain scale
PulmonologyLung cancer staging and pneumonia diagnostics drive fastest expansion
UrologyStone-management caseloads support steady ureteroscopy consumption
Other Application TypesENT, gynaecology and emergency airway create incremental volume pockets


Gastroenterology leads on absolute procedure count, with ERCP-related cross-contamination anxiety converting reluctant GI suites faster than cost modelling alone would predict. Pulmonology grows fastest as transbronchial needle aspiration volumes rise and intensivists cite contamination risk and equipment downtime as decisive procurement variables. Urology sits between the two, where high stone-disease prevalence supports consistent ureteroscopy demand but reusable digital scopes retain a cost advantage in high-volume tertiary centres.

By Procedure Type

Sub-SegmentKey Trend
DiagnosticSimplified single-channel architecture enables cost-optimised mass production
TherapeuticWide-channel prototypes accepting larger accessories signal a post-2028 shift


Diagnostic procedures dominate volume because inspection-only devices need no complex channel or elevator mechanism, letting manufacturers hit price points that undercut loaded reusable economics while simplifying tray setup and room turnover. Therapeutic work is the faster riser from a smaller base, contingent on engineering progress in channel diameter, suction performance, and articulation stiffness. When those constraints ease, reimbursement-rich polypectomy, haemostasis and stone-extraction volume migrates, pulling compatible disposable accessory sales with it.

By End User

Sub-SegmentKey Trend
HospitalsInfection-prevention dashboards and training standardisation anchor demand
Ambulatory Surgical CentresZero-reprocessing footprint converts to billable procedure bays
Other End UsersOffice-based clinics and emergency transport adopt portable systems


Hospitals hold the majority position, embedding single-use metrics into infection-prevention reporting and standardising devices so resident training stays reproducible across rotations. Ambulatory surgical centres grow fastest because they never built central sterile departments, and reimbursement codification removed the revenue uncertainty that previously made disposables a pure cost line. Other end users — office urology, ENT clinics and pre-hospital services — represent the newest demand pocket, enabled by battery-powered portable systems that eliminate the fixed tower requirement entirely.




Download PDF ×

We do not share your information with anyone. However, we may send you emails based on your report interest from time to time. You may contact us at any time to opt-out.