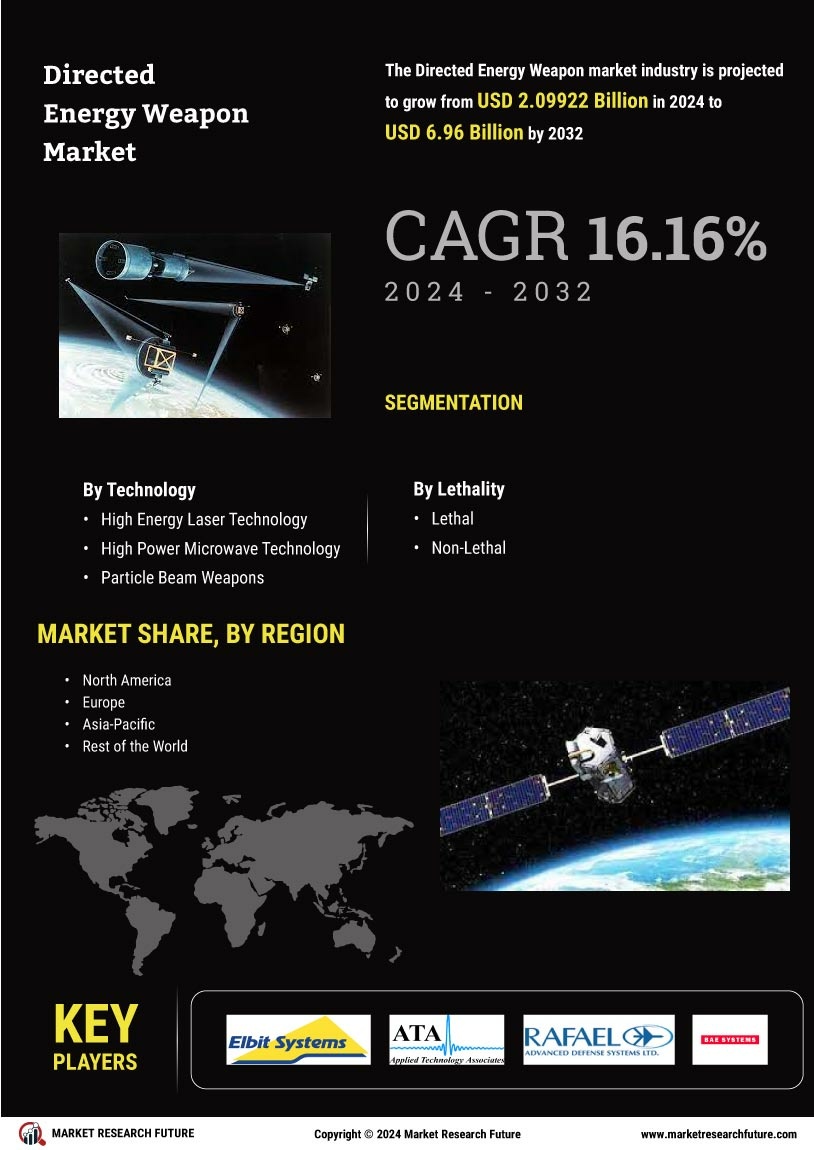
Certified Global Research Member
Isomar fd.webp Wcrc 57.webp
Key Questions Answered
  • Global Market Outlook
  • In-depth analysis of global and regional trends
  • Analyze and identify the major players in the market, their market share, key developments, etc.
  • To understand the capability of the major players based on products offered, financials, and strategies.
  • Identify disrupting products, companies, and trends.
  • To identify opportunities in the market.
  • Analyze the key challenges in the market.
  • Analyze the regional penetration of players, products, and services in the market.
  • Comparison of major players’ financial performance.
  • Evaluate strategies adopted by major players.
  • Recommendations
Why Choose Market Research Future?
  • Vigorous research methodologies for specific market.
  • Knowledge partners across the globe
  • Large network of partner consultants.
  • Ever-increasing/ Escalating data base with quarterly monitoring of various markets
  • Trusted by fortune 500 companies/startups/ universities/organizations
  • Large database of 5000+ markets reports.
  • Effective and prompt pre- and post-sales support.

Directed Energy Weapon Market Research Report Information By Technology (High Energy Laser Technology, High Power Microwave Technology, Particle Beam Weapons, Plasma Weapons, and Sonic Weapons), By Lethality (Lethal and Non-Lethal), And By Region (North America, Europe, Asia-Pacific, And Rest Of The World) –Market Forecast Till 2032.


ID: MRFR/A&D/2312-CR | 140 Pages | Author: Sejal Akre| July 2019


Market Segmentation Tab


Directed Energy Weapon Technology Outlook (USD Billion, 2018-2032)


  • High Energy Laser Technology


  • High Power Microwave Technology


  • Particle Beam Weapons


  • Plasma Weapons


  • Sonic Weapons


Directed Energy Weapon Lethality Outlook (USD Billion, 2018-2032)


  • Lethal


  • Non-Lethal


Directed Energy Weapon Regional Outlook (USD Billion, 2018-2032)


  • North America Outlook (USD Billion, 2018-2032)


    • North America Directed Energy Weapon by Technology


      • High Energy Laser Technology


      • High Power Microwave Technology


      • Particle Beam Weapons


      • Plasma Weapons


      • Sonic Weapons


    • North America Directed Energy Weapon by Lethality


      • Lethal


      • Non-Lethal


    • US Outlook (USD Billion, 2018-2032)


    • US Directed Energy Weapon by Technology


      • High Energy Laser Technology


      • High Power Microwave Technology


      • Particle Beam Weapons


      • Plasma Weapons


      • Sonic Weapons


    • US Directed Energy Weapon by Lethality


      • Lethal


      • Non-Lethal


    • CANADA Outlook (USD Billion, 2018-2032)


    • CANADA Directed Energy Weapon by Technology


      • High Energy Laser Technology


      • High Power Microwave Technology


      • Particle Beam Weapons


      • Plasma Weapons


      • Sonic Weapons


    • CANADA Directed Energy Weapon by Lethality


      • Lethal


      • Non-Lethal


  • Europe Outlook (USD Billion, 2018-2032)


    • Europe Directed Energy Weapon by Technology


      • High Energy Laser Technology


      • High Power Microwave Technology


      • Particle Beam Weapons


      • Plasma Weapons


      • Sonic Weapons


    • Europe Directed Energy Weapon by Lethality


      • Lethal


      • Non-Lethal


    • Germany Outlook (USD Billion, 2018-2032)


    • Germany Directed Energy Weapon by Technology


      • High Energy Laser Technology


      • High Power Microwave Technology


      • Particle Beam Weapons


      • Plasma Weapons


      • Sonic Weapons


    • Germany Directed Energy Weapon by Lethality


      • Lethal


      • Non-Lethal


    • France Outlook (USD Billion, 2018-2032)


    • France Directed Energy Weapon by Technology


      • High Energy Laser Technology


      • High Power Microwave Technology


      • Particle Beam Weapons


      • Plasma Weapons


      • Sonic Weapons


    • France Directed Energy Weapon by Lethality


      • Lethal


      • Non-Lethal


    • UK Outlook (USD Billion, 2018-2032)


    • UK Directed Energy Weapon by Technology


      • High Energy Laser Technology


      • High Power Microwave Technology


      • Particle Beam Weapons


      • Plasma Weapons


      • Sonic Weapons


    • UK Directed Energy Weapon by Lethality


      • Lethal


      • Non-Lethal


    • ITALY Outlook (USD Billion, 2018-2032)


    • ITALY Directed Energy Weapon by Technology


      • High Energy Laser Technology


      • High Power Microwave Technology


      • Particle Beam Weapons


      • Plasma Weapons


      • Sonic Weapons


    • ITALY Directed Energy Weapon by Lethality


      • Lethal


      • Non-Lethal


    • SPAIN Outlook (USD Billion, 2018-2032)


    • Spain Directed Energy Weapon by Technology


      • High Energy Laser Technology


      • High Power Microwave Technology


      • Particle Beam Weapons


      • Plasma Weapons


      • Sonic Weapons


    • Spain Directed Energy Weapon by Lethality


      • Lethal


      • Non-Lethal


    • Rest Of Europe Outlook (USD Billion, 2018-2032)


    • Rest Of Europe Directed Energy Weapon by Technology


      • High Energy Laser Technology


      • High Power Microwave Technology


      • Particle Beam Weapons


      • Plasma Weapons


      • Sonic Weapons


    • REST OF EUROPE Directed Energy Weapon by Lethality


      • Lethal


      • Non-Lethal


    • Asia-Pacific Outlook (USD Billion, 2018-2032)


    • Asia-Pacific Directed Energy Weapon by Technology


      • High Energy Laser Technology


      • High Power Microwave Technology


      • Particle Beam Weapons


      • Plasma Weapons


      • Sonic Weapons


    • Asia-Pacific Directed Energy Weapon by Lethality


      • Lethal


      • Non-Lethal


    • China Outlook (USD Billion, 2018-2032)


    • China Directed Energy Weapon by Technology


      • High Energy Laser Technology


      • High Power Microwave Technology


      • Particle Beam Weapons


      • Plasma Weapons


      • Sonic Weapons


    • China Directed Energy Weapon by Lethality


      • Lethal


      • Non-Lethal


    • Japan Outlook (USD Billion, 2018-2032)


    • Japan Directed Energy Weapon by Technology


      • High Energy Laser Technology


      • High Power Microwave Technology


      • Particle Beam Weapons


      • Plasma Weapons


      • Sonic Weapons


    • Japan Directed Energy Weapon by Lethality


      • Lethal


      • Non-Lethal


    • India Outlook (USD Billion, 2018-2032)


    • India Directed Energy Weapon by Technology


      • High Energy Laser Technology


      • High Power Microwave Technology


      • Particle Beam Weapons


      • Plasma Weapons


      • Sonic Weapons


    • India Directed Energy Weapon by Lethality


      • Lethal


      • Non-Lethal


    • Australia Outlook (USD Billion, 2018-2032)


    • Australia Directed Energy Weapon by Technology


      • High Energy Laser Technology


      • High Power Microwave Technology


      • Particle Beam Weapons


      • Plasma Weapons


      • Sonic Weapons


    • Australia Directed Energy Weapon by Lethality


      • Lethal


      • Non-Lethal


    • Rest of Asia-Pacific Outlook (USD Billion, 2018-2032)


    • Rest of Asia-Pacific Directed Energy Weapon by Technology


      • High Energy Laser Technology


      • High Power Microwave Technology


      • Particle Beam Weapons


      • Plasma Weapons


      • Sonic Weapons


    • Rest of Asia-Pacific Directed Energy Weapon by Lethality


      • Lethal


      • Non-Lethal


    • Rest of the World Outlook (USD Billion, 2018-2032)


    • Rest of the World Directed Energy Weapon by Technology


      • High Energy Laser Technology


      • High Power Microwave Technology


      • Particle Beam Weapons


      • Plasma Weapons


      • Sonic Weapons


    • Rest of the World Directed Energy Weapon by Lethality


      • Lethal


      • Non-Lethal


    • Middle East Outlook (USD Billion, 2018-2032)


    • Middle East Directed Energy Weapon by Technology


      • High Energy Laser Technology


      • High Power Microwave Technology


      • Particle Beam Weapons


      • Plasma Weapons


      • Sonic Weapons


    • Middle East Directed Energy Weapon by Lethality


      • Lethal


      • Non-Lethal


    • Africa Outlook (USD Billion, 2018-2032)


    • Africa Directed Energy Weapon by Technology


      • High Energy Laser Technology


      • High Power Microwave Technology


      • Particle Beam Weapons


      • Plasma Weapons


      • Sonic Weapons


    • Africa Directed Energy Weapon by Lethality


      • Lethal


      • Non-Lethal


    • Latin America Outlook (USD Billion, 2018-2032)


    • Latin America Directed Energy Weapon by Technology


      • High Energy Laser Technology


      • High Power Microwave Technology


      • Particle Beam Weapons


      • Plasma Weapons


      • Sonic Weapons


    • Latin America Directed Energy Weapon by Lethality


      • Lethal


      • Non-Lethal


Research Methodology on Directed Energy Weapons Market


Introduction


The recent technology trend of directed energy weapons has been increasing with various militaries and security agencies across the world investing in these. It has enabled dual-use products for civilian and military applications. The rising trend of adoption of directed energy weapons is driving the global directed energy weapons market growth in emerging economies.


The report market focuses on the global directed energy weapons market and the attractive opportunity this market presents. The growth potential and influencing factors have been discussed thoroughly, along with the study of the changing market dynamics, market size, current trends, and trends associated with the target market.


Objective


  • To understand how the market size for the directed energy weapons industry is expected to evolve during the forecast period 2023 to 2030.

  • To analyze the key drivers, opportunities, and market dynamics

  • To define the competitive landscape and identify the key players in this market

  • To understand the current trajectory of the industry and determine the preferred market strategies for players in the near future

  • To predict the future trend and expected market outlook through analysis of the macroeconomic and geographic factors


Research Methodology


The research study uses a two-pronged approach to compile and analyze the data from multiple sources such as primary and secondary research. Primary research involves interactions with market stakeholders (industry experts, vendors, end-users, etc.) to gather relevant data on the growth prospects of the directed energy weapons industry. Secondary research involves gathering information by studying published reports, press releases, company websites, and government portal websites. Both the sources of research are blended to present an unbiased report on the market.


The report on the directed energy weapons market has been compiled using techniques such as bottom-up and top-down. The bottom-up approach entails studying the individual market segments and deriving a value for the overall market from these estimated individual segments’ values. The top-down approach entails estimating the overall market size by directly studying the market drivers and developments. The overall process is a combination of both secondary and primary research methods.


Various statistical techniques, including trend analysis, demand-supply triangulation, time-series analysis, factor analysis, and others, have been used to conduct market analysis to develop market estimates and forecasts. The report also includes details on the sales channels of products used in the directed energy weapons market.


Secondary research


Secondary research was used to gain an understanding of the directed energy weapons market. It includes an in-depth analysis of the market dynamics, trends, and competitive landscape. Secondary research is also used to gather information from various companies and organizations such as industry experts, vendors, and technology providers.


The secondary sources of data include business journals, paid and free databases, industry-specific reports, SEC filings, and research papers.


Primary Research


The primary research process for the report on the directed energy weapons market consists of a series of in-depth interviews with key stakeholders in the industry. End-users, technology providers, and industry experts in the field of directed energy weapons were contacted for primary research.


The primary research process involved in-depth interviews with individuals such as CEOs, CTOs, technology providers, industry experts, and marketing executives to understand the market dynamics, trends, and competitive landscape of the directed energy weapons market.

Leading companies partner with us for data-driven Insights
client_1 client_2 client_3 client_4 client_5 client_6 client_7 client_8 client_9 client_10
Please fill in Business Email for Quick Response

1 Executive Summary

1.1. Market Attractiveness Analysis

1.1.1. Global Directed Energy Weapon Market, By Type

1.1.2. Global Directed Energy Weapon Market, By Technology

1.1.3. Global Directed Energy Weapon Market, By Application

1.1.4. Global Directed Energy Weapon Market, By Platform

1.1.5. Global Directed Energy Weapon Market, By Region

2 Market Introduction

2.1. Market Definition

2.2. Scope Of The Study

2.3. Market Structure

2.4. Key Buying Criteria

2.5. Market Factor Indicator Analysis

3 Research Methodology

3.1. Research Process

3.2. Primary Research

3.3. Secondary Research

3.4. Market Size Estimation

3.5. Forecast Model

3.6. List Of Assumptions

4 Market Insights

5 Market Dynamics

5.1. Introduction

5.2. Drivers

5.2.1. Increase In Military Spending

5.2.2. Rising Terrorist Attacks And Focus On Counter Operations

5.2.3. Drivers Impact Analysis

5.3. Restraints

5.4. Opportunities

5.4.1. Changing Nature Of Warfare

5.4.2. Use Of Technologically Advanced Equipment By Military Forces

5.5. Market/Technological Trends

5.5.1. High Energy Laser Weapons

5.5.2. Electromagnetic Weapons

5.6. Patent Trends

5.7. Regulatory Landscape/Standards

6 Market Factor Analysis

6.1. Value Chain/Supply Chain Analysis

6.1.1. R&D

6.1.2. Manufacturing

6.1.3. Distribution & Sales

6.1.4. Post-Sales Monitoring

6.2. Porter’s Five Forces Analysis

6.2.1. Threat Of New Entrants

6.2.2. Bargaining Power Of Buyers

6.2.3. Threat Of Substitutes

6.2.4. Segment Rivalry

6.2.5. Bargaining Power Of Supplies

7 Global Directed Energy Weapon Market, By Type

7.1. Introduction

7.2. Lethal Weapon

7.2.1. Market Estimates & Forecast, 2023-2032

7.2.2. Market Estimates & Forecast, By Region, 2023-2032

7.3. Non-Lethal Weapon

7.3.1. Market Estimates & Forecast, 2023-2032

7.3.2. Market Estimates & Forecast, By Region, 2023-2032

8 Global Directed Energy Weapon Market, By Technology

8.1. Introduction

8.2. High Energy Laser Technology

8.2.1. Market Estimates & Forecast, 2023-2032

8.2.2. Market Estimates & Forecast, By Region, 2023-2032

8.3. High Power Microwave Technology

8.3.1. Market Estimates & Forecast, 2023-2032

8.3.2. Market Estimates & Forecast, By Region, 2023-2032

8.4. Particle Beam Weapons

8.4.1. Market Estimates & Forecast, 2023-2032

8.4.2. Market Estimates & Forecast, By Region, 2023-2032

9 Global Directed Energy Weapon Market, By Application

9.1. Introduction

9.2. Military

9.2.1. Market Estimates & Forecast, 2023-2032

9.2.2. Market Estimates & Forecast, By Region, 2023-2032

9.3. Homeland Security

9.3.1. Market Estimates & Forecast, 2023-2032

9.3.2. Market Estimates & Forecast, By Region, 2023-2032

10 Global Directed Energy Weapon Market, By Platform

10.1. Introduction

10.2. Airborne

10.2.1. Market Estimates & Forecast, 2023-2032

10.2.2. Market Estimates & Forecast, By Region, 2023-2032

10.3. Ground-Based

10.3.1. Market Estimates & Forecast, 2023-2032

10.3.2. Market Estimates & Forecast, By Region, 2023-2032

10.4. Naval

10.4.1. Market Estimates & Forecast, 2023-2032

10.4.2. Market Estimates & Forecast, By Region, 2023-2032

11 Global Directed Energy Weapon Market, By Region

11.1. Introduction

11.2. North America

11.2.1. Market Estimates & Forecast, By Country, 2023-2032

11.2.2. Market Estimates & Forecast, By Type, 2023-2032

11.2.3. Market Estimates & Forecast, By Technology, 2023-2032

11.2.4. Market Estimates & Forecast, By Application, 2023-2032

11.2.5. Market Estimates & Forecast, By Platform, 2023-2032

11.2.6. US

11.2.6.1. Market Estimates & Forecast, By Type, 2023-2032

11.2.6.2. Market Estimates & Forecast, By Technology, 2023-2032

11.2.6.3. Market Estimates & Forecast, By Application, 2023-2032

11.2.6.4. Market Estimates & Forecast, By Platform, 2023-2032

11.2.7. Canada

11.2.7.1. Market Estimates & Forecast, By Type, 2023-2032

11.2.7.2. Market Estimates & Forecast, By Technology, 2023-2032

11.2.7.3. Market Estimates & Forecast, By Application, 2023-2032

11.2.7.4. Market Estimates & Forecast, By Platform, 2023-2032

11.3. Europe

11.3.1. Market Estimates & Forecast, By Country, 2023-2032

11.3.2. Market Estimates & Forecast, By Type, 2023-2032

11.3.3. Market Estimates & Forecast, By Technology, 2023-2032

11.3.4. Market Estimates & Forecast, By Application, 2023-2032

11.3.5. Market Estimates & Forecast, By Platform, 2023-2032

11.3.6. UK

11.3.6.1. Market Estimates & Forecast, By Type, 2023-2032

11.3.6.2. Market Estimates & Forecast, By Technology, 2023-2032

11.3.6.3. Market Estimates & Forecast, By Application, 2023-2032

11.3.6.4. Market Estimates & Forecast, By Platform, 2023-2032

11.3.7. Germany

11.3.7.1. Market Estimates & Forecast, By Type, 2023-2032

11.3.7.2. Market Estimates & Forecast, By Technology, 2023-2032

11.3.7.3. Market Estimates & Forecast, By Application, 2023-2032

11.3.7.4. Market Estimates & Forecast, By Platform, 2023-2032

11.3.8. France

11.3.8.1. Market Estimates & Forecast, By Type, 2023-2032

11.3.8.2. Market Estimates & Forecast, By Technology, 2023-2032

11.3.8.3. Market Estimates & Forecast, By Application, 2023-2032

11.3.8.4. Market Estimates & Forecast, By Platform, 2023-2032

11.3.9. Italy

11.3.9.1. Market Estimates & Forecast, By Type, 2023-2032

11.3.9.2. Market Estimates & Forecast, By Technology, 2023-2032

11.3.9.3. Market Estimates & Forecast, By Application, 2023-2032

11.3.9.4. Market Estimates & Forecast, By Platform, 2023-2032

11.3.10. Rest Of Europe

11.3.10.1. Market Estimates & Forecast, By Type, 2023-2032

11.3.10.2. Market Estimates & Forecast, By Technology, 2023-2032

11.3.10.3. Market Estimates & Forecast, By Application, 2023-2032

11.3.10.4. Market Estimates & Forecast, By Platform, 2023-2032

11.4. Asia-Pacific

11.4.1. Market Estimates & Forecast, By Country, 2023-2032

11.4.2. Market Estimates & Forecast, By Type, 2023-2032

11.4.3. Market Estimates & Forecast, By Technology, 2023-2032

11.4.4. Market Estimates & Forecast, By Application, 2023-2032

11.4.5. Market Estimates & Forecast, By Platform, 2023-2032

11.4.6. China

11.4.6.1. Market Estimates & Forecast, By Type, 2023-2032

11.4.6.2. Market Estimates & Forecast, By Technology, 2023-2032

11.4.6.3. Market Estimates & Forecast, By Application, 2023-2032

11.4.6.4. Market Estimates & Forecast, By Platform, 2023-2032

11.4.7. Japan

11.4.7.1. Market Estimates & Forecast, By Type, 2023-2032

11.4.7.2. Market Estimates & Forecast, By Technology, 2023-2032

11.4.7.3. Market Estimates & Forecast, By Application, 2023-2032

11.4.7.4. Market Estimates & Forecast, By Platform, 2023-2032

11.4.8. India

11.4.8.1. Market Estimates & Forecast, By Type, 2023-2032

11.4.8.2. Market Estimates & Forecast, By Technology, 2023-2032

11.4.8.3. Market Estimates & Forecast, By Application, 2023-2032

11.4.8.4. Market Estimates & Forecast, By Platform, 2023-2032

11.4.9. Australia

11.4.9.1. Market Estimates & Forecast, By Type, 2023-2032

11.4.9.2. Market Estimates & Forecast, By Technology, 2023-2032

11.4.9.3. Market Estimates & Forecast, By Application, 2023-2032

11.4.9.4. Market Estimates & Forecast, By Platform, 2023-2032

11.4.10. Rest Of Asia-Pacific

11.4.10.1. Market Estimates & Forecast, By Type, 2023-2032

11.4.10.2. Market Estimates & Forecast, By Technology, 2023-2032

11.4.10.3. Market Estimates & Forecast, By Application, 2023-2032

11.4.10.4. Market Estimates & Forecast, By Platform, 2023-2032

11.5. Middle East & Africa

11.5.1. Market Estimates & Forecast, By Country, 2023-2032

11.5.2. Market Estimates & Forecast, By Type, 2023-2032

11.5.3. Market Estimates & Forecast, By Technology, 2023-2032

11.5.4. Market Estimates & Forecast, By Application, 2023-2032

11.5.5. Market Estimates & Forecast, By Platform, 2023-2032

11.5.6. Saudi Arabia

11.5.6.1. Market Estimates & Forecast, By Type, 2023-2032

11.5.6.2. Market Estimates & Forecast, By Technology, 2023-2032

11.5.6.3. Market Estimates & Forecast, By Application, 2023-2032

11.5.6.4. Market Estimates & Forecast, By Platform, 2023-2032

11.5.7. UAE

11.5.7.1. Market Estimates & Forecast, By Type, 2023-2032

11.5.7.2. Market Estimates & Forecast, By Technology, 2023-2032

11.5.7.3. Market Estimates & Forecast, By Application, 2023-2032

11.5.7.4. Market Estimates & Forecast, By Platform, 2023-2032

11.5.8. Rest Of Middle East & Africa

11.5.8.1. Market Estimates & Forecast, By Type, 2023-2032

11.5.8.2. Market Estimates & Forecast, By Technology, 2023-2032

11.5.8.3. Market Estimates & Forecast, By Application, 2023-2032

11.5.8.4. Market Estimates & Forecast, By Platform, 2023-2032

11.6. Latin America

11.6.1. Market Estimates & Forecast, By Country, 2023-2032

11.6.2. Market Estimates & Forecast, By Type, 2023-2032

11.6.3. Market Estimates & Forecast, By Technology, 2023-2032

11.6.4. Market Estimates & Forecast, By Application, 2023-2032

11.6.5. Market Estimates & Forecast, By Platform, 2023-2032

11.6.6. Brazil

11.6.6.1. Market Estimates & Forecast, By Type, 2023-2032

11.6.6.2. Market Estimates & Forecast, By Technology, 2023-2032

11.6.6.3. Market Estimates & Forecast, By Application, 2023-2032

11.6.6.4. Market Estimates & Forecast, By Platform, 2023-2032

11.6.7. Rest Of Latin America

11.6.7.1. Market Estimates & Forecast, By Type, 2023-2032

11.6.7.2. Market Estimates & Forecast, By Technology, 2023-2032

11.6.7.3. Market Estimates & Forecast, By Application, 2023-2032

11.6.7.4. Market Estimates & Forecast, By Platform, 2023-2032

12 Competitive Landscape

12.1. Competitive Overview

12.2. Competitor Dashboard

12.3. Major Growth Strategy In The Global Directed Energy Weapon Market

12.4. Competitive Benchmarking

12.5. Market Share Analysis

12.6. Leading Player In Terms Of Number Of Developments In Global Directed Energy Weapon Market

12.7. Key Developments & Growth Strategies

12.7.1. New Product Launch/Service Deployment

12.7.2. Merger & Acquisition

12.7.3. Joint Ventures

13 Company Profiles

13.1. Key Market Players

13.1.1. BAE Systems PLC

13.1.1.1. Company Overview

13.1.1.2. Product Offering

13.1.1.3. Financial Overview

13.1.1.4. Key Developments

13.1.1.5. SWOT Analysis

13.1.1.6. Strategy

13.1.2. The Boeing Company

13.1.2.1. Company Overview

13.1.2.2. Product Offering

13.1.2.3. Financial Overview

13.1.2.4. Key Developments

13.1.2.5. SWOT Analysis

13.1.2.6. Strategy

13.1.3. L3Harris Technologies, Inc.

13.1.3.1. Company Overview

13.1.3.2. Product Offering

13.1.3.3. Financial Overview

13.1.3.4. Key Developments

13.1.3.5. SWOT Analysis

13.1.3.6. Strategy

13.1.4. Lockheed Martin Corporation

13.1.4.1. Company Overview

13.1.4.2. Product Offering

13.1.4.3. Financial Overview

13.1.4.4. Key Developments

13.1.4.5. SWOT Analysis

13.1.4.6. Strategy

13.1.5. Moog Inc.

13.1.5.1. Company Overview

13.1.5.2. Product Offering

13.1.5.3. Financial Overview

13.1.5.4. Key Developments

13.1.5.5. SWOT Analysis

13.1.5.6. Strategy

13.1.6. Northrop Grumman Corporation

13.1.6.1. Company Overview

13.1.6.2. Product Offering

13.1.6.3. Financial Overview

13.1.6.4. Key Developments

13.1.6.5. SWOT Analysis

13.1.6.6. Strategy

13.1.7. Quinetiq Group PLC

13.1.7.1. Company Overview

13.1.7.2. Product Offering

13.1.7.3. Financial Overview

13.1.7.4. Key Developments

13.1.7.5. SWOT Analysis

13.1.7.6. Strategy

13.1.8. Raytheon Company

13.1.8.1. Company Overview

13.1.8.2. Product Offering

13.1.8.3. Financial Overview

13.1.8.4. Key Developments

13.1.8.5. SWOT Analysis

13.1.8.6. Strategy

13.1.9. Rheinmetall AG

13.1.9.1. Company Overview

13.1.9.2. Product Offering

13.1.9.3. Financial Overview

13.1.9.4. Key Developments

13.1.9.5. SWOT Analysis

13.1.9.6. Strategy

13.1.10. Textron Inc.

13.1.10.1. Company Overview

13.1.10.2. Product Offering

13.1.10.3. Financial Overview

13.1.10.4. Key Developments

13.1.10.5. SWOT Analysis

13.1.10.6. Strategy

14 Appendix

14.1. References

14.2. Related Reports

14.3. List Of Abbreviation

15 List Of Tables

TABLE 1 LIST OF ASSUMPTIONS

TABLE 2 MAJOR PATENTS GRANTED FOR DIRECTED ENERGY WEAPON (15 MAY 2010–15 MAY 2019)

TABLE 3 TYPE: GLOBAL DIRECTED ENERGY WEAPON MARKET, 2023-2032 (USD MILLION)

TABLE 4 TECHNOLOGY: GLOBAL DIRECTED ENERGY WEAPON MARKET, 2023-2032 (USD MILLION)

TABLE 5 APPLICATION: GLOBAL DIRECTED ENERGY WEAPON MARKET, 2023-2032 (USD MILLION)

TABLE 6 PLATFORM: GLOBAL DIRECTED ENERGY WEAPON MARKET, 2023-2032 (USD MILLION)

TABLE 7 GLOBAL DIRECTED ENERGY WEAPON MARKET, BY REGION, 2023-2032 (USD MILLION)

TABLE 8 NORTH AMERICA: DIRECTED ENERGY WEAPON MARKET, BY COUNTRY, 2023-2032 (USD MILLION)

TABLE 9 NORTH AMERICA: DIRECTED ENERGY WEAPON MARKET, BY TYPE, 2023-2032 (USD MILLION)

TABLE 10 NORTH AMERICA: DIRECTED ENERGY WEAPON MARKET, BY TECHNOLOGY, 2023-2032 (USD MILLION)

TABLE 11 NORTH AMERICA: DIRECTED ENERGY WEAPON MARKET, BY APPLICATION, 2023-2032 (USD MILLION)

TABLE 12 NORTH AMERICA: DIRECTED ENERGY WEAPON MARKET, BY PLATFORM, 2023-2032 (USD MILLION)

TABLE 13 US: DIRECTED ENERGY WEAPON MARKET, BY TYPE, 2023-2032 (USD MILLION)

TABLE 14 US: DIRECTED ENERGY WEAPON MARKET, BY TECHNOLOGY, 2023-2032 (USD MILLION)

TABLE 15 US: DIRECTED ENERGY WEAPON MARKET, BY APPLICATION, 2023-2032 (USD MILLION)

TABLE 16 US: DIRECTED ENERGY WEAPON MARKET, BY PLATFORM, 2023-2032 (USD MILLION)

TABLE 17 CANADA: DIRECTED ENERGY WEAPON MARKET, BY TYPE, 2023-2032 (USD MILLION)

TABLE 18 CANADA: DIRECTED ENERGY WEAPON MARKET, BY TECHNOLOGY, 2023-2032 (USD MILLION)

TABLE 19 CANADA: DIRECTED ENERGY WEAPON MARKET, BY APPLICATION, 2023-2032 (USD MILLION)

TABLE 20 CANADA: DIRECTED ENERGY WEAPON MARKET, BY PLATFORM, 2023-2032 (USD MILLION)

TABLE 21 EUROPE: DIRECTED ENERGY WEAPON MARKET, BY COUNTRY, 2023-2032 (USD MILLION)

TABLE 22 EUROPE: DIRECTED ENERGY WEAPON MARKET, BY TYPE, 2023-2032 (USD MILLION)

TABLE 23 EUROPE: DIRECTED ENERGY WEAPON MARKET, BY TECHNOLOGY, 2023-2032 (USD MILLION)

TABLE 24 EUROPE: DIRECTED ENERGY WEAPON MARKET, BY APPLICATION, 2023-2032 (USD MILLION)

TABLE 25 EUROPE: DIRECTED ENERGY WEAPON MARKET, BY PLATFORM, 2023-2032 (USD MILLION)

TABLE 26 UK: DIRECTED ENERGY WEAPON MARKET, BY TYPE, 2023-2032 (USD MILLION)

TABLE 27 UK: DIRECTED ENERGY WEAPON MARKET, BY TECHNOLOGY, 2023-2032 (USD MILLION)

TABLE 28 UK: DIRECTED ENERGY WEAPON MARKET, BY APPLICATION, 2023-2032 (USD MILLION)

TABLE 29 UK: DIRECTED ENERGY WEAPON MARKET, BY PLATFORM, 2023-2032 (USD MILLION)

TABLE 30 GERMANY: DIRECTED ENERGY WEAPON MARKET, BY TYPE, 2023-2032 (USD MILLION)

TABLE 31 GERMANY: DIRECTED ENERGY WEAPON MARKET, BY TECHNOLOGY, 2023-2032 (USD MILLION)

TABLE 32 GERMANY: DIRECTED ENERGY WEAPON MARKET, BY APPLICATION, 2023-2032 (USD MILLION)

TABLE 33 GERMANY: DIRECTED ENERGY WEAPON MARKET, BY PLATFORM, 2023-2032 (USD MILLION)

TABLE 34 FRANCE: DIRECTED ENERGY WEAPON MARKET, BY TYPE, 2023-2032 (USD MILLION)

TABLE 35 FRANCE: DIRECTED ENERGY WEAPON MARKET, BY TECHNOLOGY, 2023-2032 (USD MILLION)

TABLE 36 FRANCE: DIRECTED ENERGY WEAPON MARKET, BY APPLICATION, 2023-2032 (USD MILLION)

TABLE 37 FRANCE: DIRECTED ENERGY WEAPON MARKET, BY PLATFORM, 2023-2032 (USD MILLION)

TABLE 38 ITALY: DIRECTED ENERGY WEAPON MARKET, BY TYPE, 2023-2032 (USD MILLION)

TABLE 39 ITALY: DIRECTED ENERGY WEAPON MARKET, BY TECHNOLOGY, 2023-2032 (USD MILLION)

TABLE 40 ITALY: DIRECTED ENERGY WEAPON MARKET, BY APPLICATION, 2023-2032 (USD MILLION)

TABLE 41 ITALY: DIRECTED ENERGY WEAPON MARKET, BY PLATFORM, 2023-2032 (USD MILLION)

TABLE 42 REST OF EUROPE: DIRECTED ENERGY WEAPON MARKET, BY TYPE, 2023-2032 (USD MILLION)

TABLE 43 REST OF EUROPE: DIRECTED ENERGY WEAPON MARKET, BY TECHNOLOGY, 2023-2032 (USD MILLION)

TABLE 44 REST OF EUROPE: DIRECTED ENERGY WEAPON MARKET, BY APPLICATION, 2023-2032 (USD MILLION)

TABLE 45 REST OF EUROPE: DIRECTED ENERGY WEAPON MARKET, BY PLATFORM, 2023-2032 (USD MILLION)

TABLE 46 ASIA-PACIFIC: DIRECTED ENERGY WEAPON MARKET, BY COUNTRY, 2023-2032 (USD MILLION)

TABLE 47 ASIA-PACIFIC: DIRECTED ENERGY WEAPON MARKET, BY TYPE, 2023-2032 (USD MILLION)

TABLE 48 ASIA-PACIFIC: DIRECTED ENERGY WEAPON MARKET, BY TECHNOLOGY, 2023-2032 (USD MILLION)

TABLE 49 ASIA-PACIFIC: DIRECTED ENERGY WEAPON MARKET, BY APPLICATION, 2023-2032 (USD MILLION)

TABLE 50 ASIA-PACIFIC: DIRECTED ENERGY WEAPON MARKET, BY PLATFORM, 2023-2032 (USD MILLION)

TABLE 51 CHINA: DIRECTED ENERGY WEAPON MARKET, BY TYPE, 2023-2032 (USD MILLION)

TABLE 52 CHINA: DIRECTED ENERGY WEAPON MARKET, BY TECHNOLOGY, 2023-2032 (USD MILLION)

TABLE 53 CHINA: DIRECTED ENERGY WEAPON MARKET, BY APPLICATION, 2023-2032 (USD MILLION)

TABLE 54 CHINA: DIRECTED ENERGY WEAPON MARKET, BY PLATFORM, 2023-2032 (USD MILLION)

TABLE 55 INDIA: DIRECTED ENERGY WEAPON MARKET, BY TYPE, 2023-2032 (USD MILLION)

TABLE 56 INDIA: DIRECTED ENERGY WEAPON MARKET, BY TECHNOLOGY, 2023-2032 (USD MILLION)

TABLE 57 INDIA: DIRECTED ENERGY WEAPON MARKET, BY APPLICATION, 2023-2032 (USD MILLION)

TABLE 58 INDIA: DIRECTED ENERGY WEAPON MARKET, BY PLATFORM, 2023-2032 (USD MILLION)

TABLE 59 JAPAN: DIRECTED ENERGY WEAPON MARKET, BY TYPE, 2023-2032 (USD MILLION)

TABLE 60 JAPAN: DIRECTED ENERGY WEAPON MARKET, BY TECHNOLOGY, 2023-2032 (USD MILLION)

TABLE 61 JAPAN: DIRECTED ENERGY WEAPON MARKET, BY APPLICATION, 2023-2032 (USD MILLION)

TABLE 62 JAPAN: DIRECTED ENERGY WEAPON MARKET, BY PLATFORM, 2023-2032 (USD MILLION)

TABLE 63 AUSTRALIA: DIRECTED ENERGY WEAPON MARKET, BY TYPE, 2023-2032 (USD MILLION)

TABLE 64 AUSTRALIA: DIRECTED ENERGY WEAPON MARKET, BY TECHNOLOGY, 2023-2032 (USD MILLION)

TABLE 65 AUSTRALIA: DIRECTED ENERGY WEAPON MARKET, BY APPLICATION, 2023-2032 (USD MILLION)

TABLE 66 AUSTRALIA: DIRECTED ENERGY WEAPON MARKET, BY PLATFORM, 2023-2032 (USD MILLION)

TABLE 67 REST OF ASIA-PACIFIC: DIRECTED ENERGY WEAPON MARKET, BY TYPE, 2023-2032 (USD MILLION)

TABLE 68 REST OF ASIA-PACIFIC: DIRECTED ENERGY WEAPON MARKET, BY TECHNOLOGY, 2023-2032 (USD MILLION)

TABLE 69 REST OF ASIA-PACIFIC: DIRECTED ENERGY WEAPON MARKET, BY APPLICATION, 2023-2032 (USD MILLION)

TABLE 70 REST OF ASIA-PACIFIC: DIRECTED ENERGY WEAPON MARKET, BY PLATFORM, 2023-2032 (USD MILLION)

TABLE 71 MIDDLE EAST & AFRICA: DIRECTED ENERGY WEAPON MARKET, BY COUNTRY, 2023-2032 (USD MILLION)

TABLE 72 MIDDLE EAST & AFRICA: DIRECTED ENERGY WEAPON MARKET, BY TYPE, 2023-2032 (USD MILLION)

TABLE 73 MIDDLE EAST & AFRICA: DIRECTED ENERGY WEAPON MARKET, BY TECHNOLOGY, 2023-2032 (USD MILLION)

TABLE 74 MIDDLE EAST & AFRICA: DIRECTED ENERGY WEAPON MARKET, BY APPLICATION, 2023-2032 (USD MILLION)

TABLE 75 MIDDLE EAST & AFRICA: DIRECTED ENERGY WEAPON MARKET, BY PLATFORM, 2023-2032 (USD MILLION)

TABLE 76 SAUDI ARABIA: DIRECTED ENERGY WEAPON MARKET, BY TYPE, 2023-2032 (USD MILLION)

TABLE 77 SAUDI ARABIA: DIRECTED ENERGY WEAPON MARKET, BY TECHNOLOGY, 2023-2032 (USD MILLION)

TABLE 78 SAUDI ARABIA: DIRECTED ENERGY WEAPON MARKET, BY APPLICATION, 2023-2032 (USD MILLION)

TABLE 79 SAUDI ARABIA: DIRECTED ENERGY WEAPON MARKET, BY PLATFORM, 2023-2032 (USD MILLION)

TABLE 80 UAE: DIRECTED ENERGY WEAPON MARKET, BY TYPE, 2023-2032 (USD MILLION)

TABLE 81 UAE: DIRECTED ENERGY WEAPON MARKET, BY TECHNOLOGY, 2023-2032 (USD MILLION)

TABLE 82 UAE: DIRECTED ENERGY WEAPON MARKET, BY APPLICATION, 2023-2032 (USD MILLION)

TABLE 83 UAE: DIRECTED ENERGY WEAPON MARKET, BY PLATFORM, 2023-2032 (USD MILLION)

TABLE 84 REST OF THE MIDDLE EAST & AFRICA: DIRECTED ENERGY WEAPON MARKET, BY TYPE, 2023-2032 (USD MILLION)

TABLE 85 REST OF THE MIDDLE EAST & AFRICA: DIRECTED ENERGY WEAPON MARKET, BY TECHNOLOGY, 2023-2032 (USD MILLION)

TABLE 86 REST OF THE MIDDLE EAST & AFRICA: DIRECTED ENERGY WEAPON MARKET, BY APPLICATION, 2023-2032 (USD MILLION)

TABLE 87 REST OF THE MIDDLE EAST & AFRICA: DIRECTED ENERGY WEAPON MARKET, BY PLATFORM, 2023-2032 (USD MILLION)

TABLE 88 LATIN AMERICA: DIRECTED ENERGY WEAPON MARKET, BY COUNTRY, 2023-2032 (USD MILLION)

TABLE 89 LATIN AMERICA: DIRECTED ENERGY WEAPON MARKET, BY TYPE, 2023-2032 (USD MILLION)

TABLE 90 LATIN AMERICA: DIRECTED ENERGY WEAPON MARKET, BY TECHNOLOGY, 2023-2032 (USD MILLION)

TABLE 91 LATIN AMERICA: DIRECTED ENERGY WEAPON MARKET, BY APPLICATION, 2023-2032 (USD MILLION)

TABLE 92 LATIN AMERICA: DIRECTED ENERGY WEAPON MARKET, BY PLATFORM, 2023-2032 (USD MILLION)

TABLE 93 BRAZIL: DIRECTED ENERGY WEAPON MARKET, BY TYPE, 2023-2032 (USD MILLION)

TABLE 94 BRAZIL: DIRECTED ENERGY WEAPON MARKET, BY TECHNOLOGY, 2023-2032 (USD MILLION)

TABLE 95 BRAZIL: DIRECTED ENERGY WEAPON MARKET, BY APPLICATION, 2023-2032 (USD MILLION)

TABLE 96 BRAZIL: DIRECTED ENERGY WEAPON MARKET, BY PLATFORM, 2023-2032 (USD MILLION)

TABLE 97 REST OF LATIN AMERICA: DIRECTED ENERGY WEAPON MARKET, BY TYPE, 2023-2032 (USD MILLION)

TABLE 98 REST OF LATIN AMERICA: DIRECTED ENERGY WEAPON MARKET, BY TECHNOLOGY, 2023-2032 (USD MILLION)

TABLE 99 REST OF LATIN AMERICA: DIRECTED ENERGY WEAPON MARKET, BY APPLICATION, 2023-2032 (USD MILLION)

TABLE 100 REST OF LATIN AMERICA: DIRECTED ENERGY WEAPON MARKET, BY PLATFORM, 2023-2032 (USD MILLION)

TABLE 101 THE MOST ACTIVE PLAYERS IN THE GLOBAL DIRECTED ENERGY WEAPON MARKET

TABLE 102 CONTRACTS AND AGREEMENTS

TABLE 103 MERGERS & ACQUISITIONS

TABLE 104 PRODUCT DEVELOPMENT

TABLE 105 EXPANSIONS AND INVESTMENTS

TABLE 106 JOINT VENTURES & PARTNERSHIPS

16 List Of Figures

FIGURE 1 MARKET SYNOPSIS

FIGURE 2 GLOBAL DIRECTED ENERGY WEAPON MARKET: MARKET ATTRACTIVENESS ANALYSIS

FIGURE 3 GLOBAL DIRECTED ENERGY WEAPON MARKET ANALYSIS, BY TYPE

FIGURE 4 GLOBAL DIRECTED ENERGY WEAPON MARKET ANALYSIS, BY COMPONENT

FIGURE 5 GLOBAL DIRECTED ENERGY WEAPON MARKET ANALYSIS, BY APPLICATION

FIGURE 5 GLOBAL DIRECTED ENERGY WEAPON MARKET ANALYSIS, BY PLATFORM

FIGURE 6 GLOBAL DIRECTED ENERGY WEAPON MARKET ANALYSIS, BY REGION

FIGURE 7 GLOBAL DIRECTED ENERGY WEAPON MARKET: MARKET STRUCTURE

FIGURE 8 KEY BUYING CRITERIA FOR DIRECTED ENERGY WEAPON TYPES

FIGURE 9 RESEARCH PROCESS OF MRFR

FIGURE 10 NORTH AMERICA: MARKET SIZE & MARKET SHARE, BY COUNTRY, 2023-2032

FIGURE 11 EUROPE: MARKET SIZE & MARKET SHARE, BY COUNTRY, 2023-2032

FIGURE 12 ASIA-PACIFIC: MARKET SIZE & MARKET SHARE, BY COUNTRY, 2023-2032

FIGURE 13 MIDDLE EAST & AFRICA: MARKET SIZE & MARKET SHARE, BY COUNTRY, 2023-2032

FIGURE 14 LATIN AMERICA: MARKET SIZE & MARKET SHARE, BY REGION, 2023-2032

FIGURE 15 MARKET DYNAMICS OVERVIEW

FIGURE 16 GROWTH IN INTERNATIONAL SEABORNE TRADE (1970–2017)

FIGURE 17 WORLD SEABORNE TRADE, BY REGION, 2017

FIGURE 18 DRIVERS IMPACT ANALYSIS: GLOBAL DIRECTED ENERGY WEAPON MARKET

FIGURE 19 RESTRAINTS IMPACT ANALYSIS: GLOBAL DIRECTED ENERGY WEAPON MARKET

FIGURE 20 GLOBAL OCEAN CRUISE PASSENGERS (IN MILLIONS) 2009–2023

FIGURE 21 PORTER’S FIVE FORCES ANALYSIS OF THE GLOBAL DIRECTED ENERGY WEAPON MARKET

FIGURE 22 SUPPLY CHAIN: GLOBAL DIRECTED ENERGY WEAPON MARKET

FIGURE 23 GLOBAL DIRECTED ENERGY WEAPON MARKET SHARE, BY TYPE, 2023 (% SHARE)

FIGURE 24 GLOBAL DIRECTED ENERGY WEAPON MARKET SHARE, BY COMPONENT, 2023 (% SHARE)

FIGURE 25 GLOBAL DIRECTED ENERGY WEAPON MARKET SHARE, BY APPLICATION, 2023 (% SHARE)

FIGURE 26 GLOBAL DIRECTED ENERGY WEAPON MARKET SHARE, BY REGION, 2023 (% SHARE)

FIGURE 27 NORTH AMERICA: DIRECTED ENERGY WEAPON MARKET SHARE, BY COUNTRY, 2023 (% SHARE)

FIGURE 28 EUROPE: DIRECTED ENERGY WEAPON MARKET SHARE, BY COUNTRY, 2023 (% SHARE)

FIGURE 29 ASIA-PACIFIC: DIRECTED ENERGY WEAPON MARKET SHARE, BY COUNTRY, 2023 (% SHARE)

FIGURE 30 MIDDLE EAST & AFRICA: DIRECTED ENERGY WEAPON MARKET SHARE, BY COUNTRY, 2023 (% SHARE)

FIGURE 31 LATIN AMERICA: DIRECTED ENERGY WEAPON MARKET SHARE, BY COUNTRY, 2023 (% SHARE)

FIGURE 32 COMPETITOR DASHBOARD: GLOBAL DIRECTED ENERGY WEAPON MARKET

FIGURE 33 CAPITAL MARKET RATIO AND FINANCIAL MATRIX

FIGURE 34 CONTRACTS & AGREEMENTS: THE MAJOR STRATEGY ADOPTED BY KEY PLAYERS IN THE GLOBAL DIRECTED ENERGY WEAPON MARKET

FIGURE 35 BENCHMARKING OF MAJOR COMPETITORS

FIGURE 36 MAJOR MANUFACTURERS MARKET SHARE ANALYSIS, 2023

Purchase Option
Single User $ 4,950
Multiuser License $ 5,950
Enterprise User $ 7,250
Compare Licenses
Tailored for You
  • Dedicated Research on any specifics segment or region.
  • Focused Research on specific players in the market.
  • Custom Report based only on your requirements.
  • Flexibility to add or subtract any chapter in the study.
  • Historic data from 2014 and forecasts outlook till 2040.
  • Flexibility of providing data/insights in formats (PDF, PPT, Excel).
  • Provide cross segmentation in applicable scenario/markets.