Digital Wound Measurement Devices Market Segmentation
Digital Wound Measurement Devices Market By Digital Wound Measurement Devices Market (USD Billion, 2025-2035)
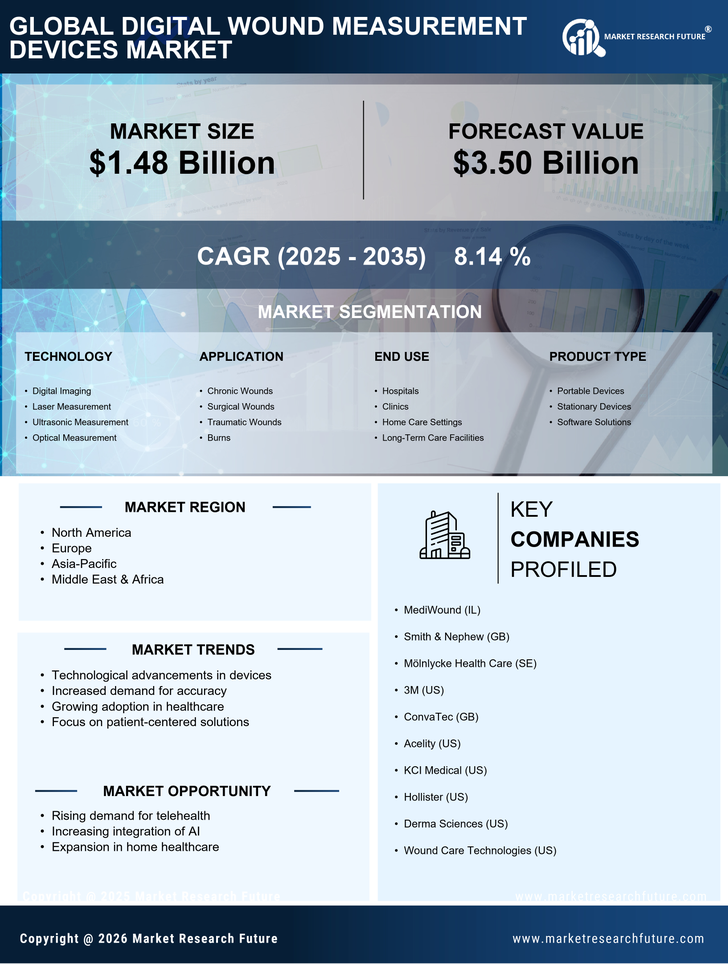
- Digital Imaging
- Laser Measurement
- Ultrasonic Measurement
- Optical Measurement
Digital Wound Measurement Devices Market By Application (USD Billion, 2025-2035)
- Chronic Wounds
- Surgical Wounds
- Traumatic Wounds
- Burns
Digital Wound Measurement Devices Market By End Use (USD Billion, 2025-2035)
- Hospitals
- Clinics
- Home Care Settings
- Long-Term Care Facilities
Digital Wound Measurement Devices Market By Product Type (USD Billion, 2025-2035)
- Portable Devices
- Stationary Devices
- Software Solutions