Segmentation Quick Reference
| Dimension | Sub-Segments | Dominant Segment | Fastest Growing Segment |
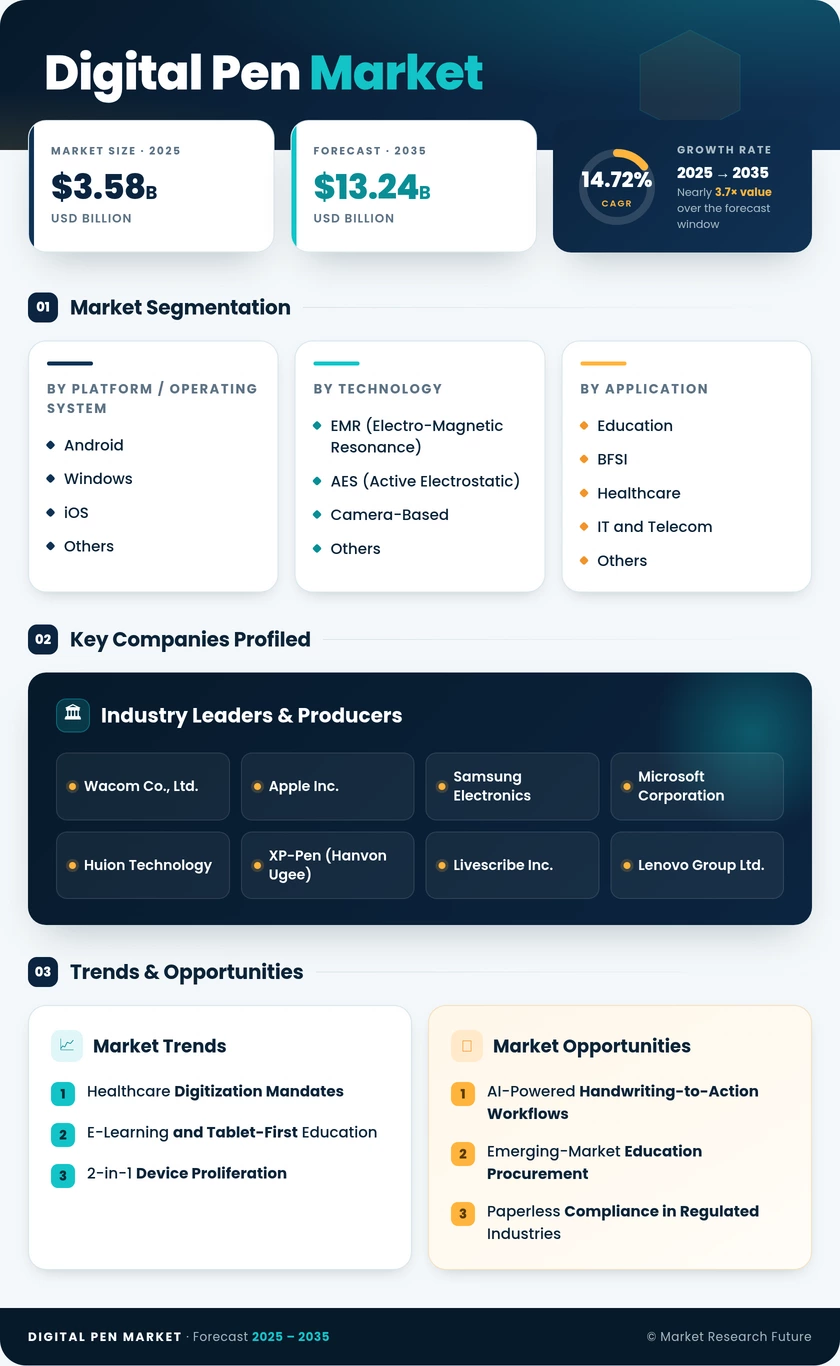
| Platform / Operating System | Android, Windows, iOS, Others | Android (33.72% share, 2025) | iOS (15.42% CAGR) |
| Technology | EMR, AES, Camera-Based, Others | EMR (38.41% share, 2025) | AES (16.82% CAGR) |
| Application | Note-Taking & Education, Digital Art & Design, Clinical & Medical Records, Others | Note-Taking & Education (40.12% share, 2025) | Digital Art & Design (14.95% CAGR) |
| End-User Industry | Education, BFSI, Healthcare, IT & Telecom, Others | Education (28.74% share, 2025) | Healthcare (13.12% CAGR) |
Market Segmentation Overview
By Platform / Operating System
| Sub-Segment | Key Trend |
| Android | Samsung S Pen ecosystem expansion; Chromebook stylus bundling in education |
| Windows | Enterprise 2-in-1 fleet refresh; Surface and Lenovo Yoga pen-ready deployments |
| iOS | Apple Pencil Pro with haptic feedback; Procreate and creative-app ecosystem growth |
| Others | Chrome OS and Linux niche; emerging RISC-V tablet experiments |
Android continues to anchor volume demand through affordable tablet-pen bundles, while iOS captures disproportionate revenue share per unit due to premium creative-professional positioning. Windows remains the enterprise backbone, and niche OS platforms serve specialized industrial and research applications.
By Technology
| Sub-Segment | Key Trend |
| EMR (Electro-Magnetic Resonance) | Battery-free operation; Wacom OEM dominance; recyclability advantage |
| AES (Active Electrostatic) | Thin-device compatibility; smartphone pen integration; rapid CAGR |
| Camera-Based | Smartpen audio-sync capture for legal and field verticals |
| Others | Infrared and ultrasonic sensors for interactive whiteboard applications |
EMR technology leads in reliability and environmental credentials, while AES is the primary growth vector as mobile-device manufacturers seek lower-cost, thinner pen-input solutions. Camera-based smartpens retain a loyal niche in note-capture workflows requiring synchronized audio recording.
By Application
| Sub-Segment | Key Trend |
| Note-Taking and Education | Government-funded tablet-pen procurement; 1:1 student-device mandates |
| Digital Art and Design | Procreate, Clip Studio Paint, and Adobe Fresco driving premium pen demand |
| Clinical and Medical Records | EHR interoperability; handwriting-native clinical documentation |
| Others (BFSI, Legal, Field Services) | Digital-signature compliance; insurance claims digitization |
Note-taking and education represent the volume engine, while clinical and medical records offer the highest per-unit value and strongest regulatory demand pull. Digital art and design is the fastest-growing application by CAGR, fueled by the creator-economy expansion and professional illustration tools.
By End-User Industry
| Sub-Segment | Key Trend |
| Education | Multi-year government procurement contracts; stylus-as-standard in classrooms |
| BFSI | Branch paperless transformation; biometric digital-signature adoption |
| Healthcare | HIPAA compliance; telehealth annotation; clinical workflow digitization |
| IT and Telecom | UX prototyping; developer annotation; product-design collaboration |
| Others | Government e-services, legal documentation, manufacturing quality inspection |
Education's share reflects institutional scale, but healthcare's CAGR outpaces all other verticals due to non-discretionary regulatory mandates. BFSI follows with strong ROI-driven adoption tied to branch-level paperless transformation initiatives.