Market Scenario
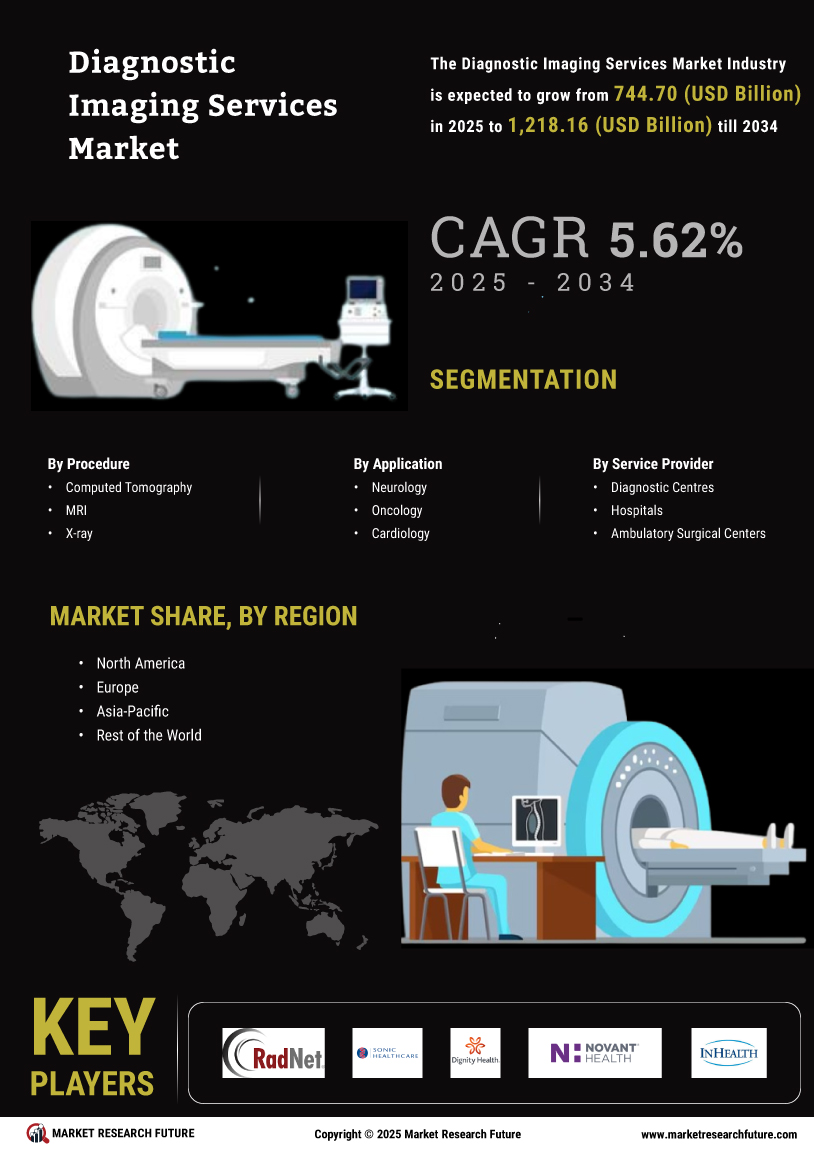
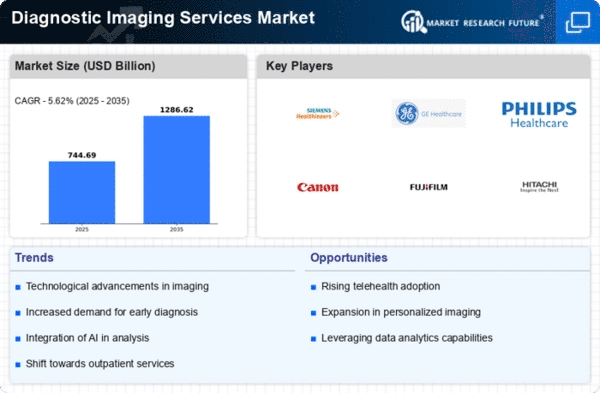
Global diagnostic imaging services market is expected to grow significantly and is projected to grow at a CAGR of 8.2% over the forecast period. The diagnostic imaging services have become foundation of modern medical diagnostics for the treatment of variety of acute and chronic diseases including cardiovascular diseases and cancer. Use of the diagnostic imaging services has increased the accuracy and precision of diagnosis tremendously in recent years. The factors such as increasing demand for diagnostic imaging devices, growing government investment and funding’s for research in modernization of imaging services, and the on-going technological advancements in imaging systems to improve healthcare infrastructure is anticipated to boost the growth of the market over the forecast period. Moreover, increasing prevalence of lifestyle related diseases with increasing age and increased healthcare expenditure are driving the growth of this market. According to the World Population Prospects by the United Nations, approximately 962 million older population aged 60 and above were present globally as of 2017. This represents about 13% of the global population. A study by the National Institutes of Health (NIH) in 2015 reported that, the utilization of imaging services among elderly patients (65 years and above) is at least twice as compared to that of younger population. Despite the drivers, the high cost of imaging devices with advanced technologies and insufficient reimbursement policies may hinder the market growth during the assessment period.
Segmentation
The Global diagnostic imaging services market has been segmented into procedure, application, and service provider.
By procedure, the market has been segmented into X-ray, Computed Tomography, Ultrasound, MRI (Magnetic Resonance Imaging), Nuclear Imaging, Radiography and others. The procedure segment is estimated to hold major market share in the global diagnostic imaging services market due to the rising R&D activities in the diagnostics field and better device functionality and efficiency.
On the basis of application, the market has been segmented into Neurology, Cardiology, Oncology, Musculoskeletal and others.
The market, by service provider, has been segmented into Clinics & Hospitals, Diagnostic centres, Research laboratories and others.
The global diagnostic imaging services market has been segmented, by region, into the Americas, Europe, Asia-Pacific, and the Middle East & Africa. The diagnostics imaging services market in the Americas has further been segmented into North America and Latin America, with the North American market divided into the US and Canada.
The European diagnostic imaging services market has been segmented into Western Europe and Eastern Europe. The Western Europe diagnostics imaging services market has further been classified as Germany, France, the UK, Italy, Spain, and the rest of Western Europe.
The diagnostics imaging services market in Asia-Pacific has been segmented into Japan, China, India, South Korea, Australia, and the rest of Asia-Pacific. The diagnostics imaging services market in the Middle East & Africa has been segmented into the Middle East and Africa.
Key players
Center for Diagnostic Imaging (CDI), Medquest Associates Inc./Novant Health, Simonmed/Dignity Health, Touchstone Imaging, Alliance Medical, Medica Group, Sonic Healthcare, Global Diagnostics, Consensys Imaging Service, Inc., Progressive Radiology, Concord Medical Services Holdings Limited, Alliance Healthcare Services, InHealth Group and others are some of the prominent players in the global diagnostic imaging services market.
Regional Market Summary
Global Diagnostic Imaging Services Systems Share (%), by Region, 2017
Source: White Papers, Company Presentations, Annual Reports
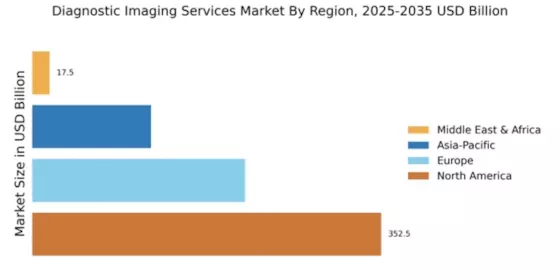
Geographically, the Americas is anticipated to dominate the global diagnostic imaging services market owing to the high clinical R&D budgets by both government as well as public and private organizations in diagnostic imaging modalities and rising adoption of advanced technologies. According to the US Investments in Medical and Health Research and Development 2013-2015, a report by Research America, in 2015, total US medical and health R&D in the US was USD 158.7 billion. Moreover, the increasing prevalence of geriatric population the subsequent growth in the incidence of variety of diseases in the region contributes to the market growth. According to the World Health Organization (WHO), in the US, more than 20% of the total population would be aged 65 years or over by 2030.This growing patient pool is powering this market.
Europe is expected to hold the second largest position in the global diagnostic imaging services market. The market growth in this region is attributed to the presence of strong academic & research base and availability of funding for research in the European countries. For instance, the European Research Council (ERC) provides grants for technological and scientific research conducted within the European Union (EU). Additionally, increased diagnostic imaging services and rising awareness among people for early detection of diseases is driving this market.
The diagnostic imaging services market in Asia-Pacific region consists of countries namely China, Japan, Republic of Korea, India, Australia and Rest of Asia-Pacific. The Asia-Pacific region is expected to be fastest growing region owing to increasing demand for technologically advanced imaging devices, improving healthcare infrastructure and high growth opportunities for major key players for setting up their regional headquarters and manufacturing plants in this region.
The Middle East & Africa has the lowest share of the global diagnostic imaging services market. Majority of the market of the region is anticipated to be held by the Middle East region owing to the growing government initiatives for the healthcare sector.
Global Diagnostic Imaging Services Market, by Procedure
Global Diagnostic Imaging Services Market, by Application
Global Diagnostic Imaging Services Market, by Service Provider
Global Diagnostic Imaging Services Market, by Region
Company Profiles
Intended Audience
Frequently Asked Questions (FAQ) :
Diagnostic Imaging Services Market would record a CAGR of 8.2% during the forecast period of 2018 to 2023.
Clinics & hospitals, diagnostic centers, research laboratories, and others are the service providers for the Diagnostic Imaging Services Market.
Americas would lead the global Diagnostic Imaging Services Market.
Asia Pacific would be the fastest-growing region in the Diagnostic Imaging Services Market.
Global Diagnostic Imaging Services Market applications are cardiology, neurology, musculoskeletal, oncology, and others.
Table of Contents:
Chapter 1. Report Prologue
Chapter 2. Market Introduction
2.1 Definition
2.2 Scope of the Study
2.2.1 Research Objective
2.2.2 Assumptions
2.2.3 Limitations
Chapter 3. Research Methodology
3.1 Introduction
3.2 Primary Research
3.3 Secondary Research
3.4 Market Size Estimation
Chapter 4. Market Dynamics
4.1 Drivers
4.2 Restraints
4.3 Opportunities
4.4 Challenges
4.5 Macroeconomic Indicators
4.6 Detection Technique Trends & Assessment
Chapter 5. Market Factor Analysis
5.1 Porter’s Five Forces Analysis
5.1.1 Bargaining Power of Suppliers
5.1.2 Bargaining Power of Buyers
5.1.3 Threat of New Entrants
5.1.4 Threat of Substitutes
5.1.5 Intensity of Rivalry
5.2 Value Chain Analysis
5.3 Investment Feasibility Analysis
5.4 Pricing Analysis
Chapter 6. Global Diagnostic Imaging Services Market , by Procedure
6.1 Introduction
6.2 X-ray
Market Estimates & Forecast, by Region, 2020-2027
Market Estimates & Forecast, by Country, 2020-2027
6.3 Computed Tomography
Market Estimates & Forecast, by Region, 2020-2027
Market Estimates & Forecast, by Country, 2020-2027
6.4 Ultrasound
Market Estimates & Forecast, by Region, 2020-2027
Market Estimates & Forecast, by Country, 2020-2027
6.5 MRI
Market Estimates & Forecast, by Region, 2020-2027
Market Estimates & Forecast, by Country, 2020-2027
6.6 Nuclear Imaging
Market Estimates & Forecast, by Region, 2020-2027
Market Estimates & Forecast, by Country, 2020-2027
6.7 Radiography
Market Estimates & Forecast, by Region, 2020-2027
Market Estimates & Forecast, by Country, 2020-2027
6.8 Others
Chapter 7. Global Diagnostic Imaging Services Market , by Application
7.1 Introduction
7.2 Neurology
Market Estimates & Forecast, by Region, 2020-2027
Market Estimates & Forecast, by Country, 2020-2027
7.3 Cardiology
Market Estimates & Forecast, by Region, 2020-2027
Market Estimates & Forecast, by Country, 2020-2027
7.4 Oncology
Market Estimates & Forecast, by Region, 2020-2027
Market Estimates & Forecast, by Country, 2020-2027
7.5 Musculoskeletal
Market Estimates & Forecast, by Region, 2020-2027
Market Estimates & Forecast, by Country, 2020-2027
7.6 Others
Chapter 8. Global Diagnostic Imaging Services Market , by Service Provider
8.1 Introduction
8.2 Clinics & Hospitals
Market Estimates & Forecast, by Region, 2020-2027
Market Estimates & Forecast, by Country, 2020-2027
8.3 Diagnostic centers
Market Estimates & Forecast, by Region, 2020-2027
Market Estimates & Forecast, by Country, 2020-2027
8.4 Research laboratories
Market Estimates & Forecast, by Region, 2020-2027
Market Estimates & Forecast, by Country, 2020-2027
8.5 Others
Chapter 9. Global Diagnostic Imaging Services Market , by Region
9.1 Introduction
9.2 Americas
9.2.1 North America
10.2.1.1 US
10.2.1.2 Canada
9.2.2 Latin America
9.3 Europe
9.3.1 Western Europe
9.3.1.1 Germany
9.3.1.2 France
9.3.1.3 Italy
9.3.1.4 Spain
9.3.1.5 UK
9.3.1.6 Rest of Western Europe
9.3.2 Eastern Europe
9.4 Asia-Pacific
9.4.1 Japan
9.4.2 China
9.4.3 India
9.4.4 Australia
9.4.5 South Korea
9.4.6 Rest of Asia-Pacific
9.5 Middle East & Africa
9.5.1 Middle East
9.5.2 Africa
Chapter 10. Company Landscape
11.1 Introduction
11.2 Market Share Analysis
11.3 Key Development & Strategies
Chapter 11. Company Profiles
11.1 Center for Diagnostic Imaging (CDI)
11.1.1 Company Overview
11.1.2 Treatment Overview
11.1.3 Financials Overview
11.1.4 Key Developments
11.1.5 SWOT Analysis
11.2 Medquest Associates, Inc./Novant Health
11.2.1 Company Overview
11.2.2 Treatment Overview
11.2.3 Financial Overview
11.2.4 Key Developments
11.2.5 SWOT Analysis
11.3 Simonmed/Dignity Health
11.3.1 Company Overview
11.3.2 Treatment Overview
11.3.3 Financial Overview
11.3.4 Key Development
11.3.5 SWOT Analysis
11.4 Touchstone Imaging
11.4.1 Company Overview
11.4.2 Treatment Overview
11.4.3 Financial Overview
11.4.4 Key Development
11.4.5 SWOT Analysis
11.5 Alliance Medical
11.5.1 Company Overview
11.5.2 Treatment Overview
11.5.3 Financial overview
11.5.4 Key Developments
11.5.5 SWOT Analysis
11.6 Medica Group
11.6.1 Company Overview
11.6.2 Treatment Overview
11.6.3 Financial Overview
11.6.4 Key Developments
11.6.5 SWOT Analysis
11.7 Sonic Healthcare
11.7.1 Overview
11.7.2 Treatment Overview
11.7.3 Financial Overview
11.7.4 Key Developments
11.7.5 SWOT Analysis
12.8 Global Diagnostics
11.8.1 Overview
11.8.2 Treatment Overview
11.8.3 Financials
11.8.4 Key Developments
11.8.5 SWOT Analysis
11.9 Consensys Imaging Service, Inc.
11.9.1 Overview
11.9.2 Treatment Overview
11.9.3 Financials
11.9.4 Key Developments
11.9.5 SWOT Analysis
11.10 Progressive Radiology
11.10.1 Overview
11.10.2 Treatment Overview
11.10.3 Financials
11.10.4 Key Developments
11.10.5 SWOT Analysis
11.11 Concord Medical Services Holdings Limited
11.11.1 Overview
11.11.2 Treatment Overview
11.11.3 Financials
11.11.4 Key Developments
11.11.5 SWOT Analysis
11.12 Alliance Healthcare Services
11.12.1 Overview
11.12.2 Treatment Overview
11.12.3 Financials
11.12.4 Key Developments
11.12.5 SWOT Analysis
11.13 InHealth Group
11.13.1 Overview
11.13.2 Treatment Overview
11.13.3 Financials
11.13.4 Key Developments
11.13.5 SWOT Analysis
Chapter 12 MRFR Conclusion
12.1 Key Findings
12.1.1 From CEO’s View point
12.1.2 Unmet Needs of the Market
12.2 Key Companies to Watch
12.3 Predictions for the Diagnostic Imaging Services Industry
Chapter 13. Appendix
LIST OF TABLES
Table 1 Global Diagnostic Imaging Services Market Synopsis, 2020-2027
Table 2 Global Diagnostic Imaging Services Market Estimates and Forecast, 2020-2027
(USD Million)
Table 3 Global Diagnostic Imaging Services Market , by Region, 2020-2027 (USD Million)
Table 4 Global Diagnostic Imaging Services Market , by Procedure, 2020-2027 (USD Million)
Table 5 Global Diagnostic Imaging Services Market , by Application, 2020-2027 (USD
Million)
Table 6 Global Diagnostic Imaging Services Market , by Service Provider, 2020-2027 (USD Million)
Table 7 North America: Diagnostic Imaging Services Market , by Procedure, 2020-2027 (USD
Million)
Table 9 North America: Diagnostic Imaging Services Market , by Application, 2020-2027
(USD Million)
Table 10 North America: Diagnostic Imaging Services Market , by Service Provider, 2020-2027 (USD
Million)
Table 11 US: Diagnostic Imaging Services Market , by Procedure, 2020-2027 (USD Million)
Table 13 US: Diagnostic Imaging Services Market , by Application, 2020-2027 (USD
Million)
Table 14 US: Diagnostic Imaging Services Market , by Service Provider, 2020-2027 (USD Million)
Table 15 Canada: Diagnostic Imaging Services Market , by Procedure, 2020-2027 (USD Million)
Table 17 Canada: Diagnostic Imaging Services Market , by Application, 2020-2027 (USD
Million)
Table 18 Canada: Diagnostic Imaging Services Market ,by Service Provider, 2020-2027 (USD Million)
Table 20 Latin America: Diagnostic Imaging Services Market , by Procedure, 2020-2027 (USD
Million)
Table 21 Latin America: Diagnostic Imaging Services Market , by Application, 2020-2027
(USD Million)
Table 22 Latin America: Diagnostic Imaging Services Market , by Service Provider, 2020-2027 (USD
Million)
Table 23 Europe: Diagnostic Imaging Services Market , by Procedure, 2020-2027 (USD Million)
Table 24 Europe: Diagnostic Imaging Services Market , by Application, 2020-2027 (USD
Million)
Table 25 Europe: Diagnostic Imaging Services Market , by Service Provider, 2020-2027 (USD Million)
Table 26 Western Europe: Diagnostic Imaging Services Market , by Procedure, 2020-2027 (USD
Million)
Table 27 Western Europe: Diagnostic Imaging Services Market , by Application, 2020–
2027 (USD Million)
Table 28 Western Europe: Diagnostic Imaging Services Market , by Service Provider, 2020-2027 (USD
Million)
Table 29 Eastern Europe: Diagnostic Imaging Services Market , by Procedure, 2020-2027 (USD
Million)
Table 30 Eastern Europe: Diagnostic Imaging Services Market , by Application, 2020–
2027 (USD Million)
Table 31 Eastern Europe: Diagnostic Imaging Services Market , by Service Provider, 2020-2027 (USD
Million)
Table 32 Asia-Pacific: Diagnostic Imaging Services Market , by Procedure, 2020-2027 (USD
Million)
Table 33 Asia-Pacific: Diagnostic Imaging Services Market , by Application, 2020-2027
(USD Million)
Table 34 Asia-Pacific: Diagnostic Imaging Services Market , by Service Provider, 2020-2027 (USD
Million)
Table 35 Middle East & Africa: Diagnostic Imaging Services Market , by Procedure, 2020-2027
(USD Million)
Table 36 Middle East & Africa: Diagnostic Imaging Services Market , by Application,
2020-2027 (USD Million)
Table 37 Middle East & Africa: Diagnostic Imaging Services Market , by Service Provider, 2020-2027
(USD Million)
LIST OF FIGURES
Figure 1 Research Process
Figure 2 Segmentation for Global Diagnostic Imaging Services Market
Figure 3 Segmentation Market Dynamics for Global Diagnostic Imaging Services Market
Figure 4 Global Diagnostic Imaging Services Market Share, by Procedure, 2020
Figure 5 Global Diagnostic Imaging Services Market Share, by Application, 2020
Figure 6 Global Diagnostic Imaging Services Market Share, by Service Provider, 2020
Figure 7 Global Diagnostic Imaging Services Market Share, by Region, 2020
Figure 8 North America: Diagnostic Imaging Services Market Share, by Country, 2020
Figure 9 Europe: Diagnostic Imaging Services Market Share, by Country, 2020
Figure 10 Asia-Pacific: Diagnostic Imaging Services Market Share, by Country, 2020
Figure 11 Middle East & Africa: Diagnostic Imaging Services Market Share, by Country, 201
Figure 12 Global Diagnostic Imaging Services Market : Company Share Analysis, 2020 (%)
Figure 13 Center for Diagnostic Imaging (CDI): Key Financials
Figure 14 Center for Diagnostic Imaging (CDI): Segmental Revenue
Figure 15 Center for Diagnostic Imaging (CDI): Geographical Revenue
Figure 16 Medquest Associates, Inc./Novant Health: Key Financials
Figure 17 Medquest Associates, Inc./Novant Health: Segmental Revenue
Figure 18 Medquest Associates, Inc./Novant Health: Geographical Revenue
Figure 19 Simonmed/Dignity Health : Key Financials
Figure 20 Simonmed/Dignity Health : Segmental Revenue
Figure 21 Simonmed/Dignity Health : Geographical Revenue
Figure 22 Alliance Medical : Key Financials
Figure 23 Alliance Medical : Segmental Revenue
Figure 24 Alliance Medical : Geographical Revenue
Figure 25 Touchstone Imaging : Key Financials
Figure 26 Touchstone Imaging : Segmental Revenue
Figure 27 Touchstone Imaging : Geographical Revenue
Figure 28 Alliance Medical : Key Financials
Figure 29 Alliance Medical : Segmental Revenue
Figure 30 Alliance Medical : Geographical Revenue
Figure 31 Medica Group : Key Financials
Figure 32 Medica Group .: Segmental Revenue
Figure 33 Medica Group .: Geographical Revenue
Figure 34 Sonic Healthcare : Key Financials
Figure 35 Sonic Healthcare : Segmental Revenue
Figure 36 Sonic Healthcare : Geographical Revenue
Figure 37 Global Diagnostics: Key Financials
Figure 38 Global Diagnostics: Segmental Revenue
Figure 39 Global Diagnostics: Geographical Revenue
Figure 40 Consensys Imaging Service, Inc.: Key Financials
Figure 41 Consensys Imaging Service, Inc.: Segmental Revenue
Figure 42 Consensys Imaging Service, Inc.: Geographical Revenue
Figure 43 Progressive Radiology: Key Financials
Figure 44 Progressive Radiology: Segmental Revenue
Figure 45 Progressive Radiology: Geographical Revenue
Figure 46 Concord Medical Services Holdings Limited: Key Financials
Figure 47 Concord Medical Services Holdings Limited: Segmental Revenue
Figure 48 Concord Medical Services Holdings Limited: Geographical Revenue
Figure 49 Alliance Healthcare Services: Key Financials
Figure 50 Alliance Healthcare Services: Segmental Revenue
Figure 51 Alliance Healthcare Services: Geographical Revenue
Figure 52 InHealth Group: Key Financials
Figure 53 InHealth Group: Segmental Revenue
Figure 54 InHealth Group: Geographical Revenue
This table of content is tentative and subject to change as the research progresses.
Please Note: Financial details of company cannot be provided if the information of the company is not available in public domain and or reliable source.