ID: MRFR/Pharma/3589-HCR | | Region: Global | 110 pages
Market Scenario
Deformity is the malformation of any component of the body leading to an impairment or functional loss of the organ. The condition results in the bony alteration in the topography of soft tissues. The exact cause for the disease is still unknown. However, genetic mutation, damage during the foetal stage, complications at birth, hormonal disorder, arthritis along with other causes are expected to cause this disease. Increasing prevalence of deformity is the major driving factor for the growth of the market. According to the Physicians Committee (2015), approximately 3% of all children born in the U.S. suffer major malformations at birth. Additionally, over 150,000 babies are born each year with birth defects. Though, in early stages the disease is acute, however if the proper treatment is not taken it may led to serious conditions. A number of diagnostic procedures are available in the market for the diagnosis of deformities. A number of companies are involved in the manufacturing of innovative and effective treatment options for the patients. Besides, the increasing government support and rising healthcare expenditure are also supporting the growth of the market. Furthermore, rapid development in the imaging technology and continuous improvement in the medical services have fuelled the market growth. As there is no precise treatment available in the market and the cost associated with the surgeries is very high which is not affordable for people in the developing regions. Thus, lack of the precise treatment and high cost of surgeries may slow the growth of the market.
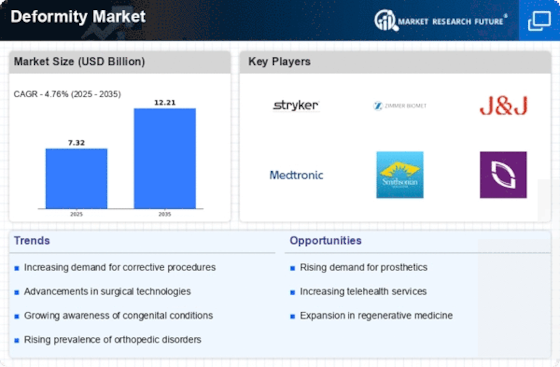
The global deformity market is expected to grow at a CAGR of 7.1% during forecast period 2017-2023.
Intended Audience
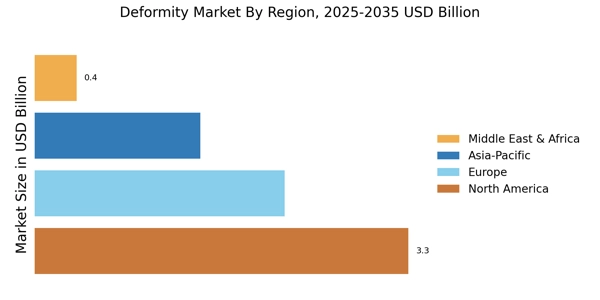
Figure 1:- Global Deformity market share, by region (%)
Sources: WHO, annual reports, press release, white paper, and company presentation
Segmentation
The global deformity market is segmented on the basis of types, therapy and end users.
On the basis of types, the market is segmented into congenital, and acquired. Congenital deformity is further segmented into Sprangel’s shoulder, elbow joint congenital dislocation, and others.
On the basis of therapy, the market is the market is segmented into diagnosis and treatment. Diagnosis is further segmented into MRI, CT scan, bone scan and others. Treatment is further categorized into medical therapy, surgical therapy, postoperative care, long-term monitoring and others.
On the basis of end users, the market is segmented into hospital & clinics, orthopedic care centers and others.
Regional Analysis
The Americas dominates the global deformity market owing to large patient population. According to the Physicians Committee (2015), approximately 3% of all children born in the U.S. have a major malformation at birth. Increasing number of people suffering from deformity and other bones disease have driven the growth of the Americas deformity market. Additionally, increasing government support for research & development, availability of funds for research, and high per capita income will fuel the growth of the market. Increasing awareness among people regarding the disease and well-developed technology will create opportunities for the development of the market.
Europe accounts for the second leading deformity market, which is followed by Asia Pacific. Increasing patient population, availability of funds for research, and government support for research & development projected to drive the market in Europe. Germany, France and U.K is expected to lead the European market.
Asia Pacific is the fastest growing region in the global deformity market owing to rapidly increasing population, the developing economies and rising demand for the better treatment options for the diseases. India and China holds the major share of the market.
Whereas, the Middle East & Africa owns the least share of the global deformity market due to the presence of poor economy, especially, in the Africa region. The market of this region is dominated by the Middle East due to a well-developed healthcare sector and huge healthcare expenditure. However, Africa region shows the fastest growth for the market.
Research Methodology
Sources: WHO, annual reports, press release, white paper, and company presentation
Key players in global deformity market
The major key players in the global deformity market: SpineCraft, LCC (U.S.), DePuy Synthes (U.S.), NuVasive (U.S.), OrthoPediatrics Corp. (U.S.), 3M (U.S.), Bristol-Myers Squibb and Company (U.S.), B. Braun (Germany), Stryker Corporation (U.S.), Pfizer Inc. (U.S.), Lineage Medical, Inc. (U.S.), Johnson & Johnson Services Inc. (U.S.), Argon Medical Devices, Inc (the Netherlands), and Cook Medical (U.S.).
Frequently Asked Questions (FAQ) :
deformity market can progress at 7.1% CAGR from 2017 to 2025.
High prevalence of deformities is the major driver of the global deformity market.
High costs of surgeries and lack of equipment to provide accurate diagnosis is likely to deter the global deformity market growth.
The Americas can lead the global deformity market due to cases of patients suffering from malformations or bone diseases.
A Cook Medical, B. Braun, SpineCraft, LCC, Pfizer Inc., Johnson & Johnson Services Inc., Argon Medical Devices, Inc, Stryker Corporation, Lineage Medical, Inc., Bristol-Myers Squibb and Company, 3M, DePuy Synthes, OrthoPediatrics Corp., and NuVasive are notable players of the global deformity market.
TABLE OF CONTENT
Chapter 1. Report Prologue
Chapter 2. Market Introduction
2.1 Definition
2.2 Scope of the Study
2.2.1 Research Objective
2.2.2 Assumptions
2.2.3 Limitations
Chapter 3. Research Methodology
3.1 Introduction
3.2 Primary Research
3.3 Secondary Research
3.4 Market Size Estimation
Chapter 4. Market Dynamics
4.1 Drivers
4.2 Restrains
4.3 Opportunities
4.4 Challenges
4.5 Macroeconomic Indicators
4.6 Technology Trends & Assessment
Chapter 5. Market Factor Analysis
5.1 Porter’s Five Forces Analysis
5.1.1 Bargaining Power of Suppliers
5.1.2 Bargaining Power of Buyers
5.1.3 Threat of New Entrants
5.1.4 Threat of Substitutes
5.1.5 Intensity of Rivalry
5.2 Value Chain Analysis
5.3 Investment Feasibility Analysis
5.4 Pricing Analysis
Chapter 6. Global Deformity Market, by Types
6.1 Introduction
6.2 Congenital
Market Estimates & Forecast, 2017 – 2023
6.2.1 Sprangel’s Shoulder
6.2.2 Elbow Joint Conginetal Dislocation
6.2.3 Others
6.3 Acquired
Market Estimates & Forecast, 2017 – 2023
Chapter 7. Global Deformity Market, by Therapy
7.1 Introduction
7.2 Diagnosis
Market Estimates & Forecast, 2017 – 2023
7.2.1 MRI
7.2.2 CT Scan
7.2.3 Bone Scan
7.2.4 Others
7.3 Treatment
Market Estimates & Forecast, 2017 – 2023
7.3.1 Medical Therapy
7.3.2 Surgical Therapy
7.3.3 Postoperative Care
7.3.4 Long-Term Monitoring
7.3.5 Others
Chapter 8 Global Deformity Market, by End User
8.1 Introduction
8.2 Hospital & Clinics
Market Estimates & Forecast, 2017 – 2023
8.3 Orthopedic Care Centers
Market Estimates & Forecast, 2017 – 2023
8.4 Others
Market Estimates & Forecast, 2017 – 2023
Chapter 9. Global Deformity Market, by Region
9.1 Introduction
9.2 Americas
9.2.1 North America
9.2.1.1 U.S.
9.2.1.1 Canada
9.2.2 South America
9.3 Europe
9.3.1 Western Europe
9.3.1.1 Germany
9.3.1.2 France
9.3.1.3 Italy
9.3.1.4 Spain
9.3.1.5 U.K
9.3.1.6 Rest of Western Europe
9.3.2 Eastern Europe
9.4 Asia Pacific
9.4.1 Japan
9.4.2 China
9.4.3 India
9.4.4 Australia
9.4.5 Republic of Korea
9.4.6 Rest of Asia Pacific
9.5 The Middle East & Africa
9.5.1 United Arab Emirates
9.5.2 Saudi Arabia
9.5.3 Oman
9.5.4 Kuwait
9.5.5 Qatar
9.5.6 Rest of the Middle East & Africa
Chapter 10 Company Landscape
10.1 Introduction
10.2 Market Share Analysis
10.3 Key Development & Strategies
10.3.1 Key Developments
Chapter 11 Company Profiles
11.1 SpineCraft, LCC
11.1.1 Company Overview
11.1.2 Product Overview
11.1.3 Financials
11.1.4 SWOT Analysis
11.2 NuVasive
11.2.1 Company Overview
11.2.2 Product Overview
11.2.3 Financial Overview
11.2.4 Key Developments
11.2.5 SWOT Analysis
11.3 OrthoPediatrics Corp.
11.3.1 Company Overview
11.3.2 Product Overview
11.3.3 Financial Overview
11.3.4 Key Development
11.3.5 SWOT Analysis
11.4 Pfizer Inc.
11.4.1 Company Overview
11.4.2 Product/Business Segment Overview
11.4.3 Financial Overview
11.4.4 Key Development
11.4.5 SWOT Analysis
11.5 B. Braun
11.5.1 Company Overview
11.5.2 Product Overview
11.5.3 Financial overview
11.5.4 Key Developments
11.6 DePuy Synthes
11.6.1 Company Overview
11.6.2 Product Overview
11.6.3 Financial Overview
11.6.4 Key Developments
11.7 Bristol-Myers Squibb and Company
11.7.1 Overview
11.7.2 Product Overview
11.7.3 Financials
11.7.4 Key Developments
11.7.5 SWOT Analysis
11.8 Others
Chapter 12 MRFR Conclusion
12.1 Key Findings
12.1.1 From CEO’s View Point
12.1.2 Unmet Needs of the Market
12.2 Key Companies to Watch
12.3 Prediction of Pharmaceutical industry
Chapter 13. Appendix
LIST OF TABLES
Table 1 Deformity Industry Synopsis, 2017 – 2023
Table 2 Global Deformity Market Estimates and Forecast, 2017 – 2023, (USD Million)
Table 3 Global Deformity Market by Region, 2017 – 2023, (USD Million)
Table 4 Global Deformity Market by Types, 2017 – 2023, (USD Million)
Table 5 Global Deformity Market by Therapy, 2017 – 2023, (USD Million)
Table 6 Global Deformity Market by End Users, 2017 – 2023, (USD Million)
Table 7 North America Deformity Market by Types, 2017 – 2023, (USD Million)
Table 8 North America Deformity Market by Therapy, 2017 – 2023, (USD Million)
Table 9 North America Deformity Market by End Users, 2017 – 2023, (USD Million)
Table 10 US Market by Types, 2017 – 2023, (USD Million)
Table 11 US Deformity Market by Therapy, 2017 – 2023, (USD Million)
Table 12 US Deformity Market by End Users, 2017 – 2023, (USD Million)
Table 13 Canada Market by Types, 2017 – 2023, (USD Million)
Table 14 Canada Deformity Market by Therapy, 2017 – 2023, (USD Million)
Table 15 Canada Deformity Market by End Users, 2017 – 2023, (USD Million)
Table 16 South America Market by Types, 2017 – 2023, (USD Million)
Table 17 South America Deformity Market by Therapy, 2017 – 2023, (USD Million)
Table 18 South America Deformity Market by End Users, 2017 – 2023, (USD Million)
Table 19 Europe Market by Types, 2017 – 2023, (USD Million)
Table 20 Europe Deformity Market by Therapy, 2017 – 2023, (USD Million)
Table 21 Europe Deformity Market by End Users, 2017 – 2023, (USD Million)
Table 22 Western Europe Market by Types, 2017 – 2023, (USD Million)
Table 23 Western Europe Deformity Market by Therapy, 2017 – 2023, (USD Million)
Table 24 Western Europe Deformity Market by End Users, 2017 – 2023, (USD Million)
Table 25 Eastern Europe Market by Types, 2017 – 2023, (USD Million)
Table 26 Eastern Europe Deformity Market by Therapy, 2017 – 2023, (USD Million)
Table 27 Eastern Europe Deformity Market by End Users, 2017 – 2023, (USD Million)
Table 28 Asia Pacific Market by Types, 2017 – 2023, (USD Million)
Table 29 Asia Pacific Deformity Market by Therapy, 2017 – 2023, (USD Million)
Table 30 Asia Pacific Deformity Market by End Users, 2017 – 2023, (USD Million)
Table 31 Middle East & Africa Market by Types, 2017 – 2023, (USD Million)
Table 32 Middle East & Africa Deformity Market by Therapy, 2017 – 2023, (USD Million)
Table 33 Middle East & Africa Deformity Market by End Users, 2017 – 2023, (USD Million)
LIST OF FIGURES
Figure 1 Research Process
Figure 2 Segmentation for Global Deformity Market
Figure 3 Segmentation Market Dynamics for Global Deformity Market
Figure 4 Global Deformity market Share, by Types 2016
Figure 5 Global Deformity market Share, by Therapy 2016
Figure 6 Global Deformity Market Share, by End Users, 2016
Figure 7 Global Deformity Market Share, by Region, 2016
Figure 8 North America Deformity Market Share, by Country, 2016
Figure 9 Europe Deformity Market Share, by Country, 2016
Figure 10 Asia Pacific Deformity Market Share, by Country, 2016
Figure 11 Middle East & Africa Deformity Market Share, by Country, 2016
Figure 12 Global Deformity Market: Company Share Analysis, 2016 (%)
Figure 13 SpineCraft, LCC: Key Financials
Figure 14 SpineCraft, LCC: Segmental Revenue
Figure 15 SpineCraft, LCC: Geographical Revenue
Figure 16 NuVasive: Key Financials
Figure 17 NuVasive: Segmental Revenue
Figure 18 NuVasive: Geographical Revenue
Figure 19 OrthoPediatrics Corp.: Key Financials
Figure 20 OrthoPediatrics Corp.: Segmental Revenue
Figure 21 OrthoPediatrics Corp.: Geographical Revenue
Figure 22 Pfizer Inc.: Key Financials
Figure 23 Pfizer Inc.: Segmental Revenue
Figure 24 Pfizer Inc.: Geographical Revenue
Figure 25 B. Braun: Key Financials
Figure 26 B. Braun: Segmental Revenue
Figure 27 B. Braun: Geographical Revenue
Figure 28 DePuy Synthes: Key Financials
Figure 29 DePuy Synthes: Segmental Revenue
Figure 30 DePuy Synthes: Geographical Revenue
Figure 31 Bristol-Myers Squibb and Company: Key Financials
Figure 32 Bristol-Myers Squibb and Company: Segmental Revenue
Figure 33 Bristol-Myers Squibb and Company: Geographical Revenue