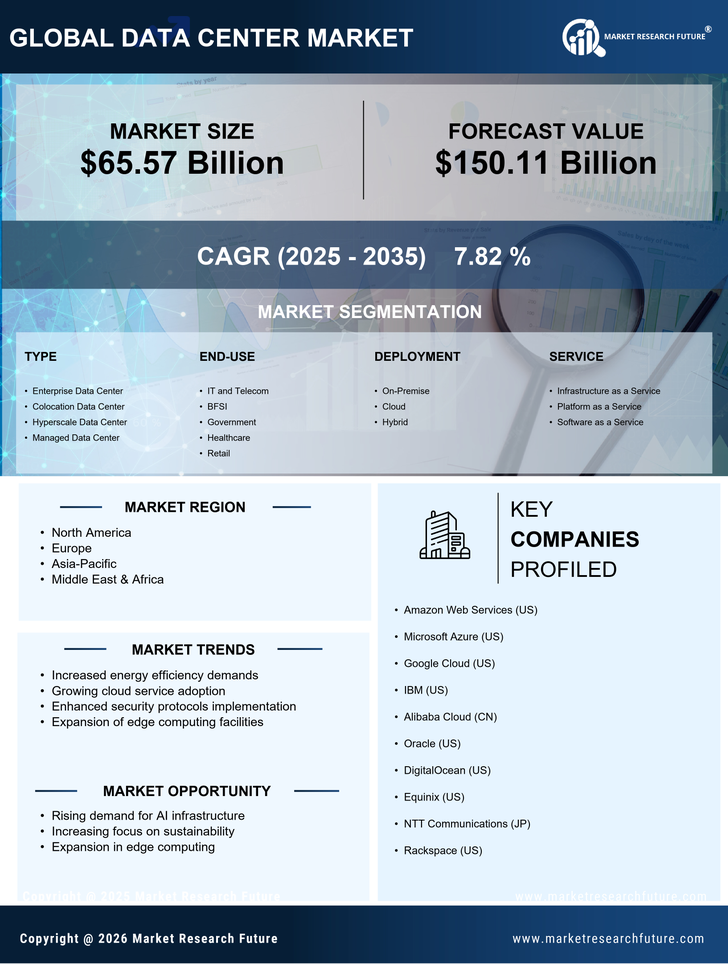
Certified Global Research Member
Isomar fd.webp Wcrc 57.webp
Key Questions Answered
  • Global Market Outlook
  • In-depth analysis of global and regional trends
  • Analyze and identify the major players in the market, their market share, key developments, etc.
  • To understand the capability of the major players based on products offered, financials, and strategies.
  • Identify disrupting products, companies, and trends.
  • To identify opportunities in the market.
  • Analyze the key challenges in the market.
  • Analyze the regional penetration of players, products, and services in the market.
  • Comparison of major playersโ€™ financial performance.
  • Evaluate strategies adopted by major players.
  • Recommendations
Why Choose Market Research Future?
  • Vigorous research methodologies for specific market.
  • Knowledge partners across the globe
  • Large network of partner consultants.
  • Ever-increasing/ Escalating data base with quarterly monitoring of various markets
  • Trusted by fortune 500 companies/startups/ universities/organizations
  • Large database of 5000+ markets reports.
  • Effective and prompt pre- and post-sales support.

Data Center Market Research Report Information By Type (Corporate Data Centers, Web Hosting Data Centers), By Density (Low, Medium, High, Extreme), By Vertical (Banking & Financial Services, Telecom & IT, Government, Healthcare) And By Region (North America, Europe, Asia-Pacific, And Rest Of The World) โ€“ Market Forecast Till 2030.


ID: MRFR/ICT/3299-HCR | 100 Pages | Author: Ankit Gupta| April 2024

Data Center Market Segmentation


Data Center Type Outlook (USD Million, 2018-2030)


  • Corporate data centers


  • Web hosting data centers


Data Center Density Outlook (USD Million, 2018-2030)


  • Low


  • Medium


  • High


  • Extreme


Data Center Vertical Outlook (USD Million, 2018-2030)


  • Banking & Financial Services


  • Telecom & IT


  • Government


  • Healthcare


Data Center Regional Outlook (USD Million, 2018-2030)


  • North America Outlook (USD Million, 2018-2030)


    • North America Data Center by Type


      • Corporate data centers


      • Web hosting data centers


    • North America Data Center by Density


      • Low


      • Medium


      • High


      • Extreme


    • North America Data Center by Vertical


      • Banking & Financial Services


      • Telecom & IT


      • Government


      • Healthcare


    • US Outlook (USD Million, 2018-2030)


    • US Data Center by Type


      • Corporate data centers


      • Web hosting data centers


    • US Data Center by Density


      • Low


      • Medium


      • High


      • Extreme


    • US Data Center by Vertical


      • Banking & Financial Services


      • Telecom & IT


      • Government


      • Healthcare


    • CANADA Outlook (USD Million, 2018-2030)


    • CANADA Data Center by Type


      • Corporate data centers


      • Web hosting data centers


    • CANADA Data Center by Density


      • Low


      • Medium


      • High


      • Extreme


    • CANADA Data Center by Vertical


      • Banking & Financial Services


      • Telecom & IT


      • Government


      • Healthcare


  • Europe Outlook (USD Million, 2018-2030)


    • Europe Data Center by Type


      • Corporate data centers


      • Web hosting data centers


    • Europe Data Center by Density


      • Low


      • Medium


      • High


      • Extreme


    • Europe Data Center by Vertical


      • Banking & Financial Services


      • Telecom & IT


      • Government


      • Healthcare


    • Germany Outlook (USD Million, 2018-2030)


    • Germany Data Center by Type


      • Corporate data centers


      • Web hosting data centers


    • Germany Data Center by Density


      • Low


      • Medium


      • High


      • Extreme


    • Germany Data Center by Vertical


      • Banking & Financial Services


      • Telecom & IT


      • Government


      • Healthcare


    • France Outlook (USD Million, 2018-2030)


    • France Data Center by Type


      • Corporate data centers


      • Web hosting data centers


    • France Data Center by Density


      • Low


      • Medium


      • High


      • Extreme


    • France Data Center by Vertical


      • Banking & Financial Services


      • Telecom & IT


      • Government


      • Healthcare


    • UK Outlook (USD Million, 2018-2030)


    • UK Data Center by Type


      • Corporate data centers


      • Web hosting data centers


    • UK Data Center by Density


      • Low


      • Medium


      • High


      • Extreme


    • UK Data Center by Vertical


      • Banking & Financial Services


      • Telecom & IT


      • Government


      • Healthcare


    • ITALY Outlook (USD Million, 2018-2030)


    • ITALY Data Center by Type


      • Corporate data centers


      • Web hosting data centers


    • ITALY Data Center by Density


      • Low


      • Medium


      • High


      • Extreme


    • ITALY Data Center by Vertical


      • Banking & Financial Services


      • Telecom & IT


      • Government


      • Healthcare


    • SPAIN Outlook (USD Million, 2018-2030)


    • Spain Data Center by Type


      • Corporate data centers


      • Web hosting data centers


    • Spain Data Center by Density


      • Low


      • Medium


      • High


      • Extreme


    • Spain Data Center by Vertical


      • Banking & Financial Services


      • Telecom & IT


      • Government


      • Healthcare


    • Rest Of Europe Outlook (USD Million, 2018-2030)


    • Rest Of Europe Data Center by Type


      • Corporate data centers


      • Web hosting data centers


    • REST OF EUROPE Data Center by Density


      • Low


      • Medium


      • High


      • Extreme


    • REST OF EUROPE Data Center by Vertical


      • Banking & Financial Services


      • Telecom & IT


      • Government


      • Healthcare


  • Asia-Pacific Outlook (USD Million, 2018-2030)


    • Asia-Pacific Data Center by Type


      • Corporate data centers


      • Web hosting data centers


    • Asia-Pacific Data Center by Density


      • Low


      • Medium


      • High


      • Extreme


    • Asia-Pacific Data Center by Vertical


      • Banking & Financial Services


      • Telecom & IT


      • Government


      • Healthcare


    • China Outlook (USD Million, 2018-2030)


    • China Data Center by Type


      • Corporate data centers


      • Web hosting data centers


    • China Data Center by Density


      • Low


      • Medium


      • High


      • Extreme


    • China Data Center by Vertical


      • Banking & Financial Services


      • Telecom & IT


      • Government


      • Healthcare


    • Japan Outlook (USD Million, 2018-2030)


    • Japan Data Center by Type


      • Corporate data centers


      • Web hosting data centers


    • Japan Data Center by Density


      • Low


      • Medium


      • High


      • Extreme


    • Japan Data Center by Vertical


      • Banking & Financial Services


      • Telecom & IT


      • Government


      • Healthcare


    • India Outlook (USD Million, 2018-2030)


    • India Data Center by Type


      • Corporate data centers


      • Web hosting data centers


    • India Data Center by Density


      • Low


      • Medium


      • High


      • Extreme


    • India Data Center by Vertical


      • Banking & Financial Services


      • Telecom & IT


      • Government


      • Healthcare


    • Australia Outlook (USD Million, 2018-2030)


    • Australia Data Center by Type


      • Corporate data centers


      • Web hosting data centers


    • Australia Data Center by Density


      • Low


      • Medium


      • High


      • Extreme


    • Australia Data Center by Vertical


      • Banking & Financial Services


      • Telecom & IT


      • Government


      • Healthcare


    • Rest of Asia-Pacific Outlook (USD Million, 2018-2030)


    • Rest of Asia-Pacific Data Center by Type


      • Corporate data centers


      • Web hosting data centers


    • Rest of Asia-Pacific Data Center by Density


      • Low


      • Medium


      • High


      • Extreme


    • Rest of Asia-Pacific Data Center by Vertical


      • Banking & Financial Services


      • Telecom & IT


      • Government


      • Healthcare


  • Rest of the World Outlook (USD Million, 2018-2030)


    • Rest of the World Data Center by Type


      • Corporate data centers


      • Web hosting data centers


    • Rest of the World Data Center by Density


      • Low


      • Medium


      • High


      • Extreme


    • Rest of the World Data Center by Vertical


      • Banking & Financial Services


      • Telecom & IT


      • Government


      • Healthcare


    • Middle East Outlook (USD Million, 2018-2030)


    • Middle East Data Center by Type


      • Corporate data centers


      • Web hosting data centers


    • Middle East Data Center by Density


      • Low


      • Medium


      • High


      • Extreme


    • Middle East Data Center by Vertical


      • Banking & Financial Services


      • Telecom & IT


      • Government


      • Healthcare


    • Africa Outlook (USD Million, 2018-2030)


    • Africa Data Center by Type


      • Corporate data centers


      • Web hosting data centers


    • Africa Data Center by Density


      • Low


      • Medium


      • High


      • Extreme


    • Africa Data Center by Vertical


      • Banking & Financial Services


      • Telecom & IT


      • Government


      • Healthcare


    • Latin America Outlook (USD Million, 2018-2030)


    • Latin America Data Center by Type


      • Corporate data centers


      • Web hosting data centers


    • Latin America Data Center by Density


      • Low


      • Medium


      • High


      • Extreme


    • Latin America Data Center by Vertical


      • Banking & Financial Services


      • Telecom & IT


      • Government


      • Healthcare


Research Methodology on Data Centre Market


A systematic and detailed research methodology is employed in order to study the market size and potential of the global data center market. This research methodology involves various steps including primary and secondary data collection methods, competitive analysis, market sizing & estimation, market scenario analysis and final market assessment.


Data Collection


Primary data is collected from interviews of key players, industry experts and relevant stakeholders in the data center market. In addition, secondary data is collected from major industry databases such as Bloomberg, Factiva, Hoovers, Plunkett and Frost & Sullivan. The data is used to analyze the present market size, trends and future estimates.


Market Sizing & Forecasting


Market sizing and forecasting are performed using econometric models that are based on the market components, such as demand/ supply, customer/ company dynamics, competitive landscape, and economic conditions. The models are detailed in the report and help in forecasting the market size from 2023 to 2030.


Competitive Analysis


The competitive landscape in the global data center market is examined by analyzing the intensity of bankruptcy, market share, industry trends, payer mix, customer mix, country mix, personnel mix, product mix and end-use mix. This analysis helps in understanding the competitive scenario and how it impacts the market landscape.


Market Scenario


In order to assess the market scenario of the global data center market, MRFR used Porter's 5 Forces Model, PEST Analysis and Customer Buying Behaviour Matrix. These models provide insights into the drivers, restraints, opportunities and threats in the market.


Final Market Assessment


The analysis and data collected is used to forecast the global data center market's market size and potential. The forecasts are validated using the narrative and historical method. The final market assessment is based on the forecast and analysis, which gives an overall picture of the market in the next seven years.


Conclusion


The research methodology employed in this study helps in understanding the overall market size and potential of the global data center market. Primary and secondary data is collected and analyzed to assess the current market situation and projected scenarios for the next five years. Porter's 5 Forces Model, PEST Analysis and Customer Buying Behaviour Matrix are utilized to gain insights into the drivers, restraints and opportunities in the market. The final market assessment is based on the forecast and analysis, which gives an overall picture of the market in the next seven years (2023 to 2030).

Leading companies partner with us for data-driven Insights
client_1 client_2 client_3 client_4 client_5 client_6 client_7 client_8 client_9 client_10
Please fill in Business Email for Quick Response

TABLE OF CONTENTS

1 MARKET INTRODUCTION

1.1 INTRODUCTION

1.2 SCOPE OF STUDY

1.2.1 RESEARCH OBJECTIVE

1.2.2 ASSUMPTIONS

1.2.3 LIMITATIONS

1.3 MARKET STRUCTURE

2 RESEARCH METHODOLOGY

2.1 RESEARCH HETEROGENEOUS NETWORK

2.2 PRIMARY RESEARCH

2.3 SECONDARY RESEARCH

2.4 FORECAST MODEL

2.4.1 MARKET DATA COLLECTION, ANALYSIS & FORECAST

2.4.2 MARKET SIZE ESTIMATION

3 MARKET DYNAMICS

3.1 INTRODUCTION

3.2 MARKET DRIVERS

3.3 MARKET CHALLENGES

4 EXECUTIVE SUMMARY

5. MARKET FACTOR ANALYSIS

5.1 PORTERโ€™S FIVE FORCES ANALYSIS

5.2 SUPPLY CHAIN ANALYSIS

6 GLOBAL DATA CENTER MARKET, BY SEGMENTS

6.1 INTRODUCTION

6.2 MARKET STATISTICS

6.2.1 BY TYPE

6.2.1.1 CORPORATE DATA CENTERS

6.2.1.2 WEBHOSTING DATA CENTERS

6.2.2 BY DENSITY

6.2.2.1 LOW

6.2.2.2 MEDIUM

6.2.2.3 HIGH

6.2.2.4 EXTREME

6.2.3 BY VERTICAL

6.2.3.1 BANKING AND FINANCIAL SERVICES

6.2.3.2 TELECOM AND IT

6.2.3.3 GOVERNMENT

6.2.3.4 HEALTHCARE

6.2.3.5 OTHERS

6.2.4 BY REGION

6.2.4.1 NORTH AMERICA

6.2.4.1.1 U.S.

6.2.4.1.2 CANADA

6.2.4.1.3 MEXICO

6.2.4.2 EUROPE

6.2.4.2.1 U.K.

6.2.4.2.2 GERMANY

6.2.4.2.3 FRANCE

6.2.4.2.4 ITALY

6.2.4.2.5 REST OF THE EUROPE

6.2.4.3 ASIA PACIFIC

6.2.4.3.1 CHINA

6.2.4.3.2 JAPAN

6.2.4.3.3 SOUTH KOREA

6.2.4.3.4 INDIA

6.2.4.3.5 REST OF THE ASIA PACIFIC

6.2.4.4 REST OF THE WORLD

7 COMPETITIVE ANALYSIS

7.1 MARKET SHARE ANALYSIS

7.2 COMPANY PROFILES

7.2.1 DIGITAL REALTY TRUST, INC (U.S)

7.2.2 IBM CORPORATION (U.S)

7.2.3 HITACHI LTD (JAPAN)

7.2.4 CISCO SYSTEM, INC (U.S)

7.2.5 HEWLETT-PACKARD INC (U.S)

7.2.6 EMC CORPORATION (U.S)

7.2.7 CYRUSONE (U.S)

7.2.8 GLOBAL SWITCH (U.K)

7.2.9 DUPONT FABROS TECHNOLOGY (U.S)

7.2.10 TELEHOUSE (U.K)
โ€ƒ

LIST OF TABLES

TABLE 1 DATA CENTER MARKET, BY COMPONENT

TABLE 2 DATA CENTER MARKET, BY TECHNOLOGY

TABLE 3 DATA CENTER MARKET, BY APPLICATION

TABLE 4 DATA CENTER MARKET, BY REGION

TABLE 5 NORTH AMERICA DATA CENTER MARKET, BY COMPONENT

TABLE 6 NORTH AMERICA DATA CENTER MARKET, BY TECHNOLOGY

TABLE 7 NORTH AMERICA DATA CENTER MARKET, BY APPLICATION

TABLE 8 U.S. DATA CENTER MARKET, BY COMPONENT

TABLE 9 U.S. DATA CENTER MARKET, BY TECHNOLOGY

TABLE 10 U.S. DATA CENTER MARKET, BY APPLICATION

TABLE 11 CANADA DATA CENTER MARKET, BY COMPONENT

TABLE 12 CANADA DATA CENTER MARKET, BY TECHNOLOGY

TABLE 13 CANADA DATA CENTER MARKET, BY APPLICATION

TABLE 14 MEXICO DATA CENTER MARKET, BY COMPONENT

TABLE 15 MEXICO DATA CENTER MARKET, BY TECHNOLOGY

TABLE 16 MEXICO DATA CENTER MARKET, BY APPLICATION

TABLE 17 EUROPE DATA CENTER MARKET, BY COMPONENT

TABLE 18 EUROPE DATA CENTER MARKET, BY TECHNOLOGY

TABLE 19 EUROPE DATA CENTER MARKET, BY APPLICATION

TABLE 20 U.K. DATA CENTER MARKET, BY COMPONENT

TABLE 21 U.K. DATA CENTER MARKET, BY TECHNOLOGY

TABLE 22 U.K. DATA CENTER MARKET, BY APPLICATION

TABLE 23 GERMANY DATA CENTER MARKET, BY COMPONENT

TABLE 24 GERMANY DATA CENTER MARKET, BY TECHNOLOGY

TABLE 25 GERMANY DATA CENTER MARKET, BY APPLICATION

TABLE 26 FRANCE DATA CENTER MARKET, BY COMPONENT

TABLE 27 FRANCE DATA CENTER MARKET, BY TECHNOLOGY

TABLE 28 FRANCE DATA CENTER MARKET, BY APPLICATION

TABLE 29 ITALY DATA CENTER MARKET, BY COMPONENT

TABLE 30 ITALY DATA CENTER MARKET, BY TECHNOLOGY

TABLE 31 ITALY DATA CENTER MARKET, BY APPLICATION

TABLE 32 REST OF EUROPE DATA CENTER MARKET, BY COMPONENT

TABLE 33 REST OF EUROPE DATA CENTER MARKET, BY TECHNOLOGY

TABLE 34 REST OF EUROPE DATA CENTER MARKET, BY APPLICATION

TABLE 35 ASIA PACIFIC DATA CENTER MARKET, BY COMPONENT

TABLE 36 ASIA PACIFIC DATA CENTER MARKET, BY TECHNOLOGY

TABLE 37 ASIA PACIFIC DATA CENTER MARKET, BY APPLICATION

TABLE 38 CHINA DATA CENTER MARKET, BY COMPONENT

TABLE 39 CHINA DATA CENTER MARKET, BY TECHNOLOGY

TABLE 40 CHINA DATA CENTER MARKET, BY APPLICATION

TABLE 41 JAPAN DATA CENTER MARKET, BY COMPONENT

TABLE 42 JAPAN DATA CENTER MARKET, BY TECHNOLOGY

TABLE 43 JAPAN DATA CENTER MARKET, BY APPLICATION

TABLE 44 SOUTH KOREA DATA CENTER MARKET, BY COMPONENT

TABLE 45 SOUTH KOREA DATA CENTER MARKET, BY TECHNOLOGY

TABLE 46 SOUTH KOREA DATA CENTER MARKET, BY APPLICATION

TABLE 47 INDIA DATA CENTER MARKET, BY COMPONENT

TABLE 48 INDIA DATA CENTER MARKET, BY TECHNOLOGY

TABLE 49 INDIA DATA CENTER MARKET, BY APPLICATION

TABLE 50 REST OF ASIA PACIFIC DATA CENTER MARKET, BY COMPONENT

TABLE 51 REST OF ASIA PACIFIC DATA CENTER MARKET, BY TECHNOLOGY

TABLE 52 REST OF ASIA PACIFIC DATA CENTER MARKET, BY APPLICATION

TABLE 53 REST OF WORLD DATA CENTER MARKET, BY COMPONENT

TABLE 54 REST OF WORLD DATA CENTER MARKET, BY TECHNOLOGY

TABLE 55 REST OF WORLD DATA CENTER MARKET, BY APPLICATION

LIST OF FIGURES

FIGURE 1 RESEARCH COMPONENT

FIGURE 2 DATA CENTER MARKET, BY COMPONENT (%)

FIGURE 3 DATA CENTER MARKET, BY TECHNOLOGY (%)

FIGURE 4 DATA CENTER MARKET, BY APPLICATION (%)

FIGURE 5 DATA CENTER MARKET, BY REGION (%)

FIGURE 6 NORTH AMERICA DATA CENTER MARKET, BY COMPONENT (%)

FIGURE 7 NORTH AMERICA DATA CENTER MARKET, BY TECHNOLOGY (%)

FIGURE 8 NORTH AMERICA DATA CENTER MARKET, BY APPLICATION (%)

FIGURE 9 U.S. DATA CENTER MARKET, BY COMPONENT (%)

FIGURE 10 U.S. DATA CENTER MARKET, BY TECHNOLOGY (%)

FIGURE 11 U.S. DATA CENTER MARKET, BY APPLICATION (%)

FIGURE 12 CANADA DATA CENTER MARKET, BY COMPONENT (%)

FIGURE 13 CANADA DATA CENTER MARKET, BY TECHNOLOGY (%)

FIGURE 14 CANADA DATA CENTER MARKET, BY APPLICATION (%)

FIGURE 15 MEXICO DATA CENTER MARKET, BY COMPONENT (%)

FIGURE 16 MEXICO DATA CENTER MARKET, BY TECHNOLOGY (%)

FIGURE 17 EUROPE DATA CENTER MARKET, BY COMPONENT (%)

FIGURE 18 EUROPE DATA CENTER MARKET, BY TECHNOLOGY (%)

FIGURE 19 EUROPE DATA CENTER MARKET, BY APPLICATION (%)

FIGURE 20 U.K. DATA CENTER MARKET, BY COMPONENT (%)

FIGURE 21 U.K. DATA CENTER MARKET, BY TECHNOLOGY (%)

FIGURE 22 U.K. DATA CENTER MARKET, BY APPLICATION (%)

FIGURE 23 GERMANY DATA CENTER MARKET, BY COMPONENT (%)

FIGURE 24 GERMANY DATA CENTER MARKET, BY TECHNOLOGY (%)

FIGURE 25 GERMANY DATA CENTER MARKET, BY APPLICATION (%)

FIGURE 26 FRANCE DATA CENTER MARKET, BY COMPONENT (%)

FIGURE 27 FRANCE DATA CENTER MARKET, BY TECHNOLOGY (%)

FIGURE 28 FRANCE DATA CENTER MARKET, BY APPLICATION (%)

FIGURE 29 ITALY DATA CENTER MARKET, BY COMPONENT (%)

FIGURE 30 ITALY DATA CENTER MARKET, BY TECHNOLOGY (%)

FIGURE 31 ITALY DATA CENTER MARKET, BY DELIVERY MODEL (%)

FIGURE 32 ITALY DATA CENTER MARKET, BY ORGANIZATION SIZE (%)

FIGURE 33 ITALY DATA CENTER MARKET, BY APPLICATION (%)

FIGURE 34 REST OF EUROPE DATA CENTER MARKET, BY COMPONENT (%)

FIGURE 35 REST OF EUROPE DATA CENTER MARKET, BY TECHNOLOGY (%)

FIGURE 36 REST OF EUROPE DATA CENTER MARKET, BY APPLICATION (%)

FIGURE 37 ASIA PACIFIC DATA CENTER MARKET, BY COMPONENT (%)

FIGURE 38 ASIA PACIFIC DATA CENTER MARKET, BY TECHNOLOGY (%)

FIGURE 39 ASIA PACIFIC DATA CENTER MARKET, BY APPLICATION (%)

FIGURE 40 CHINA DATA CENTER MARKET, BY COMPONENT (%)

FIGURE 41 CHINA DATA CENTER MARKET, BY TECHNOLOGY (%)

FIGURE 42 CHINA DATA CENTER MARKET, BY APPLICATION (%)

FIGURE 43 JAPAN DATA CENTER MARKET, BY COMPONENT (%)

FIGURE 44 JAPAN DATA CENTER MARKET, BY TECHNOLOGY (%)

FIGURE 45 JAPAN DATA CENTER MARKET, BY APPLICATION (%)

FIGURE 46 SOUTH KOREA DATA CENTER MARKET, BY COMPONENT (%)

FIGURE 47 SOUTH KOREA DATA CENTER MARKET, BY TECHNOLOGY (%)

FIGURE 48 SOUTH KOREA DATA CENTER MARKET, BY APPLICATION (%)

FIGURE 49 INDIA DATA CENTER MARKET, BY COMPONENT (%)

FIGURE 50 INDIA DATA CENTER MARKET, BY TECHNOLOGY (%)

FIGURE 51 INDIA DATA CENTER MARKET, BY APPLICATION (%)

FIGURE 52 REST OF ASIA PACIFIC DATA CENTER MARKET, BY COMPONENT (%)

FIGURE 53 REST OF ASIA PACIFIC DATA CENTER MARKET, BY TECHNOLOGY (%)

FIGURE 54 REST OF ASIA PACIFIC DATA CENTER MARKET, BY APPLICATION (%)

FIGURE 55 REST OF WORLD DATA CENTER MARKET, BY COMPONENT (%)

FIGURE 56 REST OF WORLD DATA CENTER MARKET, BY TECHNOLOGY (%)

FIGURE 57 REST OF WORLD DATA CENTER MARKET, BY APPLICATION (%)

Purchase Option
Single User $ 4,950
Multiuser License $ 5,950
Enterprise User $ 7,250
Compare Licenses
Tailored for You
  • Dedicated Research on any specifics segment or region.
  • Focused Research on specific players in the market.
  • Custom Report based only on your requirements.
  • Flexibility to add or subtract any chapter in the study.
  • Historic data from 2014 and forecasts outlook till 2040.
  • Flexibility of providing data/insights in formats (PDF, PPT, Excel).
  • Provide cross segmentation in applicable scenario/markets.