ID: MRFR/ICT/9034-HCR | 100 Pages | Author: Ankit Gupta | November 2023
TABLE OF CONTENTS
1. EXECUTIVE SUMMARY
1.1. Market Attractiveness Analysis
1.1.1. Global Dark Fiber Market, By Fiber Type
1.1.2. Global Dark Fiber Market, ByNetwork Type
1.1.3. GlobalDark Fiber Market, By Application
1.1.4. GlobalDark Fiber Market, By Region
2. MARKET INTRODUCTION
2.1. Definition
2.2. Scope of the Study
2.3. Market Structure
3. RESEARCH METHODOLOGY
3.1. Research Process
3.2. Primary Research
3.3. Secondary Research
3.4. Market Size Estimation
3.5. List of Assumptions
4. MARKET DYNAMICS
4.1. Introduction
4.2. Drivers
4.2.1. Rising demand for high-speed connectivity
4.2.2. Increase in focus on outsourcing of network infrastructure
4.2.3. Rapidly expanding telecom industry
4.3. Restraint
4.3.1. Risk associated with physical damage of fiber
4.4. Opportunity
4.4.1. Surging demand for internet across the globe
4.5. Challenge
4.5.1. Difficult to find the physical damage of fiber
4.6. Impact of COVID-19
4.6.1. Impact on component manufacturers
4.6.2. Impact on IT industry
4.6.3. Impact on Telecom industry
5. MARKET FACTOR ANALYSIS
5.1. Value Chain Analysis/Supply Chain Analysis
5.2. Porterβs Five Forces Model
5.2.1. Bargaining Power of Suppliers
5.2.2. Bargaining Power of Buyers
5.2.3. Threat of New Entrants
5.2.4. Threat of Substitutes
5.2.5. Intensity of Rivalry
6. GLOBALDARK FIBER MARKET, BY FIBER TYPE
6.1. Introduction
6.2. Single Mode
6.3. Multi Mode
7. GLOBALDARK FIBER MARKET, BY NETWORK TYPE
7.1. Introduction
7.2. Metro
7.3. Long-haul
8. GLOBAL DARK FIBER MARKET, BY APPLICATION
8.1. Introduction
8.2. BFSI
8.3. IT & Telecom
8.4. Oil & Gas
8.5. Military & Aerospace
8.6. Healthcare
8.7. Government
8.8. Others
9. GLOBALDARK FIBER MARKET, BY REGION
9.1. Overview
9.2. North America
9.2.1. Market Size & Estimates, by Country, 2018β2026
9.2.2. Market Size & Estimates, by Fiber Type, 2018β2026
9.2.3. Market Size & Estimates, by Network Type, 2018β2026
9.2.4. Market Size & Estimates, by Application, 2018β2026
9.2.5. US
9.2.5.1. Market Size & Estimates, by Fiber Type, 2018β2026
9.2.5.2. Market Size & Estimates, by Network Type, 2018β2026
9.2.5.3. Market Size & Estimates, by Application, 2018β2026
9.2.6. Canada
9.2.6.1. Market Size & Estimates, by Fiber Type, 2018β2026
9.2.6.2. Market Size & Estimates, by Network Type, 2018β2026
9.2.6.3. Market Size & Estimates, by Application, 2018β2026
9.2.7. Mexico
9.2.7.1. Market Size & Estimates, by Fiber Type, 2018β2026
9.2.7.2. Market Size & Estimates, by Network Type, 2018β2026
9.2.7.3. Market Size & Estimates, by Application, 2018β2026
9.3. Europe
9.3.1. Market Size & Estimates, by Country, 2018β2026
9.3.2. Market Size & Estimates, by Fiber Type, 2018β2026
9.3.3. Market Size & Estimates, by Network Type, 2018β2026
9.3.4. Market Size & Estimates, by Application, 2018β2026
9.3.5. Germany
9.3.5.1. Market Size & Estimates, by Fiber Type, 2018β2026
9.3.5.2. Market Size & Estimates, by Network Type, 2018β2026
9.3.5.3. Market Size & Estimates, by Application, 2018β2026
9.3.6. UK
9.3.6.1. Market Size & Estimates, by Fiber Type, 2018β2026
9.3.6.2. Market Size & Estimates, by Network Type, 2018β2026
9.3.6.3. Market Size & Estimates, by Application, 2018β2026
9.3.7. France
9.3.7.1. Market Size & Estimates, by Fiber Type, 2018β2026
9.3.7.2. Market Size & Estimates, by Network Type, 2018β2026
9.3.7.3. Market Size & Estimates, by Application, 2018β2026
9.3.8. Rest of Europe
9.3.8.1. Market Size & Estimates, by Fiber Type, 2018β2026
9.3.8.2. Market Size & Estimates, by Network Type, 2018β2026
9.3.8.3. Market Size & Estimates, by Application, 2018β2026
9.4. Asia Pacific
9.4.1. Market Size & Estimates, by Country, 2018β2026
9.4.2. Market Size & Estimates, by Fiber Type, 2018β2026
9.4.3. Market Size & Estimates, by Network Type, 2018β2026
9.4.4. Market Size & Estimates, by Application, 2018β2026
9.4.5. China
9.4.5.1. Market Size & Estimates, by Fiber Type, 2018β2026
9.4.5.2. Market Size & Estimates, by Network Type, 2018β2026
9.4.5.3. Market Size & Estimates, by Application, 2018β2026
9.4.6. Japan
9.4.6.1. Market Size & Estimates, by Fiber Type, 2018β2026
9.4.6.2. Market Size & Estimates, by Network Type, 2018β2026
9.4.6.3. Market Size & Estimates, by Application, 2018β2026
9.4.7. India
9.4.7.1. Market Size & Estimates, by Fiber Type, 2018β2026
9.4.7.2. Market Size & Estimates, by Network Type, 2018β2026
9.4.7.3. Market Size & Estimates, by Application, 2018β2026
9.4.8. Rest of Asia-Pacific
9.4.8.1. Market Size & Estimates, by Fiber Type, 2018β2026
9.4.8.2. Market Size & Estimates, by Network Type, 2018β2026
9.4.8.3. Market Size & Estimates, by Application, 2018β2026
9.5. Middle East & Africa
9.5.1. Market Size & Estimates, by Fiber Type, 2018β2026
9.5.2. Market Size & Estimates, by Network Type, 2018β2026
9.5.3. Market Size & Estimates, by Application, 2018β2026
9.6. South America
9.6.1. Market Size & Estimates, by Fiber Type, 2018β2026
9.6.2. Market Size & Estimates, by Network Type, 2018β2026
9.6.3. Market Size & Estimates, by Application, 2018β2026
10. COMPETITIVE LANDSCAPE
10.1. Introduction
10.2. KeyPlayersMarket Share Analysis, 2019 (%)
10.3. Competitive Benchmarking
10.4. Competitor Dashboard
10.5. Major Growth Strategy in the market
10.6. Key Developments & Growth Strategies
10.6.1. New Product Development
10.6.2. Mergers & Acquisitions
10.6.3. Contracts & Agreements
11. COMPANY PROFILES
11.1. GTT Communications, Inc. (US)
11.1.1. Company Overview
11.1.2. Financial Overview
11.1.3. Products/Fiber Types/Solutions Offered
11.1.4. Key Developments
11.1.5. SWOT Analysis
11.1.6. Key Strategies
11.2. UFINET (Guatemala)
11.2.1. Company Overview
11.2.2. Financial Overview
11.2.3. Products/Fiber Types/Solutions Offered
11.2.4. Key Developments
11.2.5. SWOT Analysis
11.2.6. Key Strategies
11.3. Vikram Group (India)
11.3.1. Company Overview
11.3.2. Financial Overview
11.3.3. Products/Fiber Types/Solutions Offered
11.3.4. Key Developments
11.3.5. SWOT Analysis
11.3.6. Key Strategies
11.4. DEPL (India)
11.4.1. Company Overview
11.4.2. Financial Overview
11.4.3. Products/Fiber Types/Solutions Offered
11.4.4. Key Developments
11.4.5. SWOT Analysis
11.4.6. Key Strategies
11.5. Landmark Dividend LLC. (US)
11.5.1. Company Overview
11.5.2. Financial Overview
11.5.3. Products/Fiber Types/Solutions Offered
11.5.4. Key Developments
11.5.5. SWOT Analysis
11.5.6. Key Strategies
11.6. Unite Private Networks (US)
11.6.1. Company Overview
11.6.2. Financial Overview
11.6.3. Products/Fiber Types/Solutions Offered
11.6.4. Key Developments
11.6.5. SWOT Analysis
11.6.6. Key Strategies
11.7. Sterlite Power (India)
11.7.1. Company Overview
11.7.2. Financial Overview
11.7.3. Products/Fiber Types/Solutions Offered
11.7.4. Key Developments
11.7.5. SWOT Analysis
11.7.6. Key Strategies
11.8. Colt Technology Services Group Limited (UK)
11.8.1. Company Overview
11.8.2. Financial Overview
11.8.3. Products/Fiber Types/Solutions Offered
11.8.4. Key Developments
11.8.5. SWOT Analysis
11.8.6. Key Strategies
11.9. Consolidated Communications (US)
11.9.1. Company Overview
11.9.2. Financial Overview
11.9.3. Products/Fiber Types/Solutions Offered
11.9.4. Key Developments
11.9.5. SWOT Analysis
11.9.6. Key Strategies
11.10. Crown Castle (US)
11.10.1. Company Overview
11.10.2. Financial Overview
11.10.3. Products/Fiber Types/Solutions Offered
11.10.4. Key Developments
11.10.5. SWOT Analysis
11.10.6. Key Strategies
11.11. NexGen Networks (US)
11.11.1. Company Overview
11.11.2. Financial Overview
11.11.3. Products/Fiber Types/Solutions Offered
11.11.4. Key Developments
11.11.5. SWOT Analysis
11.11.6. Key Strategies
11.12. Sorrento Networks (US)
11.12.1. Company Overview
11.12.2. Financial Overview
11.12.3. Products/Fiber Types/Solutions Offered
11.12.4. Key Developments
11.12.5. SWOT Analysis
11.12.6. Key Strategies
11.13. FirstLight (US)
11.13.1. Company Overview
11.13.2. Financial Overview
11.13.3. Products/Fiber Types/Solutions Offered
11.13.4. Key Developments
11.13.5. SWOT Analysis
11.13.6. Key Strategies
11.14. Microscan (India)
11.14.1. Company Overview
11.14.2. Financial Overview
11.14.3. Products/Fiber Types/Solutions Offered
11.14.4. Key Developments
11.14.5. SWOT Analysis
11.14.6. Key Strategies
11.15. Windstream Intellectual Property Services, LLC. (US)
11.15.1. Company Overview
11.15.2. Financial Overview
11.15.3. Products/Fiber Types/Solutions Offered
11.15.4. Key Developments
11.15.5. SWOT Analysis
11.15.6. Key Strategies
LIST OF TABLES
TABLE 1 LIST OF ASSUMPTIONS
TABLE 2 GLOBAL DARK FIBERMARKET, BY FIBER TYPE, 2018β2026 (USD MILLION)
TABLE 3 GLOBAL DARK FIBERMARKET, BY NETWORK TYPE, 2018β2026 (USD MILLION)
TABLE 4 GLOBAL DARK FIBERMARKET, BY APPLICATION, 2018β2026 (USD MILLION)
TABLE 5 GLOBAL DARK FIBERMARKET, BY REGION, 2018β2026 (USD MILLION)
TABLE 6 NORTH AMERICA: DARK FIBERMARKET, BY COUNTRY, 2018β2026 (USD MILLION)
TABLE 7 NORTH AMERICA: DARK FIBERMARKET, BY FIBER TYPE, 2018β2026 (USD MILLION)
TABLE 8 NORTH AMERICA: DARK FIBERMARKET, BY NETWORK TYPE, 2018β2026 (USD MILLION)
TABLE 9 NORTH AMERICA: DARK FIBERMARKET, BY APPLICATION, 2018β2026 (USD MILLION)
TABLE 10 US: DARK FIBERMARKET, BY FIBER TYPE, 2018β2026 (USD MILLION)
TABLE 11 US: DARK FIBERMARKET, BY NETWORK TYPE, 2018β2026 (USD MILLION)
TABLE 12 US: DARK FIBERMARKET, BY APPLICATION, 2018β2026 (USD MILLION)
TABLE 13 CANADA: DARK FIBERMARKET, BY FIBER TYPE, 2018β2026 (USD MILLION)
TABLE 14 CANADA: DARK FIBERMARKET, BY NETWORK TYPE, 2018β2026 (USD MILLION)
TABLE 15 CANADA: DARK FIBERMARKET, BY APPLICATION, 2018β2026 (USD MILLION)
TABLE 16 MEXICO: DARK FIBER MARKET, BY FIBER TYPE, 2018β2026 (USD MILLION)
TABLE 17 MEXICO: DARK FIBER MARKET, BY NETWORK TYPE, 2018β2026 (USD MILLION)
TABLE 18 MEXICO: DARK FIBER MARKET, BY APPLICATION, 2018β2026 (USD MILLION)
TABLE 19 EUROPE: DARK FIBER MARKET, BY COUNTRY, 2018β2026 (USD MILLION)
TABLE 20 EUROPE: DARK FIBER MARKET, BY FIBER TYPE, 2018β2026 (USD MILLION)
TABLE 21 EUROPE: DARK FIBER MARKET, BY NETWORK TYPE, 2018β2026 (USD MILLION)
TABLE 22 EUROPE: DARK FIBER MARKET, BY APPLICATION, 2018β2026 (USD MILLION)
TABLE 23 UK: DARK FIBER MARKET, BY FIBER TYPE, 2018β2026 (USD MILLION)
TABLE 24 UK: DARK FIBER MARKET, BY NETWORK TYPE, 2018β2026 (USD MILLION)
TABLE 25 UK: DARK FIBER MARKET, BY APPLICATION, 2018β2026 (USD MILLION)
TABLE 26 GERMANY: DARK FIBER MARKET, BY FIBER TYPE, 2018β2026 (USD MILLION)
TABLE 27 GERMANY: DARK FIBER MARKET, BY NETWORK TYPE, 2018β2026 (USD MILLION)
TABLE 28 GERMANY: DARK FIBER MARKET, BY APPLICATION, 2018β2026 (USD MILLION)
TABLE 29 FRANCE: DARK FIBER MARKET, BY FIBER TYPE, 2018β2026 (USD MILLION)
TABLE 30 FRANCE: DARK FIBER MARKET, BY NETWORK TYPE, 2018β2026 (USD MILLION)
TABLE 31 FRANCE: DARK FIBER MARKET, BY APPLICATION, 2018β2026 (USD MILLION)
TABLE 32 REST OF EUROPE: DARK FIBER MARKET, BY FIBER TYPE, 2018β2026 (USD MILLION)
TABLE 33 REST OF EUROPE: DARK FIBER MARKET, BY NETWORK TYPE, 2018β2026 (USD MILLION)
TABLE 34 REST OF EUROPE: DARK FIBER MARKET, BY APPLICATION, 2018β2026 (USD MILLION)
TABLE 35 ASIA-PACIFIC: DARK FIBER MARKET, BY COUNTRY, 2018β2026 (USD MILLION)
TABLE 36 ASIA-PACIFIC: DARK FIBER MARKET, BY FIBER TYPE, 2018β2026 (USD MILLION)
TABLE 37 ASIA-PACIFIC: DARK FIBER MARKET, BY NETWORK TYPE, 2018β2026 (USD MILLION)
TABLE 38 ASIA-PACIFIC: DARK FIBER MARKET, BY APPLICATION, 2018β2026 (USD MILLION)
TABLE 39 CHINA: DARK FIBER MARKET, BY FIBER TYPE, 2018β2026 (USD MILLION)
TABLE 40 CHINA: DARK FIBER MARKET, BY NETWORK TYPE, 2018β2026 (USD MILLION)
TABLE 41 CHINA: DARK FIBER MARKET, BY APPLICATION, 2018β2026 (USD MILLION)
TABLE 42 INDIA: DARK FIBER MARKET, BY FIBER TYPE, 2018β2026 (USD MILLION)
TABLE 43 INDIA: DARK FIBER MARKET, BY NETWORK TYPE, 2018β2026 (USD MILLION)
TABLE 44 INDIA: DARK FIBER MARKET, BY APPLICATION, 2018β2026 (USD MILLION)
TABLE 45 JAPAN: DARK FIBER MARKET, BY FIBER TYPE, 2018β2026 (USD MILLION)
TABLE 46 JAPAN: DARK FIBER MARKET, BY NETWORK TYPE, 2018β2026 (USD MILLION)
TABLE 47 JAPAN: DARK FIBER MARKET, BY APPLICATION, 2018β2026 (USD MILLION)
TABLE 48 REST OF ASIA-PACIFIC: DARK FIBER MARKET, BY FIBER TYPE, 2018β2026 (USD MILLION)
TABLE 49 REST OF ASIA-PACIFIC: DARK FIBER MARKET, BY NETWORK TYPE, 2018β2026 (USD MILLION)
TABLE 50 REST OF ASIA-PACIFIC: DARK FIBER MARKET, BY APPLICATION, 2018β2026 (USD MILLION)
TABLE 51 MIDDLE EAST AND AFRICA: DARK FIBER MARKET, BY FIBER TYPE, 2018β2026 (USD MILLION)
TABLE 52 MIDDLE EAST AND AFRICA: DARK FIBER MARKET, BY NETWORK TYPE, 2018β2026 (USD MILLION)
TABLE 53 MIDDLE EAST AND AFRICA: DARK FIBER MARKET, BY APPLICATION, 2018β2026 (USD MILLION)
TABLE 54 SOUTH AMERICA: DARK FIBER MARKET, BY FIBER TYPE, 2018β2026 (USD MILLION)
TABLE 55 SOUTH AMERICA: DARK FIBER MARKET, BY NETWORK TYPE, 2018β2026 (USD MILLION)
TABLE 56 SOUTH AMERICA: DARK FIBER MARKET, BY APPLICATION, 2018β2026 (USD MILLION)
LIST OF FIGURES
FIGURE 1 MARKET SYNOPSIS
FIGURE 2 RESEARCH PROCESS OF MRFR
FIGURE 3 TOP DOWN & BOTTOM-UP APPROACH
FIGURE 4 GLOBAL DARK FIBER MARKET, BY FIBER TYPE, 2018β2026 (USD MILLION)
FIGURE 5 GLOBAL DARK FIBER MARKET, BY NETWORK TYPE, 2018β2026 (USD MILLION)
FIGURE 6 GLOBAL DARK FIBER MARKET, BY APPLICATION, 2018β2026 (USD MILLION)
FIGURE 7 GLOBAL DARK FIBER MARKET, BY REGION, 2018&2026 (USD MILLION)
FIGURE 8 NORTH AMERICA: DARK FIBER MARKET, BY COUNTRY, 2018β2026 (USD MILLION)
FIGURE 9 NORTH AMERICA: DARK FIBER MARKET, BY FIBER TYPE, 2018β2026 (USD MILLION)
FIGURE 10 NORTH AMERICA: DARK FIBER MARKET, BY NETWORK TYPE, 2018β2026 (USD MILLION)
FIGURE 11 NORTH AMERICA: DARK FIBER MARKET, BY APPLICATION, 2018β2026 (USD MILLION)
FIGURE 12 EUROPE: DARK FIBER MARKET, BY COUNTRY, 2018β2026 (USD MILLION)
FIGURE 13 EUROPE: DARK FIBER MARKET, BY FIBER TYPE, 2018β2026 (USD MILLION)
FIGURE 14 EUROPE: DARK FIBER MARKET, BY NETWORK TYPE, 2018β2026 (USD MILLION)
FIGURE 15 EUROPE: DARK FIBER MARKET, BY APPLICATION, 2018β2026 (USD MILLION)
FIGURE 16 ASIA-PACIFIC: DARK FIBER MARKET, BY COUNTRY, 2018β2026 (USD MILLION)
FIGURE 17 ASIA-PACIFIC: DARK FIBER MARKET, BY FIBER TYPE, 2018β2026 (USD MILLION)
FIGURE 18 ASIA-PACIFIC: DARK FIBER MARKET, BY NETWORK TYPE, 2018β2026 (USD MILLION)
FIGURE 19 ASIA-PACIFIC: DARK FIBER MARKET, BY APPLICATION, 2018β2026 (USD MILLION)
FIGURE 20 MIDDLE EAST AND AFRICA: DARK FIBER MARKET, BY FIBER TYPE, 2018β2026 (USD MILLION)
FIGURE 21 MIDDLE EAST AND AFRICA: DARK FIBER MARKET, BY NETWORK TYPE, 2018β2026 (USD MILLION)
FIGURE 22 MIDDLE EAST AND AFRICA: DARK FIBER MARKET, BY APPLICATION, 2018β2026 (USD MILLION)
FIGURE 23 SOUTH AMERICA: DARK FIBER MARKET, BY FIBER TYPE, 2018β2026 (USD MILLION)
FIGURE 24 SOUTH AMERICA: DARK FIBER MARKET, BY NETWORK TYPE, 2018β2026 (USD MILLION)
FIGURE 25 SOUTH AMERICA: DARK FIBER MARKET, BY APPLICATION, 2018β2026 (USD MILLION)
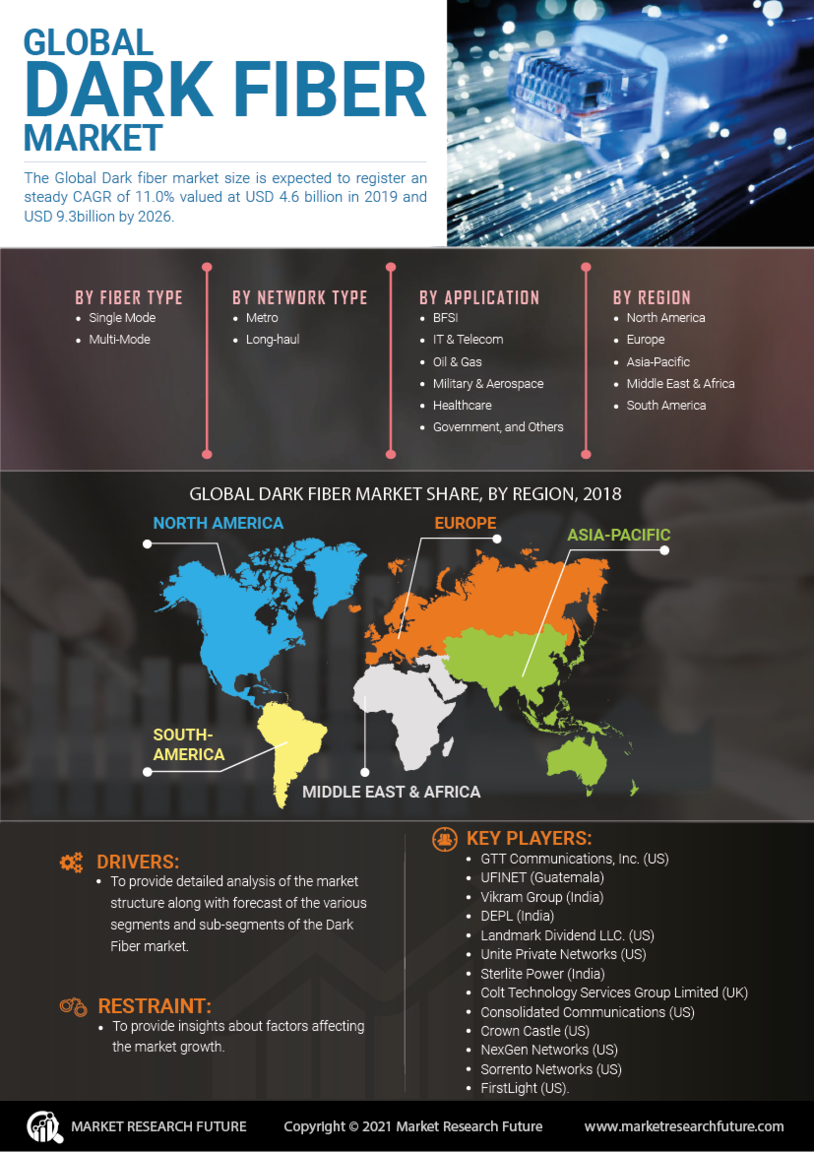
Dark Fiber Market Segmentation
Dark Fiber Market by Vertical Product Outlook (USD Billion, 2023-2030)
Single-Mode
Multi-Mode
Dark Fiber Market by Network Outlook (USD Billion, 2023-2030)
Metro
Long-Haul
Dark Fiber Market by Application Outlook (USD Billion, 2023-2030)
Telecom
Oil & Gas
BFSI
Military & Defense
Medical
Railway
Others
Dark Fiber Market Regional Outlook (USD Billion, 2023-2030)
North America Outlook (USD Billion, 2023-2030)
North America Dark Fiber Market by Vertical Product
Single-Mode
Multi-Mode
North America Dark Fiber Market by Network
Metro
Long-Haul
North America Dark Fiber Market by Application
Telecom
Oil & Gas
BFSI
Military & Defense
Medical
Railway
Others
US Outlook (USD Billion, 2023-2030)
US Dark Fiber Market by Vertical Product
Single-Mode
Multi-Mode
US Dark Fiber Market by Network
Metro
Long-Haul
US Dark Fiber Market by Application
Telecom
Oil & Gas
BFSI
Military & Defense
Medical
Railway
Others
CANADA Outlook (USD Billion, 2023-2030)
CANADA Dark Fiber Market by Vertical Product
Single-Mode
Multi-Mode
CANADA Dark Fiber Market by Network
Metro
Long-Haul
CANADA Dark Fiber Market by Application
Telecom
Oil & Gas
BFSI
Military & Defense
Medical
Railway
Others
Europe Outlook (USD Billion, 2023-2030)
Europe Dark Fiber Market by Vertical Product
Single-Mode
Multi-Mode
Europe Dark Fiber Market by Network
Metro
Long-Haul
Europe Dark Fiber Market by Application
Telecom
Oil & Gas
BFSI
Military & Defense
Medical
Railway
Others
Germany Outlook (USD Billion, 2023-2030)
Germany Dark Fiber Market by Vertical Product
Single-Mode
Multi-Mode
Germany Dark Fiber Market by Network
Metro
Long-Haul
Germany Dark Fiber Market by Application
Telecom
Oil & Gas
BFSI
Military & Defense
Medical
Railway
Others
France Outlook (USD Billion, 2023-2030)
France Dark Fiber Market by Vertical Product
Single-Mode
Multi-Mode
France Dark Fiber Market by Network
Metro
Long-Haul
France Dark Fiber Market by Application
Telecom
Oil & Gas
BFSI
Military & Defense
Medical
Railway
Others
UK Outlook (USD Billion, 2023-2030)
UK Dark Fiber Market by Vertical Product
Single-Mode
Multi-Mode
UK Dark Fiber Market by Network
Metro
Long-Haul
UK Dark Fiber Market by Application
Telecom
Oil & Gas
BFSI
Military & Defense
Medical
Railway
Others
ITALY Outlook (USD Billion, 2023-2030)
ITALY Dark Fiber Market by Vertical Product
Single-Mode
Multi-Mode
ITALY Dark Fiber Market by Network
Metro
Long-Haul
ITALY Dark Fiber Market by Application
Telecom
Oil & Gas
BFSI
Military & Defense
Medical
Railway
Others
SPAIN Outlook (USD Billion, 2023-2030)
Spain Dark Fiber Market by Vertical Product
Single-Mode
Multi-Mode
Spain Dark Fiber Market by Network
Metro
Long-Haul
Spain Dark Fiber Market by Application
Telecom
Oil & Gas
BFSI
Military & Defense
Medical
Railway
Others
Rest Of Europe Outlook (USD Billion, 2023-2030)
Rest Of Europe Dark Fiber Market by Vertical Product
Single-Mode
Multi-Mode
REST OF EUROPE Dark Fiber Market by Network
Metro
Long-Haul
REST OF EUROPE Dark Fiber Market by Application
Telecom
Oil & Gas
BFSI
Military & Defense
Medical
Railway
Others
Asia-Pacific Outlook (USD Billion, 2023-2030)
Asia-Pacific Dark Fiber Market by Vertical Product
Single-Mode
Multi-Mode
Asia-Pacific Dark Fiber Market by Network
Metro
Long-Haul
Asia-Pacific Dark Fiber Market by Application
Telecom
Oil & Gas
BFSI
Military & Defense
Medical
Railway
Others
China Outlook (USD Billion, 2023-2030)
China Dark Fiber Market by Vertical Product
Single-Mode
Multi-Mode
China Dark Fiber Market by Network
Metro
Long-Haul
China Dark Fiber Market by Application
Telecom
Oil & Gas
BFSI
Military & Defense
Medical
Railway
Others
Japan Outlook (USD Billion, 2023-2030)
Japan Dark Fiber Market by Vertical Product
Single-Mode
Multi-Mode
Japan Dark Fiber Market by Network
Metro
Long-Haul
Japan Dark Fiber Market by Application
Telecom
Oil & Gas
BFSI
Military & Defense
Medical
Railway
Others
India Outlook (USD Billion, 2023-2030)
India Dark Fiber Market by Vertical Product
Single-Mode
Multi-Mode
India Dark Fiber Market by Network
Metro
Long-Haul
India Dark Fiber Market by Application
Telecom
Oil & Gas
BFSI
Military & Defense
Medical
Railway
Others
Australia Outlook (USD Billion, 2023-2030)
Australia Dark Fiber Market by Vertical Product
Single-Mode
Multi-Mode
Australia Dark Fiber Market by Network
Metro
Long-Haul
Australia Dark Fiber Market by Application
Telecom
Oil & Gas
BFSI
Military & Defense
Medical
Railway
Others
South Korea Outlook (USD Billion, 2023-2030)
South Korea Dark Fiber Market by Vertical Product
Single-Mode
Multi-Mode
South Korea Dark Fiber Market by Network
Metro
Long-Haul
South Korea Dark Fiber Market by Application
Telecom
Oil & Gas
BFSI
Military & Defense
Medical
Railway
Others
Rest of Asia-Pacific Outlook (USD Billion, 2023-2030)
Rest of Asia-Pacific Dark Fiber Market by Vertical Product
Single-Mode
Multi-Mode
Rest of Asia-Pacific Dark Fiber Market by Network
Metro
Long-Haul
Rest of Asia-Pacific Dark Fiber Market by Application
Telecom
Oil & Gas
BFSI
Military & Defense
Medical
Railway
Others
Rest of the World Outlook (USD Billion, 2023-2030)
Rest of the World Dark Fiber Market by Vertical Product
Single-Mode
Multi-Mode
Rest of the World Dark Fiber Market by Network
Metro
Long-Haul
Rest of the World Dark Fiber Market by Application
Telecom
Oil & Gas
BFSI
Military & Defense
Medical
Railway
Others
Middle East Outlook (USD Billion, 2023-2030)
Middle East Dark Fiber Market by Vertical Product
Single-Mode
Multi-Mode
Middle East Dark Fiber Market by Network
Metro
Long-Haul
Middle East Dark Fiber Market by Application
Telecom
Oil & Gas
BFSI
Military & Defense
Medical
Railway
Others
Africa Outlook (USD Billion, 2023-2030)
Africa Dark Fiber Market by Vertical Product
Single-Mode
Multi-Mode
Africa Dark Fiber Market by Network
Metro
Long-Haul
Africa Dark Fiber Market by Application
Telecom
Oil & Gas
BFSI
Military & Defense
Medical
Railway
Others
Latin America Outlook (USD Billion, 2023-2030)
Latin America Dark Fiber Market by Vertical Product
Single-Mode
Multi-Mode
Latin America Dark Fiber Market by Network
Metro
Long-Haul
Latin America Dark Fiber Market by Application
Telecom
Oil & Gas
BFSI
Military & Defense
Medical
Railway
Others
Research Methodology on Dark Fiber Market
Executive Summary
This research report carries out a detailed research methodology to analyse the global dark fiber market from 2023 to 2030. Dark Fiber provides fundamental infrastructure for optical networks and is largely used for data transmission and communication. An internal rate of return approach has been adopted to provide specific insights into the current situation, future trends, and the most profitable companies in the dark fiber market. Several market strategies have been adopted to assess the potential of the dark fiber market.
Introduction
Dark Fiber is a significant component of communication networks, as they are used to transfer data and provide data storage. They are useful in telecommunication services, such as optical networks. They have become essential to the development and operation of communications networks; optical networks are reliable in data transmission and communication infrastructure, which is necessary for exchanging information between distant sites and within different networks. The increasing demand for efficient data transfer and storage solutions has resulted in the adoption of dark fiber networks to meet the requirements.
Due to the effectiveness of dark fiber networks, the demand for dark fiber services has increased as well. The global market for dark fiber is increasing due to the advancement in technology, the increasing demand for more efficient solutions for data transfer, and the need for reliable communication systems. According to the research conducted by Market Research Future (MRF), the market for dark fiber is expected to grow exponentially during the period 2023-2030.
Research Methodology
The research methods used for the analysis of the global dark fiber market for 2023-2030 were internal rate of return (IRR) and market evaluation methods. The IRR method was used to compare the operating costs and benefits of dark fiber companies, while the market evaluation methods were used to assess the potential of the market and understand the drivers behind its growth.
Internal Rate of Return Approach
At the centre of this research methodology was the internal rate of return (IRR) approach. This approach is used to both compare the returns of dark fiber companies in terms of cost and benefits. It is a commonly used method of evaluating the potential of investments in several activities, including business operations and capital projects. To do this, the IRR methodology was applied to the data gathered on the dark fiber companies. The IRR for each dark fiber company was calculated by adjusting for factors such as revenue and operating costs.
Market Evaluation Methods
The evaluation method is used to assess the potential of a market, gain insight into the trends, and identify the market drivers. To understand the growth of the dark fiber market, both top-down and bottom-up methods were used.
Top-down Method
The top-down method is used to assess the potential of a market by using the general financial data available. It also involves the analysis of the macroeconomic environment, including the political and economic policies, market size, and the demand for dark fiber services.
Bottom-up Method
The bottom-up method is used to assess the potential of a market by analyzing the available data from the various companies providing dark fiber services. This includes the financial statements, the companyβs strategies, the entry barriers, and the competitive landscape.
Data Collection and Analysis
Once the methodologies are selected, the data is collected and analyzed. Data was collected from a variety of sources, including government documents, industry reports of dark fiber companies, press releases, and financial statements. Data is also collected from interviews with industry experts and market leaders. Furthermore, secondary data is collected from publications, websites, and other sources.
Once the data had been collected, it was analyzed using descriptive statistics and univariate analysis. This included analyzing the profitability of the dark fiber companies, the entry barriers, the competitive landscape, and the market drivers.
Conclusion
The research methodology used to analyze the global dark fiber market for 2023-2027 used both internal rates of return and market evaluation methods. IRR was used to compare returns of dark fiber companies in terms of cost and benefits, while the market evaluation methods were used to assess the potential of the market and identify the drivers behind its growth. Data was collected from a variety of sources and analyzed using descriptive statistics and univariate analysis to assess the profitability of the dark fiber companies, the entry barriers, the competitive landscape, and the market drivers.