ID: MRFR/A&D/6054-HCR | February 2021 | Region: Global | 133 pages
Market Scenario
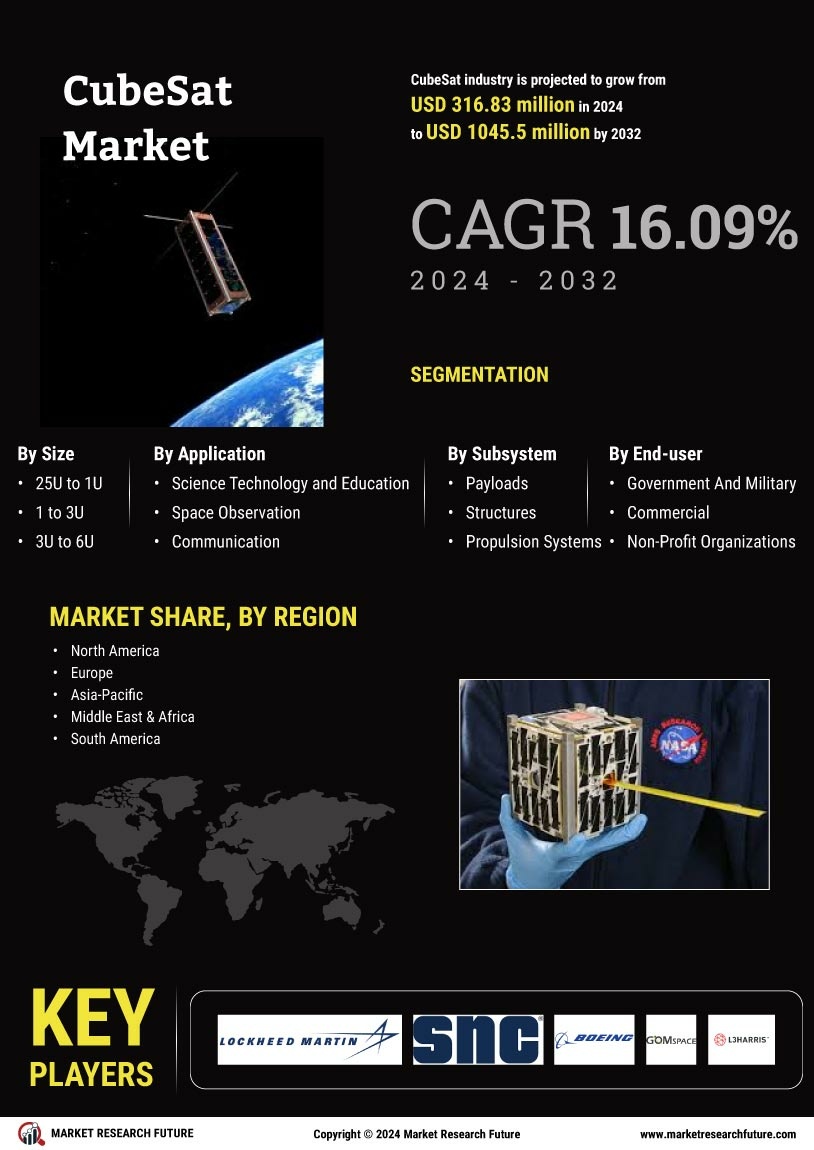
CubeSats are miniature satellites that weigh less than 1.33 kgs per unit and assist in various activities, such as space research and earth observation. These satellites offer various benefits to users such as easy construction of satellites, cost-effectiveness, and lightweight. Such benefits offered by CubeSats are fueling the market growth.
Factors such as increased adoption of CubeSats for various other applications, such as traffic monitoring and commercial industries such as oil & gas and agriculture, are expected to bolster the market growth. Additionally, these satellites are less expensive and lightweight as compared to conventional satellites, which make them favorable to scientists. Therefore, the growth of the CubeSat market is expected to propel throughout the forecast period.
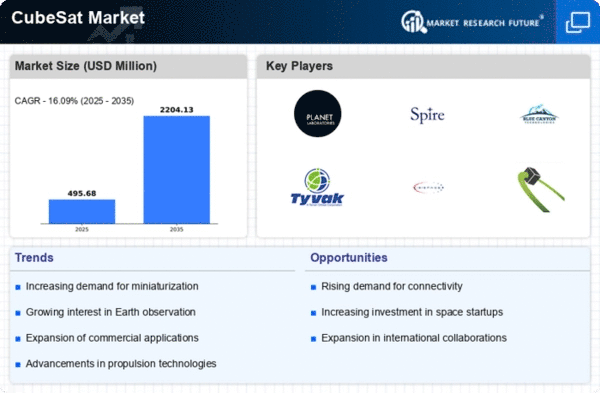
The global CubeSat market is estimated to register a CAGR of nearly 19.83% during the forecast period from 2018 to 2023.
Segmentation of the Global CubeSat Market
Based on size, the 3U (4.0 kg to 6.0 kg) segment is anticipated to witness the highest CAGR over the forecast period. High adoption rate of these systems for various applications, such as meteorology, disaster management, remote sensing, and military intelligence are expected to drive the market.
On the basis of subsystem, the payloads segment is anticipated to lead and grow at the highest CAGR over the forecast period. Payloads provide orbital maneuvering capability that enables scientists in experiencing enhanced space observation. Based on application, earth observation & traffic monitoring segment is anticipated to grow at the highest CAGR over the forecast period. Growing demand for earth imaging and real-time data are bolstering market growth. On the basis of the end user, the commercial segment is anticipated to grow at the highest CAGR over the forecast period. Increased adoption CubeSats for commercial purposes such as crop monitoring, fleet management, and logistics tracking are fueling the market growth.
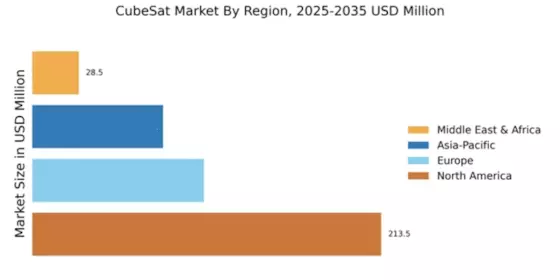
North America is estimated to account for the largest share during the review period. Presence of prominent players such as Lockheed Martin Corporation and Sierra Nevada Corporation are expected to bolster the market growth. Furthermore, stringent government regulations pertaining to manufacturing and launching of CubeSats are boosting the market growth in the region.
Intended Audience
Satellite manufacturers
Space organizations
Government authorities
Defense companies
Research Institutes
Regulatory bodies
Key Players
The key players in the global CubeSat market are Lockheed Martin Corporation (US), Sierra Nevada Corporation (US), The Boeing Company (US), GomSpace (Denmark), Harris Corporation (US), OHB SE (Germany), Capella Space (US), Clyde Space Ltd (UK), Airbus S.A.S (The Netherlands), Tyvak Nano-Satellite Systems, Inc. (US), Busek Co. Inc. (US), CU Aerospace, L.L.C. (US), MAXAR TECHNOLOGIES (US), EnduroSat (Bulgaria), and Planet Labs Inc. (US).
Research Methodology
The market numbers and forecast derived were the outcomes of our disciplined research methodology that includes secondary research, primary interviews, followed by data triangulation and validation from our in-house data repository and statistical modeling tools.
Secondary Research
In this process, the data collection was done through various secondary sources, which included annual reports, SEC filings, journals, government association, aerospace & defense magazines, white papers, corporate presentations, company websites, some paid databases, and others.
Primary Research
In this process, both the demand side and supply side parties were involved in extracting genuine facts and insights about the market forecast, production, trend, and projected market growth. Industry stakeholders such as CEOs, VPs, directors, and marketing executives across the value chain have been approached to obtain key information.
Report Key Insights
Market Sizing, Forecast, and Analysis: Detailed coverage on market segment and its sub-segments
Regional / Country Trend and Forecast: Detailed analysis on North America, Asia-Pacific, Europe, Middle East & Africa, and Latin America, along with key countries in each of the regions
Market dynamics intelligence: Market drivers, opportunities, trends, restraints, Porter’s five forces, supply chain & value chain analysis
Technology Trend, Regulatory Landscape, and Patent Analysis Outlook
Competitive Intelligence: Market share analysis, financial analysis, product benchmarking, strategic developments including JVs, Product Launch, and M&A
Regional attractiveness and related growth opportunities
Report Customization
MRFR offers report customization to our valued customers. Below are the options available for customization:
Company Profiles
In-depth profiling of additional market players (3 to 4 companies)
Country Level Analysis
Detailed analysis of a country and its related segment as per the report scope (subject to data availability)
Frequently Asked Questions (FAQ) :
Global CubeSat Market is projected to register a CAGR of 19.83%.
Global CubeSat Market’s revenue will be USD 8 billion by the end of 2023.
The major factors liable for the growth of the market is increased adoption of CubeSats for various applications, such as traffic monitoring and commercial industries such as oil & gas and agriculture, are expected to bolster the market growth.
The emerging regions such as North America, Europe, South Africa, China, and South Korea are to drive the growth for the 3D printing filament market.
Harris Corporation, Capella Space, OHB SE, Airbus S.A.S, Clyde Space Ltd are some of the key players of the Global CubeSat Market.
Table of Contents
1. Executive Summary
1.1. Market Attractiveness Analysis
1.1.1. Global CubeSat Market, By Size
1.1.2. Global CubeSat Market, By Subsystem
1.1.3. Global CubeSat Market, By Application
1.1.4. Global CubeSat Market, By End User
1.1.5. Global CubeSat Market, By Region
2. Market Introduction
2.1. Market Definition
2.2. Scope of the Study
2.3. Market Structure
2.4. Key Buying Criteria
2.5. Market Factor Indicator Analysis
3. Research Methodology
3.1. Research Process
3.2. Primary Research
3.3. Secondary Research
3.4. Market Size Estimation
3.5. Forecast Model
3.6. List of Assumptions
4. Market Insights
5. Market Dynamics
5.1. Introduction
5.2. Drivers
5.3. Restraints
5.4. Opportunities
5.5. Challenges
5.6. Market/Technological Trends
5.7. Patent Trends
5.8. Regulatory Landscape/Standards
6. Market Factor Analysis
6.1. Value Chain/Supply Chain Analysis
6.1.1. R&D
6.1.2. Manufacturing
6.1.3. Distribution & Sales
6.1.4. Post-Sales Monitoring
6.2. Porter’s Five Forces Analysis
6.2.1. Threat of New Entrants
6.2.2. Bargaining Power of Buyers
6.2.3. Threat of Substitutes
6.2.4. Competitive Rivalry
6.2.5. Bargaining Power of Supplies
7. Global CubeSat Market, by Size
7.1. Introduction
7.2. 0.25u-1U (Up to 2.0 Kg)
7.2.1. Market Estimates & Forecast, 2018–2023
7.2.2. Market Estimates & Forecast, by Region, 2018–2023
7.3. 2U (2.0 Kg to 4.0 Kg)
7.3.1. Market Estimates & Forecast, 2018–2023
7.3.2. Market Estimates & Forecast, by Region, 2018–2023
7.4. 3U (4.0 Kg to 6.0 Kg)
7.4.1. Market Estimates & Forecast, 2018–2023
7.4.2. Market Estimates & Forecast, by Region, 2018–2023
7.5. 6U (6.0 Kg to 12.0 Kg)
7.5.1. Market Estimates & Forecast, 2018–2023
7.5.2. Market Estimates & Forecast, by Region, 2018–2023
7.6. 12U (Above 12.0 Kg)
7.6.1. Market Estimates & Forecast, 2018–2023
7.6.2. Market Estimates & Forecast, by Region, 2018–2023
7.7. >12 U
7.7.1. Market Estimates & Forecast, 2018–2023
7.7.2. Market Estimates & Forecast, by Region, 2018–2023
8. Global CubeSat Market, by Subsystem
8.1. Introduction
8.2. Payloads
8.2.1. Market Estimates & Forecast, 2018–2023
8.2.2. Market Estimates & Forecast, by Region, 2018–2023
8.3. Structures
8.3.1. Market Estimates & Forecast, 2018–2023
8.3.2. Market Estimates & Forecast, by Region, 2018–2023
8.4. Electrical Power Systems
8.4.1. Market Estimates & Forecast, 2018–2023
8.4.2. Market Estimates & Forecast, by Region, 2018–2023
8.5. Command & Data Handling
8.5.1. Market Estimates & Forecast, 2018–2023
8.5.2. Market Estimates & Forecast, by Region, 2018–2023
8.6. Propulsion Systems
8.6.1. Market Estimates & Forecast, 2018–2023
8.6.2. Market Estimates & Forecast, by Region, 2018–2023
8.7. Attitude Determination & Control Systems
8.7.1. Market Estimates & Forecast, 2018–2023
8.7.2. Market Estimates & Forecast, by Region, 2018–2023
8.8. Others
8.8.1. Market Estimates & Forecast, 2018–2023
8.8.2. Market Estimates & Forecast, by Region, 2018–2023
9. Global CubeSat Market, by Application
9.1. Introduction
9.2. Earth Observation & Traffic Monitoring
9.2.1. Market Estimates & Forecast, 2018–2023
9.2.2. Market Estimates & Forecast, by Region, 2018–2023
9.3. Space Observation
9.3.1. Market Estimates & Forecast, 2018–2023
9.3.2. Market Estimates & Forecast, by Region, 2018–2023
9.4. Meteorology
9.4.1. Market Estimates & Forecast, 2018–2023
9.4.2. Market Estimates & Forecast, by Region, 2018–2023
9.5. Communication
9.5.1. Market Estimates & Forecast, 2018–2023
9.5.2. Market Estimates & Forecast, by Region, 2018–2023
9.6. Science & Technology and Education
9.6.1. Market Estimates & Forecast, 2018–2023
9.6.2. Market Estimates & Forecast, by Region, 2018–2023
10. Global CubeSat Market, by End User
10.1. Introduction
10.2. Commercial
10.2.1. Market Estimates & Forecast, 2018–2023
10.2.2. Market Estimates & Forecast, by Region, 2018–2023
10.3. Government & Military
10.3.1. Market Estimates & Forecast, 2018–2023
10.3.2. Market Estimates & Forecast, by Region, 2018–2023
10.4. Non-Profit Organizations
10.4.1. Market Estimates & Forecast, 2018–2023
10.4.2. Market Estimates & Forecast, by Region, 2018–2023
11. Global CubeSat Market, by Region
11.1. Introduction
11.2. North America
11.2.1. Market Estimates & Forecast, by Country, 2018–2023
11.2.2. Market Estimates & Forecast, by Size, 2018–2023
11.2.3. Market Estimates & Forecast, by Subsystem, 2018–2023
11.2.4. Market Estimates & Forecast, by Application, 2018–2023
11.2.5. Market Estimates & Forecast, by End User, 2018–2023
11.2.6. US
11.2.6.1. Market Estimates & Forecast, by Size, 2018–2023
11.2.6.2. Market Estimates & Forecast, by Subsystem, 2018–2023
11.2.6.3. Market Estimates & Forecast, by Application, 2018–2023
11.2.6.4. Market Estimates & Forecast, by End User, 2018–2023
11.2.7. Canada
11.2.7.1. Market Estimates & Forecast, by Size, 2018–2023
11.2.7.2. Market Estimates & Forecast, by Subsystem, 2018–2023
11.2.7.3. Market Estimates & Forecast, by Application, 2018–2023
11.2.7.4. Market Estimates & Forecast, by End User, 2018–2023
11.3. Europe
11.3.1. Market Estimates & Forecast, by Country, 2018–2023
11.3.2. Market Estimates & Forecast, by Size, 2018–2023
11.3.3. Market Estimates & Forecast, by Subsystem, 2018–2023
11.3.4. Market Estimates & Forecast, by Application, 2018–2023
11.3.5. Market Estimates & Forecast, by End User, 2018–2023
11.3.6. UK
11.3.6.1. Market Estimates & Forecast, by Size, 2018–2023
11.3.6.2. Market Estimates & Forecast, by Subsystem, 2018–2023
11.3.6.3. Market Estimates & Forecast, by Application, 2018–2023
11.3.6.4. Market Estimates & Forecast, by End User, 2018–2023
11.3.7. Germany
11.3.7.1. Market Estimates & Forecast, by Size, 2018–2023
11.3.7.2. Market Estimates & Forecast, by Subsystem, 2018–2023
11.3.7.3. Market Estimates & Forecast, by Application, 2018–2023
11.3.7.4. Market Estimates & Forecast, by End User, 2018–2023
11.3.8. France
11.3.8.1. Market Estimates & Forecast, by Size, 2018–2023
11.3.8.2. Market Estimates & Forecast, by Subsystem, 2018–2023
11.3.8.3. Market Estimates & Forecast, by Application, 2018–2023
11.3.8.4. Market Estimates & Forecast, by End User, 2018–2023
11.3.9. Italy
11.3.9.1. Market Estimates & Forecast, by Size, 2018–2023
11.3.9.2. Market Estimates & Forecast, by Subsystem, 2018–2023
11.3.9.3. Market Estimates & Forecast, by Application, 2018–2023
11.3.9.4. Market Estimates & Forecast, by End User, 2018–2023
11.3.10. Rest of Europe
11.3.10.1. Market Estimates & Forecast, by Size, 2018–2023
11.3.10.2. Market Estimates & Forecast, by Subsystem, 2018–2023
11.3.10.3. Market Estimates & Forecast, by Application, 2018–2023
11.3.10.4. Market Estimates & Forecast, by End User, 2018–2023
11.4. Asia-Pacific
11.4.1. Market Estimates & Forecast, by Country, 2018–2023
11.4.2. Market Estimates & Forecast, by Size, 2018–2023
11.4.3. Market Estimates & Forecast, by Subsystem, 2018–2023
11.4.4. Market Estimates & Forecast, by Application, 2018–2023
11.4.5. Market Estimates & Forecast, by End User, 2018–2023
11.4.6. China
11.4.6.1. Market Estimates & Forecast, by Size, 2018–2023
11.4.6.2. Market Estimates & Forecast, by Subsystem, 2018–2023
11.4.6.3. Market Estimates & Forecast, by Application, 2018–2023
11.4.6.4. Market Estimates & Forecast, by End User, 2018–2023
11.4.7. Japan
11.4.7.1. Market Estimates & Forecast, by Size, 2018–2023
11.4.7.2. Market Estimates & Forecast, by Subsystem, 2018–2023
11.4.7.3. Market Estimates & Forecast, by Application, 2018–2023
11.4.7.4. Market Estimates & Forecast, by End User, 2018–2023
11.4.8. India
11.4.8.1. Market Estimates & Forecast, by Size, 2018–2023
11.4.8.2. Market Estimates & Forecast, by Subsystem, 2018–2023
11.4.8.3. Market Estimates & Forecast, by Application, 2018–2023
11.4.8.4. Market Estimates & Forecast, by End User, 2018–2023
11.4.9. South Korea
11.4.9.1. Market Estimates & Forecast, by Size, 2018–2023
11.4.9.2. Market Estimates & Forecast, by Subsystem, 2018–2023
11.4.9.3. Market Estimates & Forecast, by Application, 2018–2023
11.4.9.4. Market Estimates & Forecast, by End User, 2018–2023
11.4.10. Rest of Asia-Pacific
11.4.10.1. Market Estimates & Forecast, by Size, 2018–2023
11.4.10.2. Market Estimates & Forecast, by Subsystem, 2018–2023
11.4.10.3. Market Estimates & Forecast, by Application, 2018–2023
11.4.10.4. Market Estimates & Forecast, by End User, 2018–2023
11.5. Rest of the World
11.5.1. Market Estimates & Forecast, by Region, 2018–2023
11.5.2. Market Estimates & Forecast, by Size, 2018–2023
11.5.3. Market Estimates & Forecast, by Subsystem, 2018–2023
11.5.4. Market Estimates & Forecast, by Application, 2018–2023
11.5.5. Market Estimates & Forecast, by End User, 2018–2023
11.5.6. Middle East & Africa
11.5.6.1. Market Estimates & Forecast, by Size, 2018–2023
11.5.6.2. Market Estimates & Forecast, by Subsystem, 2018–2023
11.5.6.3. Market Estimates & Forecast, by Application, 2018–2023
11.5.6.4. Market Estimates & Forecast, by End User, 2018–2023
11.5.7. Latin America
11.5.7.1. Market Estimates & Forecast, by Size, 2018–2023
11.5.7.2. Market Estimates & Forecast, by Subsystem, 2018–2023
11.5.7.3. Market Estimates & Forecast, by Application, 2018–2023
11.5.7.4. Market Estimates & Forecast, by End User, 2018–2023
12. Competitive Landscape
12.1. Competitive Overview
12.2. Competitor Dashboard
12.3. Major Growth Strategy in the CubeSat Market
12.4. Competitive Benchmarking
12.5. Market Share Analysis
12.6. Thales: The Leading Player in terms of Number of Developments in Global CubeSat Market
12.7. Key Developments & Growth Strategies
12.7.1. New Product Launch/Service Deployment
12.7.2. Merger & Acquisition
12.7.3. Joint Ventures
13. Company Profiles
13.1. Airbus S.A.S
13.1.1. Company Overview
13.1.2. Product Offering
13.1.3. Financial Overview
13.1.4. Key Developments
13.1.5. SWOT Analysis
13.1.6. Strategy
13.2. Busek Co. Inc.
13.2.1. Company Overview
13.2.2. Product Offering
13.2.3. Financial Overview
13.2.4. Key Developments
13.2.5. SWOT Analysis
13.2.6. Strategy
13.3. Capella Space
13.3.1. Company Overview
13.3.2. Product Offering
13.3.3. Financial Overview
13.3.4. Key Developments
13.3.5. SWOT Analysis
13.3.6. Strategy
13.4. Clyde Space Ltd
13.4.1. Company Overview
13.4.2. Product Offering
13.4.3. Financial Overview
13.4.4. Key Developments
13.4.5. SWOT Analysis
13.4.6. Strategy
13.5. CU Aerospace, L.L.C.
13.5.1. Company Overview
13.5.2. Product Offering
13.5.3. Financial Overview
13.5.4. Key Developments
13.5.5. SWOT Analysis
13.5.6. Strategy
13.6. EnduroSat
13.6.1. Company Overview
13.6.2. Product Offering
13.6.3. Financial Overview
13.6.4. Key Developments
13.6.5. SWOT Analysis
13.6.6. Strategy
13.7. GomSpace
13.7.1. Company Overview
13.7.2. Product Offering
13.7.3. Financial Overview
13.7.4. Key Developments
13.7.5. SWOT Analysis
13.7.6. Strategy
13.8. Harris Corporation
13.8.1. Company Overview
13.8.2. Product Offering
13.8.3. Financial Overview
13.8.4. Key Developments
13.8.5. SWOT Analysis
13.8.6. Strategy
13.9. Lockheed Martin Corporation
13.9.1. Company Overview
13.9.2. Product Offering
13.9.3. Financial Overview
13.9.4. Key Developments
13.9.5. SWOT Analysis
13.9.6. Strategy
13.10. MAXAR TECHNOLOGIES
13.10.1. Company Overview
13.10.2. Product Offering
13.10.3. Financial Overview
13.10.4. Key Developments
13.10.5. SWOT Analysis
13.10.6. Strategy
13.11. OHB SE
13.11.1. Company Overview
13.11.2. Product Offering
13.11.3. Financial Overview
13.11.4. Key Developments
13.11.5. SWOT Analysis
13.11.6. Strategy
13.12. Planet Labs Inc.
13.12.1. Company Overview
13.12.2. Product Offering
13.12.3. Financial Overview
13.12.4. Key Developments
13.12.5. SWOT Analysis
13.12.6. Strategy
13.13. Sierra Nevada Corporation
13.13.1. Company Overview
13.13.2. Product Offering
13.13.3. Financial Overview
13.13.4. Key Developments
13.13.5. SWOT Analysis
13.13.6. Strategy
13.14. Terran Orbital
13.14.1. Company Overview
13.14.2. Product Offering
13.14.3. Financial Overview
13.14.4. Key Developments
13.14.5. SWOT Analysis
13.14.6. Strategy
13.15. The Boeing Company
13.15.1. Company Overview
13.15.2. Product Offering
13.15.3. Financial Overview
13.15.4. Key Developments
13.15.5. SWOT Analysis
13.15.6. Strategy
14. Appendix
14.1. References
14.2. Related Reports
14.3. List of Abbreviation
15. Industry Insights
Note: This table of content is tentative and subject to change as the research progresses.
List of Tables
Table 1 Global CubeSat Market, by Region, 2018–2023
Table 2 North America: CubeSat Market, by Country, 2018–2023
Table 3 Europe: CubeSat Market, by Country, 2018–2023
Table 4 Asia-Pacific: CubeSat Market, by Country, 2018–2023
Table 5 Rest of the World: CubeSat Market, by Region, 2018–2023
Table 6 Global CubeSat, Size Market, by Region, 2018–2023
Table 7 North America: CubeSat, Size Market, by Country, 2018–2023
Table 8 Europe: CubeSat, Size Market, by Country, 2018–2023
Table 9 Asia-Pacific: CubeSat, Size Market, by Country, 2018–2023
Table 10 Rest of the World: CubeSat, Size Market, by Region, 2018–2023
Table 11 Global CubeSat, Subsystem Market, by Region, 2018–2023
Table 12 North America: CubeSat, Subsystem Market, by Country, 2018–2023
Table 13 Europe: CubeSat, Subsystem Market, by Country, 2018–2023
Table 14 Asia-Pacific: CubeSat, Subsystem Market, by Country, 2018–2023
Table 15 Rest of the World: CubeSat, Subsystem Market, by Region, 2018–2023
Table 16 Global CubeSat, Application Market, by Region, 2018–2023
Table 17 North America: CubeSat, Application Market, by Country, 2018–2023
Table 18 Europe: CubeSat, Application Market, by Country, 2018–2023
Table 19 Asia-Pacific: CubeSat, Application Market, by Country, 2018–2023
Table 20 Rest of the World: CubeSat, Application Market, by Region, 2018–2023
Table 21 Global CubeSat, End User Market, by Region, 2018–2023
Table 22 North America: CubeSat, End User Market, by Country, 2018–2023
Table 23 Europe: CubeSat, End User Market, by Country, 2018–2023
Table 24 Asia-Pacific: CubeSat, End User Market, by Country, 2018–2023
Table 25 Rest of the World: CubeSat, End User Market, by Region, 2018–2023
Table 26 Global CubeSat Market, by Region, 2018–2023
Table 27 Global CubeSat Market, by Size, 2018–2023
Table 28 Global CubeSat Market, by Subsystem, 2018–2023
Table 29 Global CubeSat Market, by Application, 2018–2023
Table 30 Global CubeSat Market, by End User, 2018–2023
Table 31 North America: CubeSat Market, by Country, 2018–2023
Table 32 North America: CubeSat Market, by Size, 2018–2023
Table 33 North America: CubeSat Market, by Subsystem, 2018–2023
Table 34 North America: CubeSat Market, by Application, 2018–2023
Table 35 North America: CubeSat Market, by End User, 2018–2023
Table 36 Europe: CubeSat Market, by Country, 2018–2023
Table 37 Europe: CubeSat Market, by Size, 2018–2023
Table 38 Europe: CubeSat Market, by Subsystem, 2018–2023
Table 39 Europe: CubeSat Market, by Application, 2018–2023
Table 40 Europe: CubeSat Market, by End User, 2018–2023
Table 41 Asia-Pacific: CubeSat Market, by Country, 2018–2023
Table 42 Asia-Pacific: CubeSat Market, by Size, 2018–2023
Table 43 Asia-Pacific: CubeSat Market, by Subsystem, 2018–2023
Table 44 Asia-Pacific: CubeSat Market, by Application, 2018–2023
Table 45 Asia-Pacific: CubeSat Market, by End User, 2018–2023
Table 46 Rest of the World: CubeSat Market, by Region, 2018–2023
Table 47 Rest of the World: CubeSat Market, by Size, 2018–2023
Table 48 Rest of the World: CubeSat Market, by Subsystem, 2018–2023
Table 49 Rest of the World: CubeSat Market, by Application, 2018–2023
Table 50 Rest of the World: CubeSat Market, by End User, 2018–2023
List of Figures
FIGURE 1 Research Process of MRFR
FIGURE 2 Top-Down & Bottom-Up Approaches
FIGURE 3 Market Dynamics
FIGURE 4 Impact Analysis: Market Drivers
FIGURE 5 Impact Analysis: Market Restraints
FIGURE 6 Porter's Five Forces Analysis
FIGURE 7 Value Chain Analysis
FIGURE 8 Global CubeSat Market Share, by Size, 2017 (%)
FIGURE 9 Global CubeSat Market, by Size, 2018–2023 (USD Million)
FIGURE 10 Global CubeSat Market Share, by Subsystem, 2017 (%)
FIGURE 11 Global CubeSat Market, by Subsystem, 2018–2023 (USD Million)
FIGURE 12 Global CubeSat Market Share, by Application, 2017 (%)
FIGURE 13 Global CubeSat Market, by Application, 2018–2023 (USD Million)
FIGURE 14 Global CubeSat Market Share, by End User, 2017 (%)
FIGURE 15 Global CubeSat Market, by End User, 2018–2023 (USD Million)
FIGURE 16 Global CubeSat Market Share (%), By Region, 2017
FIGURE 17 Global CubeSat Market, by Region, 2018–2023 (USD Million)
FIGURE 18 North America: CubeSat Market Share (%), 2017
FIGURE 19 North America: CubeSat Market by Country, 2018–2023 (USD Million)
FIGURE 20 Europe: CubeSat Market Share (%), 2017
FIGURE 21 Europe: CubeSat Market by Country, 2018–2023 (USD Million)
FIGURE 22 Asia-Pacific: CubeSat Market Share (%), 2017
FIGURE 23 Asia-Pacific: CubeSat Market by Country, 2018–2023 (USD Million)
FIGURE 24 Rest of the World: CubeSat Market Share (%), 2017
FIGURE 25 Rest of the World: CubeSat Market by Region, 2018–2023 (USD Million)