Healthcare Market Segmentation
Healthcare By Category (USD Billion, 2025-2035)
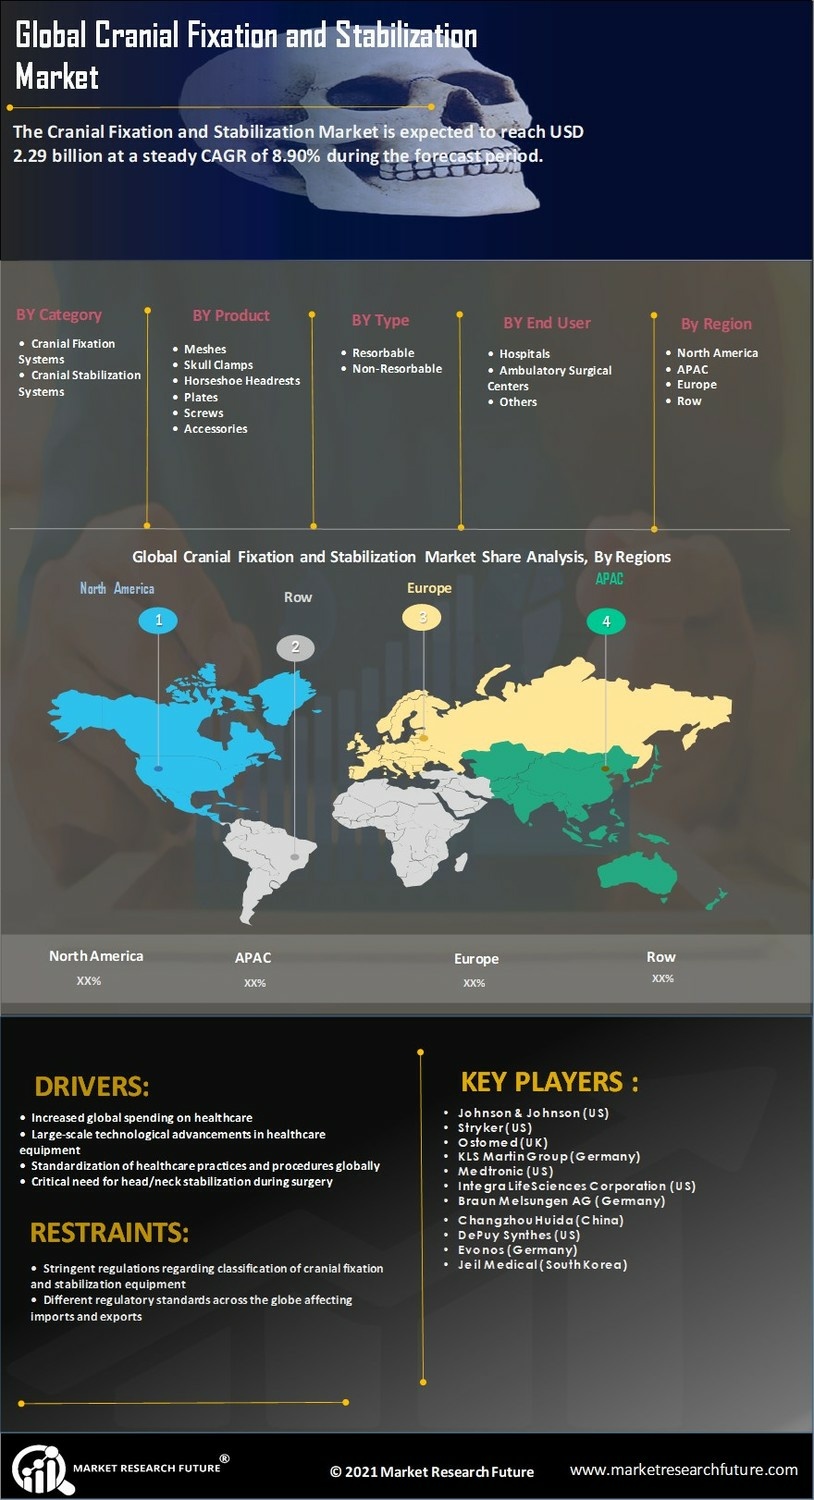
- Cranial Fixation Systems
- Cranial Stabilization Systems
Healthcare By Product (USD Billion, 2025-2035)
- Meshes
- Skull Clamps
- Flap Tube Clamps
- Horseshoe Headrests
- Plates
- Screws
- Accessories
Healthcare By Type (USD Billion, 2025-2035)
- Resorbable
- Non-Resorbable
Healthcare By End User (USD Billion, 2025-2035)
- Hospitals
- Ambulatory Surgical Centers
- Others