Counter IED Market Segmentation
Counter IED Market By End-Users (USD Billion, 2025-2035)
- Homeland Security
- Military
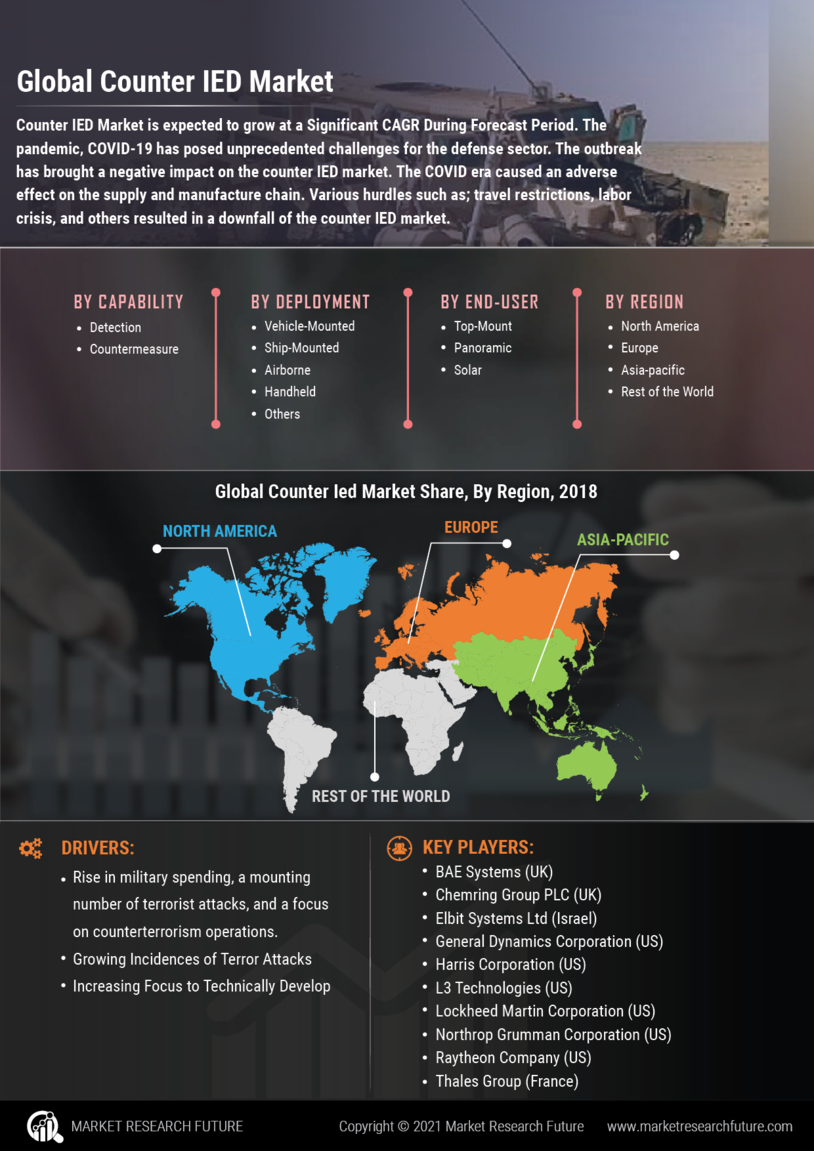
Counter IED Market By Capability (USD Billion, 2025-2035)
- Countermeasure
- Detection
Counter IED Market By Deployment (USD Billion, 2025-2035)
- Airborne
- Vehicle-Mounted
- Handheld
- Ship-Mounted
- Others