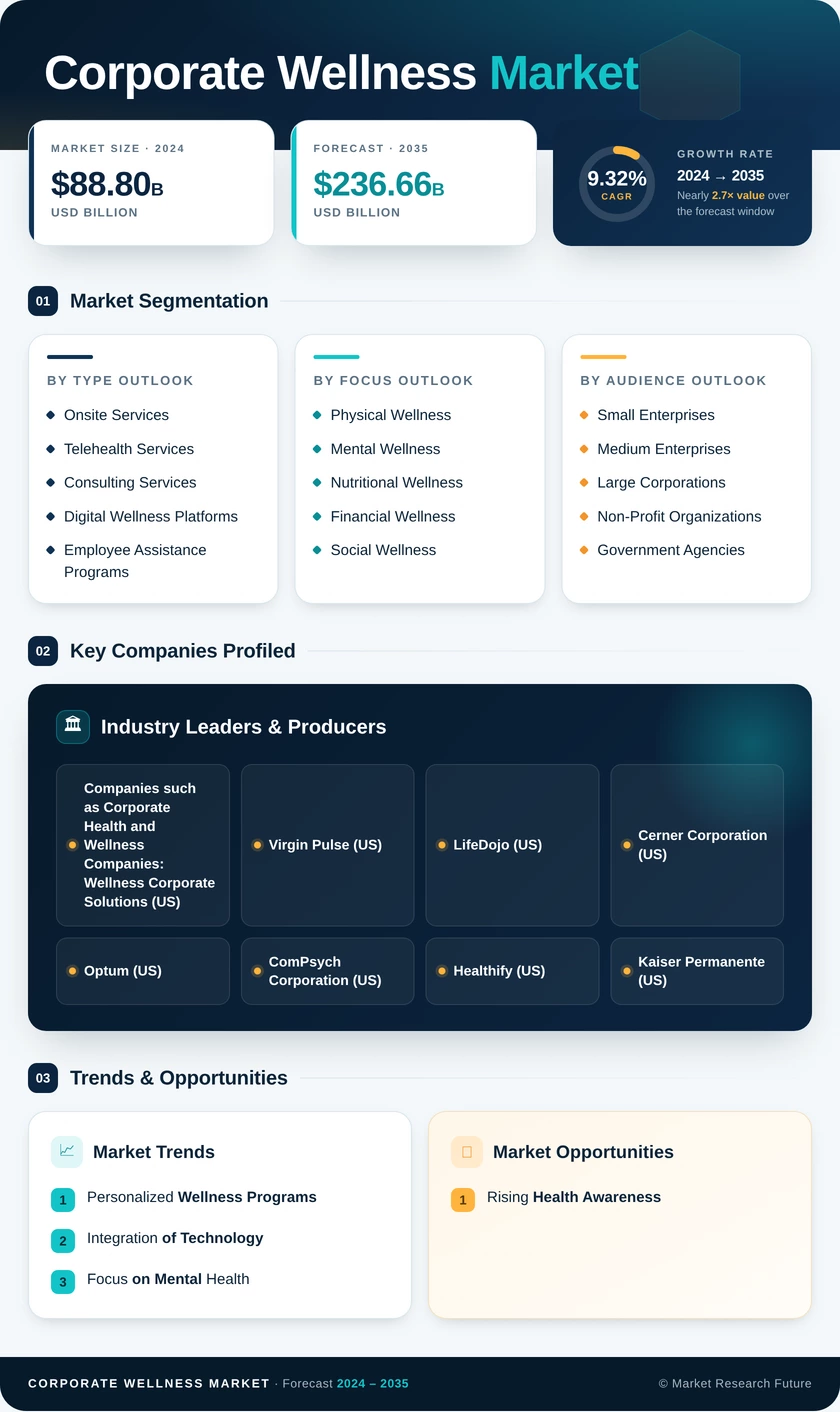
Corporate Wellness Market (2026 - 2035)

ID: MRFR/HC/5498-CR 110 Pages Rahul Gotadki Last Updated: November 02, 2026
Corporate Wellness Market Research Report: Size, Share, Trend Analysis By Service Type (Fitness Programs, Stress Management, Health Risk Assessments, Nutrition Programs, Employee Assistance Programs), By End Users (Large Enterprises, Small and Medium Enterprises, Government Agencies, Educational Institutions), By Delivery Mode (On-Site Wellness Programs, Virtual Wellness Solutions, Hybrid Programs), By Health Focus (Mental Health, Physical Health, Nutritional Health) and By Regional (North America, Europe, South America, Asia Pacific, Middle East and Africa) - Growth Outlook & Industry Forecast 2025 To 2035
Corporate Wellness Market
Market Size
Forecast Period2026-2035
CAGR (2026-2035)6.55%
2025 Market SizeUSD 70.60 Billion
2035 Market SizeUSD 133.14 Billion
Key Players
Optum
ComPsych Corporation
Personify Health
TELUS Health
Vitality Group
Sodexo
Opportunities
  • Turnkey Platforms for Small and Medium Enterprises
  • Emerging-Market Expansion
  • Outcomes-Based Contracts and Data-Driven Business Models
  1. 1 Market Summary | |
  2. 2 Key Report Takeaways | |
    1. 2.1 By Service Type | |
    2. 2.2 By Delivery Model | |
    3. 2.3 By End User | |
    4. 2.4 By Ownership | |
    5. 2.5 By Region | |
  3. 3 Market Size and Forecast (2021–2035) | |
  4. 4 Driver Impact Analysis | |
    1. 4.1 Rising Employer Health-Benefit Costs | |
    2. 4.2 Mental Health and Burnout Burden | |
    3. 4.3 Chronic Disease Prevalence | |
    4. 4.4 Virtual and AI-Enabled Delivery | |
    5. 4.5 Government Health-Productivity Policy | |
    6. 4.6 Human-Capital and ESG Disclosure | |
  5. 5 Restraints Impact Analysis | |
    1. 5.1 Unproven Clinical and Financial ROI | |
    2. 5.2 Health-Data Privacy Regulation | |
    3. 5.3 Low Sustained Participation | |
    4. 5.4 SME Budget Constraints | |
    5. 5.5 Vendor Fragmentation and Point-Solution Fatigue | |
  6. 6 Opportunities | |
    1. 6.1 Turnkey Platforms for Small and Medium Enterprises | |
    2. 6.2 Emerging-Market Expansion | |
    3. 6.3 Outcomes-Based Contracts and Data-Driven Business Models | |
    4. 6.4 Payer and Health-Plan Distribution Channels | |
    5. 6.5 Specialized Life-Stage and Condition Programs | |
  7. 7 Regional Market Share and Country-Level Analysis | |
    1. 7.1 North America | | |
      1. 7.1.1 US | | |
      2. 7.1.2 Canada | | |
      3. 7.1.3 Mexico | |
    2. 7.2 Europe | | |
      1. 7.2.1 Germany | | |
      2. 7.2.2 UK | | |
      3. 7.2.3 France | | |
      4. 7.2.4 Italy | | |
      5. 7.2.5 Spain | | |
      6. 7.2.6 Nordic Countries | | |
      7. 7.2.7 Russia | | |
      8. 7.2.8 Rest of Europe | |
    3. 7.3 Asia-Pacific | | |
      1. 7.3.1 China | | |
      2. 7.3.2 India | | |
      3. 7.3.3 Japan | | |
      4. 7.3.4 South Korea | | |
      5. 7.3.5 ASEAN | | |
      6. 7.3.6 Rest of Asia-Pacific | |
    4. 7.4 South America | | |
      1. 7.4.1 Brazil | | |
      2. 7.4.2 Argentina | | |
      3. 7.4.3 Rest of South America | |
    5. 7.5 Middle East & Africa | | |
      1. 7.5.1 Saudi Arabia | | |
      2. 7.5.2 UAE | | |
      3. 7.5.3 South Africa | | |
      4. 7.5.4 Egypt | | |
      5. 7.5.5 Rest of MEA | |
  8. 8 Future Outlook (2026–2035) | |
    1. 8.1 AI-Driven Personalization Becomes the Baseline | |
    2. 8.2 Platform Consolidation Reshapes Economics | |
    3. 8.3 Clinical-Grade Mental Health Converges with Wellness | |
    4. 8.4 Human-Capital Reporting Formalizes Accountability | |
  9. 9 Segmentation Analysis | |
    1. 9.1 By Service Type | | |
      1. 9.1.1 Health Risk Assessment | | |
      2. 9.1.2 Fitness & Nutrition Programs | | |
      3. 9.1.3 Smoking Cessation | | |
      4. 9.1.4 Stress Management | | |
      5. 9.1.5 Other Services | |
    2. 9.2 By Delivery Model | | |
      1. 9.2.1 On-Site | | |
      2. 9.2.2 Off-Site / Virtual | | |
      3. 9.2.3 Hybrid | |
    3. 9.3 By End User | | |
      1. 9.3.1 Large Organizations | | |
      2. 9.3.2 Small & Medium Enterprises (SMEs) | | |
      3. 9.3.3 Public Sector Organizations | |
    4. 9.4 By Ownership | | |
      1. 9.4.1 In-House Managed Programs | | |
      2. 9.4.2 Outsourced Vendor-Managed Programs | |
  10. 10 Competitive Landscape | |
    1. 10.1 Market Concentration Analysis | |
    2. 10.2 Competitive Benchmarking Matrix | |
    3. 10.3 Company Profiles | | |
      1. 10.3.1 Optum (UnitedHealth Group) | | |
      2. 10.3.2 ComPsych Corporation | | |
      3. 10.3.3 Personify Health | | |
      4. 10.3.4 TELUS Health | | |
      5. 10.3.5 Vitality Group | | |
      6. 10.3.6 Sodexo | | |
      7. 10.3.7 Lyra Health | | |
      8. 10.3.8 Wellhub | | |
      9. 10.3.9 Spring Health | | |
      10. 10.3.10 Headspace | | |
      11. 10.3.11 EXOS | | |
      12. 10.3.12 Wellness Corporate Solutions | |
  11. 11 Recent News & Developments | |
  12. 12 Report Scope and Methodology | |
  13. 13 Detailed Sources and Citations | |
  14. 14 Frequently Asked Questions (FAQs) | | LIST OF TABLES | |
  15. TABLE 1 Report Snapshot – Study Period, Market Size, CAGR, and Regional Leadership | |
  16. TABLE 2 Global Market Size & Forecast, by Revenue (USD Billion), 2021–2035 | |
  17. TABLE 3 Driver Impact Analysis on CAGR, 2026–2035 | |
  18. TABLE 4 Restraints Impact Analysis on CAGR, 2026–2035 | |
  19. TABLE 5 Regional Summary, 2025–2035 | |
  20. TABLE 6 North America Market, by Country, 2025–2035 | |
  21. TABLE 7 Europe Market, by Country, 2025–2035 | |
  22. TABLE 8 Asia-Pacific Market, by Country, 2025–2035 | |
  23. TABLE 9 South America Market, by Country, 2025–2035 | |
  24. TABLE 10 Middle East & Africa Market, by Country, 2025–2035 | |
  25. TABLE 11 Global Market, by Service Type, 2025–2035 | |
  26. TABLE 12 Global Market, by Delivery Model, 2025–2035 | |
  27. TABLE 13 Global Market, by End User, 2025–2035 | |
  28. TABLE 14 Global Market, by Ownership, 2025–2035 | |
  29. TABLE 15 Competitive Benchmarking Matrix, 2025 | |
  30. TABLE 16 Report Scope and Methodology | |
  31. TABLE 17 Detailed Sources and Citations | |
  32. TABLE 18 Segmentation Quick Reference | | LIST OF FIGURES | |
  33. FIGURE 1 Market Dynamics Overview – Drivers, Restraints, and Opportunities | |
  34. FIGURE 2 Industry Value Chain Analysis | |
  35. FIGURE 3 Porter's Five Forces Analysis | |
  36. FIGURE 4 Global Market Size Trend (USD Billion), 2021–2035 | |
  37. FIGURE 5 Year-over-Year Growth Rate, 2022–2035 | |
  38. FIGURE 6 Market Share by Service Type, 2025 | |
  39. FIGURE 7 Market Share by Delivery Model, 2025 | |
  40. FIGURE 8 Market Share by End User, 2025 | |
  41. FIGURE 9 Market Share by Ownership, 2025 | |
  42. FIGURE 10 Regional Market Share, 2025 | |
  43. FIGURE 11 Regional Growth Comparison (CAGR), 2026–2035 | |
  44. FIGURE 12 Competitive Landscape – Estimated Revenue Share Ranges, 2025 | |
  45. FIGURE 13 Competitive Positioning Matrix – Integration Breadth vs. Clinical Depth

Segmentation Quick Reference

DimensionSub-SegmentsDominant SegmentFastest Growing Segment
By Service TypeHealth Risk Assessment, Fitness & Nutrition Programs, Smoking Cessation, Stress Management, Other ServicesHealth Risk Assessment – 28.10% share (2025)Stress Management – 7.75% CAGR (2026–2035)
By Delivery ModelOn-Site, Off-Site / Virtual, HybridOn-Site – 59.40% share (2025)Off-Site / Virtual – 8.85% CAGR (2026–2035)
By End UserLarge Organizations, Small & Medium Enterprises (SMEs), Public Sector OrganizationsLarge Organizations – 57.10% share (2025)Small & Medium Enterprises (SMEs) – 6.90% CAGR (2026–2035)
By OwnershipIn-House Managed Programs, Outsourced Vendor-Managed ProgramsIn-House Managed Programs – 59.70% share (2025)Outsourced Vendor-Managed Programs – 7.40% CAGR (2026–2035)
By RegionNorth America, Europe, Asia-Pacific, South America, Middle East & AfricaNorth America – 41.2% share (2025)Asia-Pacific – 8.35% CAGR (2026–2035)


Market Segmentation Overview

By Service Type

Sub-SegmentKey Trend
Health Risk AssessmentDigital HRAs linked to claims data for automated risk stratification
Fitness & Nutrition ProgramsCommoditization pushing vendors toward bundled platforms
Smoking CessationDeclining in mature economies, steady where tobacco use is high
Stress ManagementCBT and mindfulness bundled under single licenses
Other ServicesSleep, financial wellbeing, and condition-specific modules


Health Risk Assessment leads with a 28.10% share because screening results determine which employees enter coaching, disease-management, and incentive programs. Stress Management grows fastest at a 7.75% CAGR, as burnout-related absence and claims push employers to fund structured psychological support. Fitness & Nutrition Programs stay widespread but are losing pricing power as offerings converge.

By Delivery Model

Sub-SegmentKey Trend
On-SiteFitness centers and in-person screenings reinforce culture
Off-Site / VirtualAI nudges and real-time analytics close the engagement gap
HybridOmnichannel experiences for mixed office and remote workforces


On-Site delivery holds a 59.40% share, supported by facility investments and the social reinforcement of in-person activity. Off-Site / Virtual is expanding fastest at an 8.85% CAGR because it reaches remote and frontline staff at far lower marginal cost. Hybrid programs bridge the two, letting multiregional employers serve every work pattern through one contract.

By End User

Sub-SegmentKey Trend
Large OrganizationsDeep HR and health-record system integrations
Small & Medium Enterprises (SMEs)Self-serve, data-light platforms priced per active user
Public Sector OrganizationsSlow procurement but long, stable contracts


Large Organizations control a 57.10% share through volume purchasing and dedicated benefits teams capable of managing complex vendor portfolios. Small & Medium Enterprises (SMEs) grow fastest at a 6.90% CAGR as turnkey apps remove the administrative barriers that previously kept smaller employers out. Public Sector Organizations adopt cautiously, yet funded programs rarely churn.

By Ownership

Sub-SegmentKey Trend
In-House Managed ProgramsSelf-insured employers retaining control of claims and biometric data
Outsourced Vendor-Managed ProgramsModular vendor ecosystems bundling administration with engagement


In-House Managed Programs account for a 59.70% share, reflecting self-insured employers' preference for direct oversight of sensitive data and incentive design. Outsourced Vendor-Managed Programs grow faster at a 7.40% CAGR as integration requirements and compliance certifications exceed internal capabilities. Fully insured firms in particular prioritize the speed an outsourced model delivers.




Download PDF ×

We do not share your information with anyone. However, we may send you emails based on your report interest from time to time. You may contact us at any time to opt-out.