Content Analytics Market (2026 – 2035)

ID: MRFR/ICT/2654-HCR 100 Pages Aarti Dhapte Last Updated: September 15, 2026
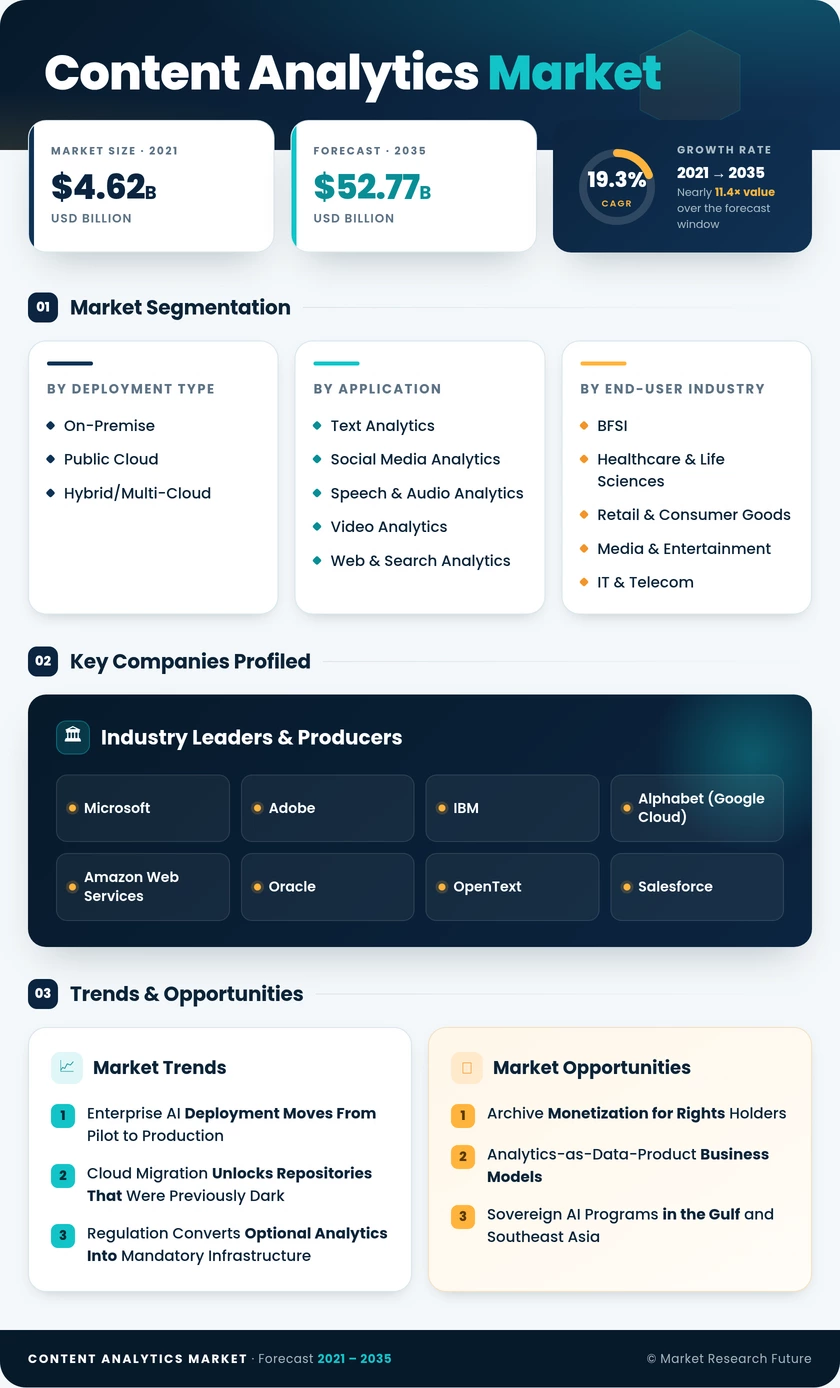
Content Analytics Market Size, Share and Research Report By Sovereignty Rules Fragment Architecture and Raise Cost, By Data Quality Debt Stalls Deployments, By Talent Scarcity Concentrates Capability and By Regional (North America, Europe, South America, South Africa, Asia Pacific, Middle East and Africa) - Industry Forecast to 2035.
Content Analytics Market
Market Size
Forecast Period2026-2035
CAGR (2026-2035)19.3%
2025 Market SizeUSD 9.14 Billion
2035 Market SizeUSD 52.77 Billion
Key Players
Microsoft
Adobe
IBM
Alphabet
Amazon Web Services
Oracle
Opportunities
  • Archive Monetization for Rights Holders
  • Analytics-as-Data-Product Business Models
  • Sovereign AI Programs in the Gulf and Southeast Asia
  1. 1 Market Overview |
    1. 1.1 Study Assumptions & Market Definition |
    2. 1.2 Scope of the Study |
    3. 1.3 Research Methodology |
    4. 1.4 Market Summary
  2. 2 Key Report Takeaways |
    1. 2.1 By Technology |
    2. 2.2 By Sector |
    3. 2.3 By Geography
  3. 3 Market Size & Forecast (2021–2035) |
    1. 3.1 Historical Market Size (2021–2024) |
    2. 3.2 Base Year Assessment (2025) |
    3. 3.3 Forecast Market Size (2026–2035) |
    4. 3.4 Year-over-Year Growth Analysis
  4. 4 Market Drivers Analysis |
    1. 4.1 Enterprise AI Deployment Moves From Pilot to Production |
    2. 4.2 Cloud Migration Unlocks Dark Repositories |
    3. 4.3 Regulation Converts Optional Analytics Into Mandatory Infrastructure |
    4. 4.4 Emerging-Economy Digital Commerce Broadens the Buyer Base
  5. 5 Market Restraints Analysis |
    1. 5.1 Sovereignty Rules Fragment Architecture and Raise Cost |
    2. 5.2 Data Quality Debt Stalls Deployments |
    3. 5.3 Talent Scarcity Concentrates Capability
  6. 6 Market Opportunity Analysis |
    1. 6.1 Archive Monetization for Rights Holders |
    2. 6.2 Analytics-as-Data-Product Business Models |
    3. 6.3 Sovereign AI Programs in the Gulf and Southeast Asia |
    4. 6.4 Vertical Packaging for Small and Medium Enterprises |
    5. 6.5 Compliance-Grade Communications Surveillance |
    6. 6.6 Industry Value Chain Analysis |
    7. 6.7 Porter's Five Forces Analysis
  7. 7 Regional Analysis |
    1. 7.1 North America | |
      1. 7.1.1 US | |
      2. 7.1.2 Canada | |
      3. 7.1.3 Mexico |
    2. 7.2 Europe | |
      1. 7.2.1 Germany | |
      2. 7.2.2 UK | |
      3. 7.2.3 France | |
      4. 7.2.4 Italy | |
      5. 7.2.5 Spain | |
      6. 7.2.6 Nordic Countries | |
      7. 7.2.7 Russia | |
      8. 7.2.8 Rest of Europe |
    3. 7.3 Asia-Pacific | |
      1. 7.3.1 China | |
      2. 7.3.2 India | |
      3. 7.3.3 Japan | |
      4. 7.3.4 South Korea | |
      5. 7.3.5 ASEAN | |
      6. 7.3.6 Rest of Asia-Pacific |
    4. 7.4 South America | |
      1. 7.4.1 Brazil | |
      2. 7.4.2 Argentina | |
      3. 7.4.3 Rest of South America |
    5. 7.5 Middle East & Africa | |
      1. 7.5.1 Saudi Arabia | |
      2. 7.5.2 UAE | |
      3. 7.5.3 South Africa | |
      4. 7.5.4 Egypt | |
      5. 7.5.5 Rest of Middle East & Africa
  8. 8 Future Outlook (2026–2035) |
    1. 8.1 Agentic Retrieval Replaces Query-Based Analytics |
    2. 8.2 Platform Economics Compress the Middle |
    3. 8.3 Multimodal Becomes the Default Processing Mode |
    4. 8.4 Governance and Sustainability Reporting Converge
  9. 9 Market Segmentation Analysis |
    1. 9.1 By Deployment Type | |
      1. 9.1.1 On-Premise | |
      2. 9.1.2 Public Cloud | |
      3. 9.1.3 Hybrid / Multi-Cloud |
    2. 9.2 By Application | |
      1. 9.2.1 Text Analytics | |
      2. 9.2.2 Social Media Analytics | |
      3. 9.2.3 Speech & Audio Analytics | |
      4. 9.2.4 Video Analytics | |
      5. 9.2.5 Web & Document Analytics |
    3. 9.3 By End-User Industry | |
      1. 9.3.1 BFSI | |
      2. 9.3.2 Healthcare & Life Sciences | |
      3. 9.3.3 Retail & Consumer Goods | |
      4. 9.3.4 Media & Entertainment | |
      5. 9.3.5 IT & Telecom | |
      6. 9.3.6 Government & Public Sector | |
      7. 9.3.7 Manufacturing | |
      8. 9.3.8 Other End-User Industries |
    4. 9.4 By Organisation Size | |
      1. 9.4.1 Large Enterprises | |
      2. 9.4.2 Small & Medium-Sized Enterprises |
    5. 9.5 By Content Type | |
      1. 9.5.1 Text | |
      2. 9.5.2 Image | |
      3. 9.5.3 Audio | |
      4. 9.5.4 Video | |
      5. 9.5.5 Multimodal/ Composite
  10. 10 Competitive Landscape |
    1. 10.1 Market Concentration Analysis |
    2. 10.2 Competitive Benchmarking Matrix |
    3. 10.3 Company Profiles | |
      1. 10.3.1 Microsoft | |
      2. 10.3.2 Adobe | |
      3. 10.3.3 IBM | |
      4. 10.3.4 Alphabet (Google Cloud) | |
      5. 10.3.5 Amazon Web Services | |
      6. 10.3.6 Oracle | |
      7. 10.3.7 OpenText | |
      8. 10.3.8 Salesforce | |
      9. 10.3.9 SAS Institute | |
      10. 10.3.10 Verint Systems | |
      11. 10.3.11 NICE Ltd | |
      12. 10.3.12 Sprinklr
  11. 11 Recent News & Developments
  12. 12 Report Scope & Methodology |
    1. 12.1 Study Period & Base Year |
    2. 12.2 Valuation Currency & Units |
    3. 12.3 CAGR Driver Disclaimer
  13. 13 Detailed Sources & Citations
  14. 14 Frequently Asked Questions
  15. 15 LIST OF TABLES |
  16. TABLE 1 Global Content Analytics Market Size & Forecast, by Revenue (USD Billion), 2021–2035 |
  17. TABLE 2 Global Content Analytics Market – Year-over-Year Growth Analysis, 2021–2035 |
  18. TABLE 3 Driver Impact Analysis – Content Analytics Market, 2026–2035 |
  19. TABLE 4 Restraint Impact Analysis – Content Analytics Market, 2026–2035 |
  20. TABLE 5 Global Content Analytics Market Size, by Region, 2021–2035 (USD Billion) |
  21. TABLE 6 North America Content Analytics Market Size, by Country, 2021–2035 (USD Billion) |
  22. TABLE 7 Europe Content Analytics Market Size, by Country, 2021–2035 (USD Billion) |
  23. TABLE 8 Asia-Pacific Content Analytics Market Size, by Country, 2021–2035 (USD Billion) |
  24. TABLE 9 South America Content Analytics Market Size, by Country, 2021–2035 (USD Billion) |
  25. TABLE 10 Middle East & Africa Content Analytics Market Size, by Country, 2021–2035 (USD Billion) |
  26. TABLE 11 Global Content Analytics Market Size, by Deployment Type, 2021–2035 (USD Billion) |
  27. TABLE 12 Global Content Analytics Market Size, by Application, 2021–2035 (USD Billion) |
  28. TABLE 13 Global Content Analytics Market Size, by End-User Industry, 2021–2035 (USD Billion) |
  29. TABLE 14 Global Content Analytics Market Size, by Organisation Size, 2021–2035 (USD Billion) |
  30. TABLE 15 Global Content Analytics Market Size, by Content Type, 2021–2035 (USD Billion) |
  31. TABLE 16 North America Content Analytics Market Size, by Deployment Type, 2021–2035 (USD Billion) |
  32. TABLE 17 North America Content Analytics Market Size, by Application, 2021–2035 (USD Billion) |
  33. TABLE 18 North America Content Analytics Market Size, by End-User Industry, 2021–2035 (USD Billion) |
  34. TABLE 19 Europe Content Analytics Market Size, by Deployment Type, 2021–2035 (USD Billion) |
  35. TABLE 20 Europe Content Analytics Market Size, by Application, 2021–2035 (USD Billion) |
  36. TABLE 21 Europe Content Analytics Market Size, by End-User Industry, 2021–2035 (USD Billion) |
  37. TABLE 22 Asia-Pacific Content Analytics Market Size, by Deployment Type, 2021–2035 (USD Billion) |
  38. TABLE 23 Asia-Pacific Content Analytics Market Size, by Application, 2021–2035 (USD Billion) |
  39. TABLE 24 Asia-Pacific Content Analytics Market Size, by End-User Industry, 2021–2035 (USD Billion) |
  40. TABLE 25 South America Content Analytics Market Size, by Deployment Type, 2021–2035 (USD Billion) |
  41. TABLE 26 South America Content Analytics Market Size, by Application, 2021–2035 (USD Billion) |
  42. TABLE 27 Middle East & Africa Content Analytics Market Size, by Deployment Type, 2021–2035 (USD Billion) |
  43. TABLE 28 Middle East & Africa Content Analytics Market Size, by Application, 2021–2035 (USD Billion) |
  44. TABLE 29 US Content Analytics Market Size, by Application, 2021–2035 (USD Billion) |
  45. TABLE 30 China Content Analytics Market Size, by Application, 2021–2035 (USD Billion) |
  46. TABLE 31 India Content Analytics Market Size, by Application, 2021–2035 (USD Billion) |
  47. TABLE 32 Germany Content Analytics Market Size, by Application, 2021–2035 (USD Billion) |
  48. TABLE 33 Competitive Benchmarking Matrix – Content Analytics Market, 2026 |
  49. TABLE 34 Company Profiles – Key Players, Content Analytics Market |
  50. TABLE 35 Recent Developments & Strategic Announcements, 2023–2025 |
  51. TABLE 36 Report Scope & Methodology Summary |
  52. TABLE 37 Detailed Sources & Citations Register
  53. 16 LIST OF FIGURES |
  54. FIGURE 1 Content Analytics Market Dynamics – Drivers, Restraints, Opportunities |
  55. FIGURE 2 Industry Value Chain Analysis – Content Analytics |
  56. FIGURE 3 Porter's Five Forces Analysis – Content Analytics |
  57. FIGURE 4 Global Market Size Trend & Forecast, 2021–2035 (USD Billion) |
  58. FIGURE 5 Year-over-Year Growth Rate Trend, 2022–2035 (%) |
  59. FIGURE 6 Market Share by Deployment Type, 2025 vs 2035 (%) |
  60. FIGURE 7 Market Share by Application, 2025 vs 2035 (%) |
  61. FIGURE 8 Market Share by End-User Industry, 2025 (%) |
  62. FIGURE 9 Market Share by Organisation Size, 2025 vs 2035 (%) |
  63. FIGURE 10 Market Share by Content Type, 2025 vs 2035 (%) |
  64. FIGURE 11 Regional Market Share Distribution, 2025 (%) |
  65. FIGURE 12 Regional CAGR Comparison, 2026–2035 (%) |
  66. FIGURE 13 North America Country-Level Share Breakdown, 2025 (%) |
  67. FIGURE 14 Europe Country-Level Share Breakdown, 2025 (%) |
  68. FIGURE 15 Asia-Pacific Country-Level Share Breakdown, 2025 (%) |
  69. FIGURE 16 Competitive Landscape – Vendor Positioning Matrix, 2026 |
  70. FIGURE 17 Estimated Vendor Revenue Share Ranges, 2025 (%) |
  71. FIGURE 18 Driver Impact Contribution Heat Map, 2026–2035 |
  72. FIGURE 19 Deployment Architecture Migration Path, 2021–2035 |
  73. FIGURE 20 Technology Adoption S-Curve – Multimodal Analytics

Segmentation Quick Reference

DimensionSub-SegmentsDominant SegmentFastest Growing Segment
Deployment TypeOn-Premise; Public Cloud; Hybrid/Multi-CloudPublic CloudHybrid/Multi-Cloud
ApplicationText Analytics; Social Media Analytics; Speech & Audio Analytics; Video Analytics; Web & Search AnalyticsSocial Media AnalyticsSpeech & Audio Analytics
End-User IndustryBFSI; Healthcare & Life Sciences; Retail & Consumer Goods; Media & Entertainment; IT & Telecom; Government & Public Sector; OthersRetail & Consumer GoodsMedia & Entertainment
Organisation SizeLarge Enterprises; Small & Medium-Sized EnterprisesLarge EnterprisesSmall & Medium-Sized Enterprises
Content TypeText; Image; Audio; Video; MultimodalTextMultimodal
GeographyNorth America; Europe; Asia-Pacific; South America; Middle East & AfricaNorth AmericaAsia-Pacific


Market Segmentation Overview

By Deployment Type

Sub-SegmentKey Trend
On-PremiseRetained for classified archives and legacy ECM integration; replacement cycles now default to hybrid
Public CloudManaged embedding and vector services make cloud the lowest-friction path to production
Hybrid / Multi-CloudSovereignty and latency requirements drive workload splitting across jurisdictions


Deployment choice is increasingly dictated by regulation rather than economics. Buyers who once compared total cost of ownership now start with a data-residency map and work backwards to architecture.

By Application

Sub-SegmentKey Trend
Text AnalyticsShifting from classification to generative document intelligence and contract reasoning
Social Media AnalyticsMature and price-competitive; platform-native tools compress independent vendor margins
Speech & Audio AnalyticsTranscription accuracy gains unlock stored call archives for compliance and coaching
Video AnalyticsArchive indexing turns dormant libraries into searchable, licensable inventory
Web & Search AnalyticsGenerative search results reshape discoverability measurement methodologies


Application demand no longer clusters by channel. Buyers increasingly tender for unified interaction analysis and expect vendors to normalize across formats without separate line items.

By End-User Industry

Sub-SegmentKey Trend
BFSICommunications surveillance obligations create non-discretionary analytics spend
Healthcare & Life SciencesClinical documentation and pharmacovigilance drive accuracy-first procurement
Retail & Consumer GoodsReview and merchandising analytics remain the largest single revenue block
Media & EntertainmentLibrary monetization and licensing negotiations accelerate indexing investment
IT & TelecomSupport ticket deflection and network incident narrative analysis
Government & Public SectorCitizen service records and multilingual public-communication analysis
OthersEducation, logistics, and professional services adopt via packaged verticals


Industry mix is broadening. Categories that previously bought nothing beyond web analytics now purchase full content pipelines, driven by regulation in some sectors and by competitive pressure in others.

By Organisation Size

Sub-SegmentKey Trend
Large EnterprisesMulti-source integration, governance layers, and custom taxonomies dominate spend
Small & Medium-Sized EnterprisesFixed-price vertical SaaS with pre-built connectors removes the data-team prerequisite


The SME opening is genuine but narrow. Vendors must ship opinionated defaults, because the segment cannot absorb configuration effort that large enterprises take for granted.

By Content Type

Sub-SegmentKey Trend
TextVolume leader with gradually eroding share as richer formats become capturable
ImageProduct catalogue normalization and visual brand monitoring
AudioVoice interfaces and call recordings expand addressable content pools
VideoStreaming, retail behaviour, and archive indexing drive processing demand
MultimodalUpgrade path embedded in renewals rather than a standalone purchase category


Content-type boundaries are dissolving in practice. A single customer journey now spans four formats, and buyers evaluate vendors on whether analysis crosses those boundaries without manual stitching.

By Geography

Sub-SegmentKey Trend
North AmericaVendor-adjacent early adoption plus regulatory compliance floor in financial services
EuropeCompliance-led procurement with hard multilingual and sovereignty requirements
Asia-PacificVernacular and short-form content volume demands locally trained processing stacks
South AmericaSocial commerce penetration generates conversational volume above revenue weight
Middle East & AfricaPolicy-led sovereign AI investment with Arabic dialect coverage as the bottleneck


Regional demand logic differs more than regional growth rates suggest. A product strategy that wins in North America frequently stalls in Europe on procurement grounds and in Asia-Pacific on language coverage.




Download PDF ×

We do not share your information with anyone. However, we may send you emails based on your report interest from time to time. You may contact us at any time to opt-out.