Configuration Management Market Segmentation
Configuration Management Market By Component (USD Billion, 2025-2035)
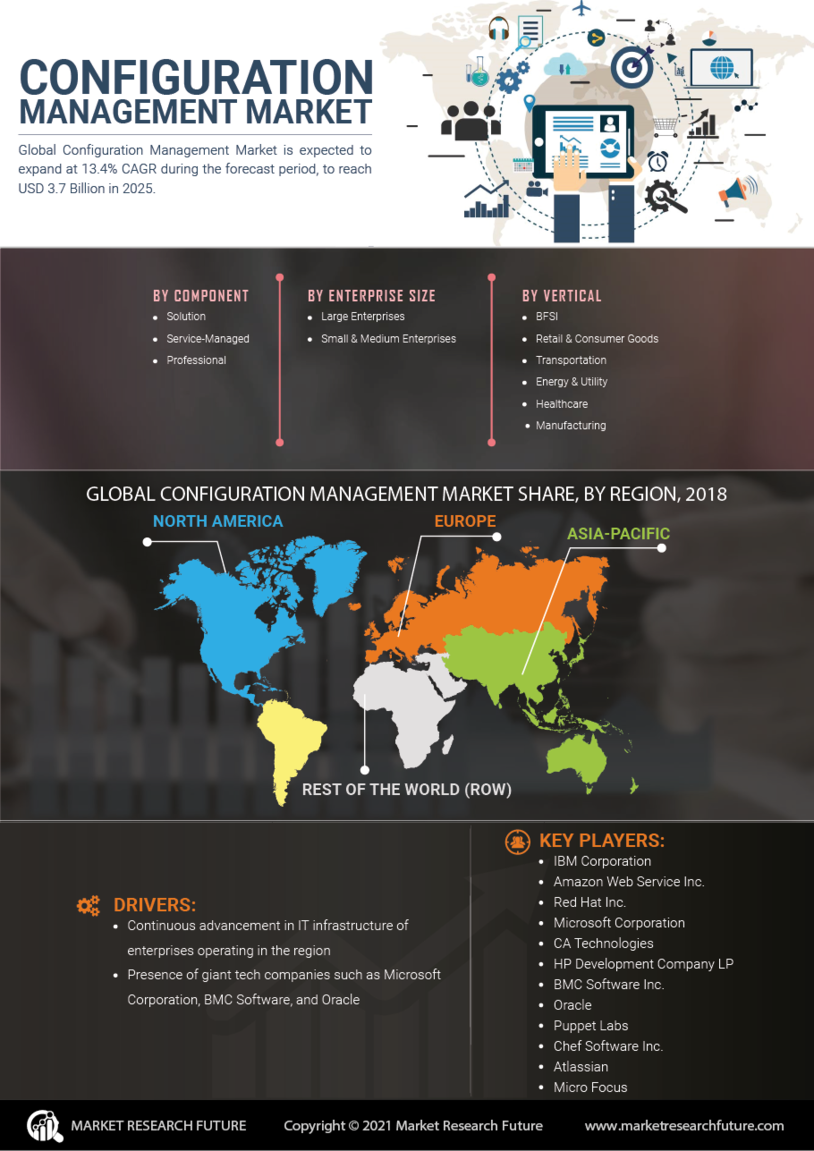
- Solution
- Service
Configuration Management Market By Vertical (USD Billion, 2025-2035)
- BFSI
- Retail & Consumer Goods
- Transportation
- Energy & Utility
- Configuration Management Market
- Manufacturing
- Other