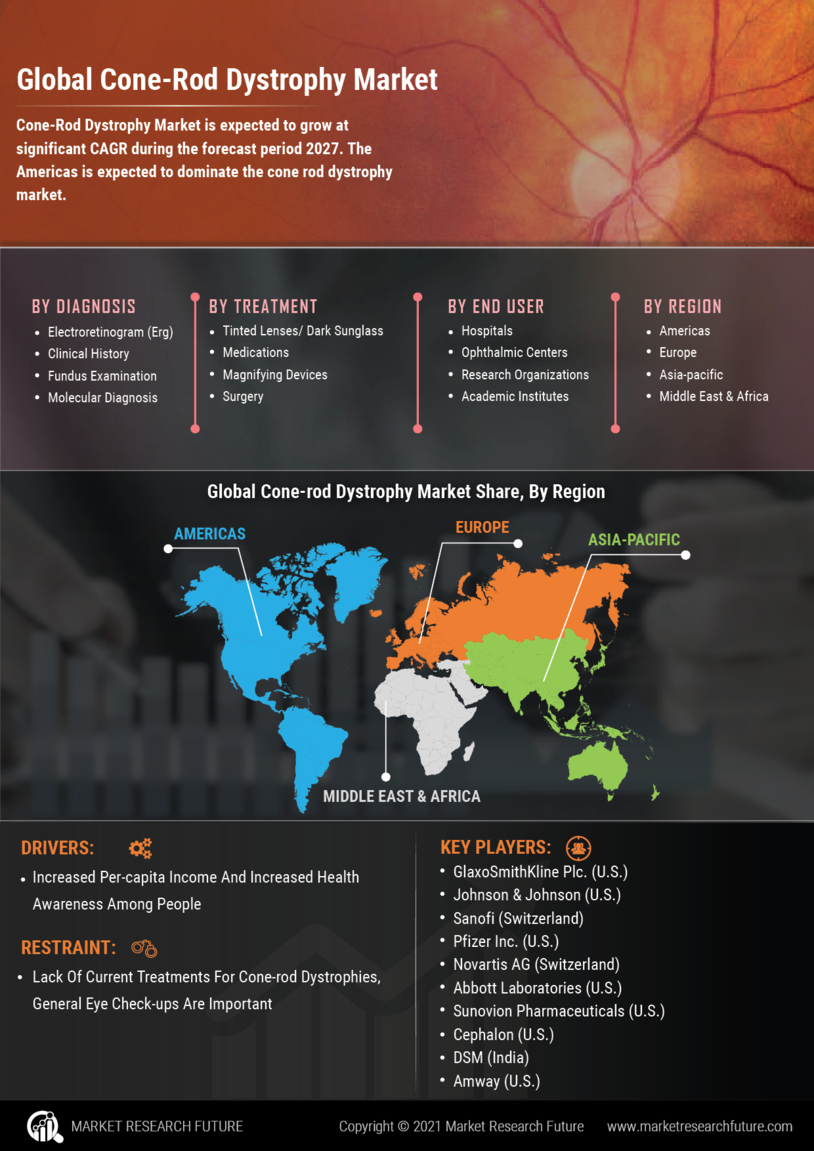
Cone-Rod Dystrophy Market Research Report - Global Forecast till 2030

Cone Rod Dystrophy Market Research Report– By Diagnosis (ERG, Clinical History, Fundus Examination, Molecular Diagnosis), By Treatment (Tinted Lenses, Medication, Magnifying Devices), By End User (Hospitals, Ophthalmic Centers) – Global Forecast Till 2030

ID: MRFR/Pharma/3824-HCR | 90 Pages | Author: Rahul Gotadki | May 2023         

TABLE OF CONTENT

Chapter 1. Report Prologue

Chapter 2. Market Introduction

2.1 Definition

2.2 Scope of the Study

2.2.1 Research Objective

2.2.2 Assumptions

2.2.3 Limitations

Chapter 3. Research Methodology

3.1 Introduction

3.2 Primary Research

3.3 Secondary research

3.4 Market Size Estimation

Chapter 4. Market Dynamics

4.1 Drivers

4.2 Restrains

4.3 Opportunities

4.4 Challenges

4.5 Macroeconomic Indicators

4.6 Technology Trends & Assessment

Chapter 5. Market Factor Analysis

5.1 Porter’s Five Forces Analysis

5.1.1 Bargaining Power of Suppliers

5.1.2 Bargaining Power of Buyers

5.1.3 Threat of New Entrants

5.1.4 Threat of Substitutes

5.1.5 Intensity of Rivalry

5.2 Value Chain Analysis

5.3 Investment Feasibility Analysis

5.4 Pricing Analysis

Chapter 6. Global Cone rod dystrophy Market, by Diagnosis

6.1 Introduction

6.2 Electroretinogram (ERG)

6.2.1 Market Estimates & Forecast, 2023 – 2030

6.3 Clinical history

6.3.1 Market Estimates & Forecast, 2023 – 2030

6.4 Fundus examination

6.4.1 Market Estimates & Forecast, 2023 – 2030

6.5 Molecular diagnosis

6.5.1 Market Estimates & Forecast, 2023 – 2030

6.5 Others

Chapter 7. Global Cone rod dystrophy Market, by Treatment

7.1 Introduction

7.2 Tinted lenses/ dark sunglass

7.2.1 Market Estimates & Forecast, 2023 – 2030

7.3 Medications

7.3.1 Market Estimates & Forecast, 2023 – 2030

7.3.2 Vitamin A supplement

7.3.2.1 Market Estimates & Forecast, 2023 – 2030

7.3.3 Anticonvulsant

7.3.3.1 Market Estimates & Forecast, 2023 – 2030

7.4 Magnifying devices

7.4.1 Market Estimates & Forecast, 2023 – 2030

7.5 Surgery

7.5.1 Market Estimates & Forecast, 2023 – 2030

Chapter 8. Global Cone rod dystrophy Market, by End User

8.1 Introduction

8.2 Hospitals

8.2.1 Market Estimates & Forecast, 2023 – 2030

8.3 Ophthalmic centers

8.3.1 Market Estimates & Forecast, 2023 – 2030

8.4 Research organizations

8.4.1 Market Estimates & Forecast, 2023 – 2030

8.5 Academic institutes

8.5.1 Market Estimates & Forecast, 2023 – 2030

Chapter. 9 Global Cone rod dystrophy Market, by Region

9.1 Introduction

9.2 Americas

9.2.1 North America

9.2.1.1 U.S.

9.2.1.1 Canada

9.2.2 South America

9.3 Europe

9.3.1 Western Europe

9.3.1.1 Germany

9.3.1.2 France

9.3.1.3 Italy

9.3.1.4 Spain

9.3.1.5 U.K

9.3.1.6 Rest of Western Europe

9.3.2 Eastern Europe

9.4 Asia Pacific

9.4.1 Japan

9.4.2 China

9.4.3 India

9.4.4 Australia

9.4.5 Republic of Korea

9.4.6 Rest of Asia Pacific

9.5 The Middle East & Africa

9.5.1 United Arab Emirates

9.5.2 Saudi Arabia

9.5.3 Rest of the Middle East & Africa

Chapter 10 Company Landscape

10.1 Introduction

10.2 Market Share Analysis

10.3 Key Development & Strategies

10.3.1 Key Developments

Chapter 11 Company Profiles

11.1 GlaxoSmithKline Plc

11.1.1 Company Overview

11.1.2 Treatment Overview

11.1.3 Financials

11.1.4 SWOT Analysis

11.2 Johnson & Johnson

11.2.1 Company Overview

11.2.2 Treatment Overview

11.2.3 Financial Overview

11.2.4 Key Developments

11.2.5 SWOT Analysis

11.3 Sanofi

11.3.1 Company Overview

11.3.2 Treatment Overview

11.3.3 Financial Overview

11.3.4 Key Development

11.3.5 SWOT Analysis

11.4 Pfizer Inc.

11.4.1 Company Overview

11.4.2 Treatment/Business Segment Overview

11.4.3 Financial Overview

11.4.4 Key Development

11.4.5 SWOT Analysis

11.5 Novartis AG

11.5.1 Company Overview

11.5.2 Treatment Overview

11.5.3 Financial overview

11.5.4 Key Developments

11.6 Abbott Laboratories

11.6.1 Company Overview

11.6.2 Treatment Overview

11.6.3 Financial Overview

11.6.4 Key Developments

11.7 Sunovion Pharmaceuticals

11.7.1 Overview

11.7.2 Treatment Overview

11.7.3 Financials

11.7.4 Key Developments

11.7.5 SWOT Analysis

11.8 Cephalon

11.8.1 Company Overview

11.8.2 Treatment/Business Segment Overview

11.8.3 Financial Overview

11.8.4 Key Development

11.8.5 SWOT Analysis

11.9 DSM

11.9.1 Company Overview

11.9.2 Treatment Overview

11.9.3 Financial overview

11.9.4 Key Developments

11.10 Vitamin Shoppe

11.10.1 Company Overview

11.10.2 Treatment/Business Segment Overview

11.10.3 Financial Overview

11.10.4 Key Development

11.10.5 SWOT Analysis

11.11 Intas Pharmaceutials Limited

11.11.1 Company Overview

11.11.2 Treatment Overview

11.11.3 Financial overview

11.11.4 Key Developments

11.12 Sun Pharmaceuticals Ltd.

11.12.1 Company Overview

11.12.2 Treatment/Business Segment Overview

11.12.3 Financial Overview

11.12.4 Key Development

11.12.5 SWOT Analysis

11.13 Emcure Pharmaceuticals Limited

11.13.1 Company Overview

11.13.2 Treatment Overview

11.13.3 Financial overview

11.13.4 Key Developments

11.14 Nutrilite

11.14.1 Company Overview

11.14.2 Treatment/Business Segment Overview

11.14.3 Financial Overview

11.14.4 Key Development

11.14.5 SWOT Analysis

11.15 NutraScience Labs

11.15.1 Company Overview

11.15.2 Treatment Overview

11.15.3 Financial overview

11.15.4 Key Developments

11.16 Others

Chapter 12 MRFR Conclusion

12.1 Key Findings

12.1.1 From CEO’s View Point

12.1.2 Unmet Needs of the Market

12.2 Key Companies to Watch

12.3 Prediction of Pharmaceutical industry

Chapter 13 Appendix

LIST OF TABLES

Table 1 Cone rod dystrophy Industry Synopsis, 2023 – 2030

Table 2 Cone rod dystrophy Market Estimates and Forecast, 2023 – 2030, (USD Million)

Table 3 Cone rod dystrophy Market by Region, 2023 – 2030, (USD Million)

Table 4 Cone rod dystrophy Market by Diagnosis, 2023 – 2030, (USD Million)

Table 5 Cone rod dystrophy Market by Treatment, 2023 – 2030, (USD Million)

Table 6 Cone rod dystrophy Market by End Users, 2023 – 2030, (USD Million)

Table 7 North America Cone rod dystrophy Market by Diagnosis, 2023 – 2030, (USD Million)

Table 8 North America Cone rod dystrophy Market by Treatment, 2023 – 2030, (USD Million)

Table 9 North America Cone rod dystrophy Market by End User, 2023 – 2030, (USD Million)

Table 10 US Cone rod dystrophy Market by Diagnosis, 2023 – 2030, (USD Million)

Table 11 US Cone rod dystrophy Market by Treatment, 2023 – 2030, (USD Million)

Table 12 US Cone rod dystrophy Market by End User, 2023 – 2030, (USD Million)

Table 13 Canada Cone rod dystrophy Market by Diagnosis, 2023 – 2030, (USD Million)

Table 14 Canada Cone rod dystrophy Market by Treatment, 2023 – 2030, (USD Million)

Table 15 Canada Cone rod dystrophy Market by End User, 2023 – 2030, (USD Million)

Table 16 South America Cone rod dystrophy Market by Diagnosis, 2023 – 2030, (USD Million)

Table 17 South America Cone rod dystrophy Market by Treatment, 2023 – 2030, (USD Million)

Table 18 South America Cone rod dystrophy Market by End User, 2023 – 2030, (USD Million)

Table 19 Europe Cone rod dystrophy Market by Diagnosis, 2023 – 2030, (USD Million)

Table 20 Europe Cone rod dystrophy Market by Treatment, 2023 – 2030, (USD Million)

Table 21 Europe Cone rod dystrophy Market by End User, 2023 – 2030, (USD Million)

Table 22 Western Europe Cone rod dystrophy Market by Diagnosis, 2023 – 2030, (USD Million)

Table 23 Western Europe Cone rod dystrophy Market by Treatment, 2023 – 2030, (USD Million)

Table 24 Western Europe Cone rod dystrophy Market by End User, 2023 – 2030, (USD Million)

Table 25 Eastern Europe Cone rod dystrophy Market by Diagnosis, 2023 – 2030, (USD Million)

Table 26 Eastern Europe Cone rod dystrophy Market by Treatment, 2023 – 2030, (USD Million)

Table 27 Eastern Europe Cone rod dystrophy Market by End User, 2023 – 2030, (USD Million)

Table 28 Asia Pacific Cone rod dystrophy Market by Diagnosis, 2023 – 2030, (USD Million)

Table 29 Asia Pacific Cone rod dystrophy Market by Treatment, 2023 – 2030, (USD Million)

Table 30 Asia Pacific Cone rod dystrophy Market by End User, 2023 – 2030, (USD Million)

Table 31 The Middle East & Africa Cone rod dystrophy Market by Diagnosis, 2023 – 2030, (USD Million)

Table 32 The Middle East & Africa Cone rod dystrophy Market by Treatment, 2023 – 2030, (USD Million)

Table 33 The Middle East & Africa Cone rod dystrophy Market by End User, 2023 – 2030, (USD Million)

LIST OF FIGURES

Figure 1 Research Process

Figure 2 Segmentation for Cone rod dystrophy Market

Figure 3 Segmentation Market Dynamics for Cone rod dystrophy Market

Figure 4 Global Cone rod dystrophy Market Share, by Diagnosis 2023

Figure 5 Global Cone rod dystrophy Market Share, by Treatment 2023

Figure 6 Global Cone rod dystrophy Market Share, by End Users, 2023

Figure 7 Global Cone rod dystrophy Market Share, by Region, 2023

Figure 8 North America Cone rod dystrophy Market Share, by Country, 2023

Figure 9 Europe Cone rod dystrophy Market Share, by Country, 2023

Figure 10 Asia Pacific Cone rod dystrophy Market Share, by Country, 2023

Figure 11 The Middle East & Africa Cone rod dystrophy Market Share, by Country, 2023

Figure 12 Global Cone rod dystrophy Market: Company Share Analysis, 2023 (%)

Figure 13 GlaxoSmithKline Plc: Key Financials

Figure 14 GlaxoSmithKline Plc: Segmental Revenue

Figure 15 GlaxoSmithKline Plc: Geographical Revenue

Figure 16 Johnson & Johnson: Key Financials

Figure 17 Johnson & Johnson: Segmental Revenue

Figure 18 Johnson & Johnson: Geographical Revenue

Figure 19 Sanofi: Key Financials

Figure 20 Sanofi: Segmental Revenue

Figure 22 Sanofi: Geographical Revenue

Figure 23 Pfizer Inc.: Key Financials

Figure 24 Pfizer Inc.: Segmental Revenue

Figure 25 Pfizer Inc.: Geographical Revenue

Figure 27 Novartis AG: Key Financials

Figure 28 Novartis AG: Segmental Revenue

Figure 29 Novartis AG: Geographical Revenue

Figure 30 Abbott Laboratories: Key Financials

Figure 32 Abbott Laboratories: Segmental Revenue

Figure 33 Abbott Laboratories: Geographical Revenue

Figure 33 Sunovion Pharmaceuticals: Key Financials

Figure 34 Sunovion Pharmaceuticals: Segmental Revenue

Figure 35 Sunovion Pharmaceuticals: Geographical Revenue

Figure 36 Cephalon: Key Financials

Figure 37 Cephalon: Segmental Revenue

Figure 38 Cephalon: Geographical Revenue

Figure 39 DSM: Key Financials

Figure 40 DSM: Segmental Revenue

Figure 41 DSM: Geographical Revenue

Figure 42 Amway: Key Financials

Figure 43 Amway: Segmental Revenue

Figure 44 Amway: Geographical Revenue

Figure 45 Vitamin Shoppe: Key Financials

Figure 46 Vitamin Shoppe: Segmental Revenue

Figure 47 Vitamin Shoppe: Geographical Revenue

Figure 48 Intas Pharmaceutials Limited: Key Financials

Figure 49 Intas Pharmaceutials Limited: Segmental Revenue

Figure 50 Intas Pharmaceutials Limited: Geographical Revenue

Figure 51 Sun Pharmaceuticals Ltd: Key Financials

Figure 52 Sun Pharmaceuticals Ltd: Segmental Revenue

Figure 53 Sun Pharmaceuticals Ltd: Geographical Revenue

Figure 54 Emcure Pharmaceuticals Limited: Key Financials

Figure 55 Emcure Pharmaceuticals Limited: Segmental Revenue

Figure 56 Emcure Pharmaceuticals Limited: Geographical Revenue

Figure 57 Nutrilite: Key Financials

Figure 58 Nutrilite: Segmental Revenue

Figure 59 Nutrilite: Geographical Revenue

Figure 60 NutraScience Labs: Key Financials

Figure 61 NutraScience Labs: Segmental Revenue

Figure 62 NutraScience Labs: Geographical Revenue

Leading companies partner with us for data-driven Insights.
Report List icon Report List icon Report List icon Report List icon Report List icon Report List icon Report List icon Report List icon Report List icon Report List icon Report List icon

Kindly complete the form below to receive a free sample of this Report

Please fill in Business Email for Quick Response
Invalid