Certified Global Research Member
Isomar fd.webp Wcrc 57.webp
Key Questions Answered
  • Global Market Outlook
  • In-depth analysis of global and regional trends
  • Analyze and identify the major players in the market, their market share, key developments, etc.
  • To understand the capability of the major players based on products offered, financials, and strategies.
  • Identify disrupting products, companies, and trends.
  • To identify opportunities in the market.
  • Analyze the key challenges in the market.
  • Analyze the regional penetration of players, products, and services in the market.
  • Comparison of major playersโ€™ financial performance.
  • Evaluate strategies adopted by major players.
  • Recommendations
Why Choose Market Research Future?
  • Vigorous research methodologies for specific market.
  • Knowledge partners across the globe
  • Large network of partner consultants.
  • Ever-increasing/ Escalating data base with quarterly monitoring of various markets
  • Trusted by fortune 500 companies/startups/ universities/organizations
  • Large database of 5000+ markets reports.
  • Effective and prompt pre- and post-sales support.

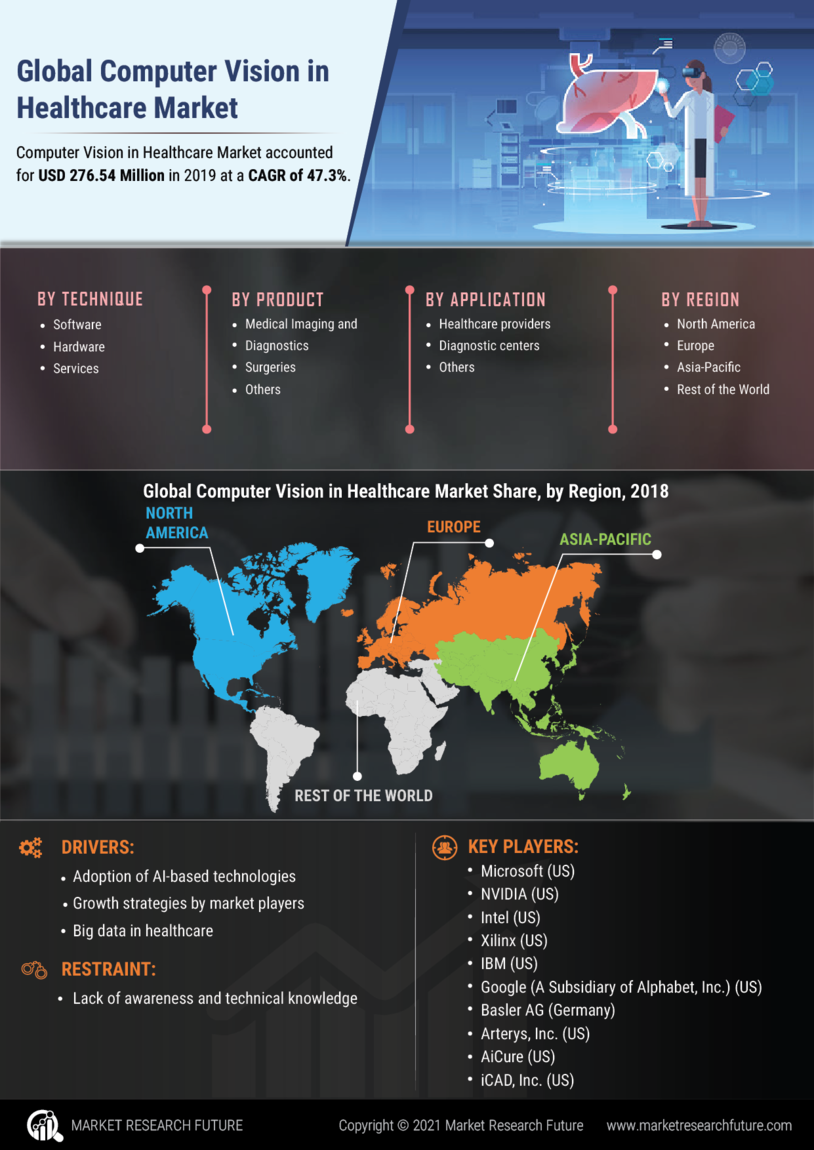
Computer Vision in Healthcare Market Research Report Information By Product & Service (Software, Hardware, Services), By Application (Medical Imaging and Diagnostics, Surgeries, Others) and By End User (Healthcare providers, Diagnostic centers, Others) โ€“ Forecast to 2030


ID: MRFR/HC/8835-HCR | 90 Pages | Author: Kinjoll Dey| April 2024
Leading companies partner with us for data-driven Insights
client_1 client_2 client_3 client_4 client_5 client_6 client_7 client_8 client_9 client_10
Please fill in Business Email for Quick Response

Table of Contents

1. EXECUTIVE SUMMARY

1.1. Market Attractiveness Analysis

1.1.1. Global Computer Vision in Healthcare Market, by Products & Service

1.1.2. Global Computer Vision in Healthcare Market, by Application

1.1.3. Global Computer Vision in Healthcare Market, by End User

2. MARKET INTRODUCTION

2.1. Definition

2.2. Scope of the Study

2.2.1. Research Objective

2.2.2. Assumptions

2.2.3. Limitations

3. RESEARCH METHODOLOGY

3.1. Overview

3.2. Data Mining

3.3. Secondary Research

3.4. Primary Research

3.4.1. Breakdown of Primary Respondents

3.5. Forecasting Techniques

3.6. Research Methodology for Market Size Estimation

3.6.1. Bottom-Up Approach

3.6.2. Top-Down Approach

3.7. Data Triangulation

3.8. Validation

4. MARKET DYNAMICS

4.1. Overview

4.2. Drivers

4.2.1. Increasing Demand for Computer Vision Systems in the Healthcare Industry

4.2.2. Increasing number of government initiatives

4.3. Restraints

4.3.1. Lack of Awareness and Technical Knowledge

4.4. Opportunities

5. MARKET FACTOR ANALYSIS

5.1. Porterโ€™s Five Forces Analysis

5.1.1. Bargaining Power of Suppliers

5.1.2. Bargaining Power of Buyers

5.1.3. Threat of New Entrants

5.1.4. Threat of Substitutes

5.1.5. Intensity of Rivalry

5.2. Value Chain Analysis

5.2.1. R&D and Designing

5.2.2. Manufacturing

5.2.3. Distribution & Sales

5.2.4. Post Sales Services

5.3. Impact of Covid-19 on Computer Vision in Healthcare Market

5.3.1. Impact on Supply Chain

5.3.2. Impact on Productions

5.3.3. Impact on Pricing

5.3.4. Impact on Regions

6. GLOBAL COMPUTER VISION IN HEALTHCARE MARKET, BY PRODUCTS & SERVICE

6.1. Overview

6.2. Hardware

Market Estimates & Forecast, by Region, 2022โ€“2030

Market Estimates & Forecast, by Country, 2022โ€“2030

6.2.1. Processors

Market Estimates & Forecast, by Region, 2022โ€“2030

Market Estimates & Forecast, by Country, 2022โ€“2030

6.2.2. Memory devices

Market Estimates & Forecast, by Region, 2022โ€“2030

Market Estimates & Forecast, by Country, 2022โ€“2030

6.2.3. Networks

Market Estimates & Forecast, by Region, 2022โ€“2030

Market Estimates & Forecast, by Country, 2022โ€“2030

6.3. Software

Market Estimates & Forecast, by Region, 2022โ€“2030

Market Estimates & Forecast, by Country, 2022โ€“2030

6.3.1. Cloud-based

Market Estimates & Forecast, by Region, 2022โ€“2030

Market Estimates & Forecast, by Country, 2022โ€“2030

6.3.2. On-premises

Market Estimates & Forecast, by Region, 2022โ€“2030

Market Estimates & Forecast, by Country, 2022โ€“2030

6.4. Services

Market Estimates & Forecast, by Region, 2022โ€“2030

Market Estimates & Forecast, by Country, 2022โ€“2030

7. GLOBAL COMPUTER VISION IN HEALTHCARE MARKET, BY APPLICATION

7.1. Overview

7.2. Medical imaging and diagnostics

Market Estimates & Forecast, by Region, 2022โ€“2030

Market Estimates & Forecast, by Country, 2022โ€“2030

7.3. Surgeries

Market Estimates & Forecast, by Region, 2022โ€“2030

Market Estimates & Forecast, by Country, 2022โ€“2030

7.4. Others

Market Estimates & Forecast, by Region, 2022โ€“2030

Market Estimates & Forecast, by Country, 2022โ€“2030

8. GLOBAL COMPUTER VISION IN HEALTHCARE MARKET, BY END USER

8.1. Overview

8.2. Healthcare providers

Market Estimates & Forecast, by Region, 2022โ€“2030

Market Estimates & Forecast, by Country, 2022โ€“2030

8.3. Diagnostic Center

Market Estimates & Forecast, by Region, 2022โ€“2030

Market Estimates & Forecast, by Country, 2022โ€“2030

8.4. Others

Market Estimates & Forecast, by Region, 2022โ€“2030

Market Estimates & Forecast, by Country, 2022โ€“2030

9. GLOBAL COMPUTER VISION IN HEALTHCARE MARKET, BY REGION

9.1. Overview

9.2. Americas

9.2.1. North America

9.2.1.1. US

9.2.1.2. Canada

9.2.2. Latin America

9.3. Europe

9.3.1. Western Europe

9.3.1.1. Germany

9.3.1.2. France

9.3.1.3. Italy

9.3.1.4. Spain

9.3.1.5. UK

9.3.1.6. Rest of Western Europe

9.3.2. Eastern Europe

9.4. Asia-Pacific

9.4.1. Japan

9.4.2. China

9.4.3. India

9.4.4. Australia

9.4.5. South Korea

9.4.6. Rest of Asia-Pacific

9.5. Middle East & Africa

9.5.1. Middle East

9.5.2. Africa

10. COMPANY LANDSCAPE

10.1. Overview

10.2. Competitor Dashboard

10.3. Major Growth Strategy in the Global Computer Vision in Healthcare Market

10.4. Competitive Benchmarking

10.4.1. The Leading Player in terms of Number of Developments in the Global Computer Vision in Healthcare Market

10.5. Key Developments & Growth Strategies

10.6. Major Players Financial Matrix & Market Ratio

11. COMPANY PROFILES

11.1. Advanced Cyclotron Systems, Inc.

11.1.1. Company Overview

11.1.2. Products/Services Offered

11.1.3. Financial Overview

11.1.4. Key Developments

11.1.5. SWOT Analysis

11.1.6. Key Strategies

11.2. NVIDIA

11.3. Intel

11.4. Xilinx

11.5. IBM

11.6. Google (A Subsidiary of Alphabet, Inc.)

11.7. Basler AG

11.8. Arterys, Inc.

11.9. AiCure

11.10. iCAD, Inc.

11.11. Others

12. APPENDIX

12.1. References

12.2. Related Reports

LIST OF TABLES

TABLE 1 GLOBAL COMPUTER VISION IN HEALTHCARE MARKET SYNOPSIS, 2022โ€“2030 (USD MILLION)

TABLE 2 GLOBAL COMPUTER VISION IN HEALTHCARE MARKET ESTIMATES & FORECAST, 2022โ€“2030 (USD MILLION)

TABLE 3 GLOBAL COMPUTER VISION IN HEALTHCARE MARKET, BY PRODUCTS & SERVICE, 2022โ€“2030 (USD MILLION)

TABLE 4 GLOBAL COMPUTER VISION IN HEALTHCARE MARKET, BY APPLICATION, 2022โ€“2030 (USD MILLION)

TABLE 5 GLOBAL COMPUTER VISION IN HEALTHCARE MARKET, BY END USER, 2022โ€“2030 (USD MILLION)

TABLE 6 GLOBAL COMPUTER VISION IN HEALTHCARE MARKET, BY REGION, 2022โ€“2030 (USD MILLION)

TABLE 7 NORTH AMERICA: COMPUTER VISION IN HEALTHCARE MARKET, BY PRODUCTS & SERVICE, 2022โ€“2030 (USD MILLION)

TABLE 8 NORTH AMERICA: COMPUTER VISION IN HEALTHCARE MARKET, BY APPLICATION, 2022โ€“2030 (USD MILLION)

TABLE 9 NORTH AMERICA: COMPUTER VISION IN HEALTHCARE MARKET, BY END USER, 2022โ€“2030 (USD MILLION)

TABLE 10 NORTH AMERICA: COMPUTER VISION IN HEALTHCARE MARKET, BY COUNTRY, 2022โ€“2030 (USD MILLION)

TABLE 11 US: COMPUTER VISION IN HEALTHCARE MARKET, BY PRODUCTS & SERVICE, 2022โ€“2030 (USD MILLION)

TABLE 12 US: COMPUTER VISION IN HEALTHCARE MARKET, BY APPLICATION, 2022โ€“2030 (USD MILLION)

TABLE 13 US: COMPUTER VISION IN HEALTHCARE MARKET, BY END USER, 2022โ€“2030 (USD MILLION)

TABLE 14 CANADA: COMPUTER VISION IN HEALTHCARE MARKET, BY PRODUCTS & SERVICE, 2022โ€“2030 (USD MILLION)

TABLE 15 CANADA: COMPUTER VISION IN HEALTHCARE MARKET, BY APPLICATION, 2022โ€“2030 (USD MILLION)

TABLE 16 CANADA: COMPUTER VISION IN HEALTHCARE MARKET, BY END USER, 2022โ€“2030 (USD MILLION)

TABLE 17 LATIN AMERICA: COMPUTER VISION IN HEALTHCARE MARKET, BY PRODUCTS & SERVICE, 2022โ€“2030 (USD MILLION)

TABLE 18 LATIN AMERICA: COMPUTER VISION IN HEALTHCARE MARKET, BY APPLICATION, 2022โ€“2030 (USD MILLION)

TABLE 19 LATIN AMERICA: COMPUTER VISION IN HEALTHCARE MARKET, BY END USER, 2022โ€“2030 (USD MILLION)

TABLE 20 EUROPE: COMPUTER VISION IN HEALTHCARE MARKET, BY PRODUCTS & SERVICE, 2022โ€“2030 (USD MILLION)

TABLE 21 EUROPE: COMPUTER VISION IN HEALTHCARE MARKET, BY APPLICATION, 2022โ€“2030 (USD MILLION)

TABLE 22 EUROPE: COMPUTER VISION IN HEALTHCARE MARKET, BY END USER, 2022โ€“2030 (USD MILLION)

TABLE 23 EUROPE: COMPUTER VISION IN HEALTHCARE MARKET, BY COUNTRY, 2022โ€“2030 (USD MILLION)

TABLE 24

TABLE 25 WESTERN EUROPE: COMPUTER VISION IN HEALTHCARE MARKET, BY PRODUCTS & SERVICE, 2022โ€“2030 (USD MILLION)

TABLE 26 WESTERN EUROPE: COMPUTER VISION IN HEALTHCARE MARKET, BY APPLICATION, 2022โ€“2030 (USD MILLION)

TABLE 27 WESTERN EUROPE: COMPUTER VISION IN HEALTHCARE MARKET, BY END USER, 2022โ€“2030 (USD MILLION)

TABLE 28 WESTERN EUROPE: COMPUTER VISION IN HEALTHCARE MARKET, BY COUNTRY, 2022โ€“2030 (USD MILLION)

TABLE 29 EASTERN EUROPE: COMPUTER VISION IN HEALTHCARE MARKET, BY PRODUCTS & SERVICE, 2022โ€“2030 (USD MILLION)

TABLE 30 EASTERN EUROPE: COMPUTER VISION IN HEALTHCARE MARKET, BY APPLICATION, 2022โ€“2030 (USD MILLION)

TABLE 31 EASTERN EUROPE: COMPUTER VISION IN HEALTHCARE MARKET, BY END USER, 2022โ€“2030 (USD MILLION)

TABLE 32 ASIA-PACIFIC: COMPUTER VISION IN HEALTHCARE MARKET, BY PRODUCTS & SERVICE, 2022โ€“2030 (USD MILLION)

TABLE 33 ASIA-PACIFIC: COMPUTER VISION IN HEALTHCARE MARKET, BY APPLICATION, 2022โ€“2030 (USD MILLION)

TABLE 34 ASIA-PACIFIC: COMPUTER VISION IN HEALTHCARE MARKET, BY END USER, 2022โ€“2030 (USD MILLION)

TABLE 35 ASIA-PACIFIC: COMPUTER VISION IN HEALTHCARE MARKET, BY COUNTRY, 2022โ€“2030 (USD MILLION)

TABLE 36 MIDDLE EAST & AFRICA: COMPUTER VISION IN HEALTHCARE MARKET, BY PRODUCTS & SERVICE, 2022โ€“2030 (USD MILLION)

TABLE 37 MIDDLE EAST & AFRICA: COMPUTER VISION IN HEALTHCARE MARKET, BY APPLICATION, 2022โ€“2030 (USD MILLION)

TABLE 38 MIDDLE EAST & AFRICA: COMPUTER VISION IN HEALTHCARE MARKET, BY END USER, 2022โ€“2030 (USD MILLION)

TABLE 39 MIDDLE EAST & AFRICA: COMPUTER VISION IN HEALTHCARE MARKET, BY COUNTRY, 2022โ€“2030 (USD MILLION)

LIST OF FIGURES

FIGURE 1 RESEARCH PROCESS

FIGURE 2 MARKET STRUCTURE FOR THE GLOBAL COMPUTER VISION IN HEALTHCARE MARKET

FIGURE 3 MARKET DYNAMICS FOR THE GLOBAL COMPUTER VISION IN HEALTHCARE MARKET

FIGURE 4 GLOBAL COMPUTER VISION IN HEALTHCARE MARKET SHARE, BY PRODUCTS & SERVICE, 2018 (%)

FIGURE 5 GLOBAL COMPUTER VISION IN HEALTHCARE MARKET SHARE, BY APPLICATION, 2018 (%)

FIGURE 6 GLOBAL COMPUTER VISION IN HEALTHCARE MARKET SHARE, BY END USER, 2018 (%)

FIGURE 7 GLOBAL COMPUTER VISION IN HEALTHCARE MARKET SHARE, BY REGION, 2018 (%)

FIGURE 8 AMERICAS: COMPUTER VISION IN HEALTHCARE MARKET SHARE BY REGION, 2018 (%)

FIGURE 9 NORTH AMERICA: COMPUTER VISION IN HEALTHCARE MARKET SHARE, BY COUNTRY, 2018 (%)

FIGURE 10 EUROPE: COMPUTER VISION IN HEALTHCARE MARKET SHARE, BY REGION, 2018 (%)

FIGURE 11 WESTERN EUROPE: COMPUTER VISION IN HEALTHCARE MARKET SHARE, BY COUNTRY, 2018 (%)

FIGURE 12 ASIA-PACIFIC: COMPUTER VISION IN HEALTHCARE MARKET SHARE, BY COUNTRY, 2018 (%)

FIGURE 13 MIDDLE EAST & AFRICA: COMPUTER VISION IN HEALTHCARE MARKET SHARE, BY COUNTRY, 2018 (%)

FIGURE 14 GLOBAL COMPUTER VISION IN HEALTHCARE MARKET: COMPANY SHARE ANALYSIS, 2018 (%)

FIGURE 15 MICROSOFT.: KEY FINANCIALS

FIGURE 16 MICROSOFT: SEGMENTAL REVENUE

FIGURE 17 MICROSOFT: REGIONAL REVENUE

FIGURE 18 NVIDIA.: KEY FINANCIALS

FIGURE 19 NVIDIA: SEGMENTAL REVENUE

FIGURE 20 NVIDIA: REGIONAL REVENUE

FIGURE 21 INTEL: KEY FINANCIALS

FIGURE 22 INTEL: SEGMENTAL REVENUE

FIGURE 23 INTEL: REGIONAL REVENUE

FIGURE 24 XILINX.: KEY FINANCIALS

FIGURE 25 XILINX: SEGMENTAL REVENUE

FIGURE 26 XILINX: REGIONAL REVENUE

FIGURE 27 IBM: KEY FINANCIALS

FIGURE 28 IBM: SEGMENTAL REVENUE

FIGURE 29 IBM: REGIONAL REVENUE

FIGURE 30 BASLER AG: KEY FINANCIALS

FIGURE 31 BASLER AG: SEGMENTAL REVENUE

FIGURE 32 BASLER AG: REGIONAL REVENUE

FIGURE 33 AICURE: KEY FINANCIALS

FIGURE 34 AICURE: SEGMENTAL REVENUE

FIGURE 35 AICURE: REGIONAL REVENUE

FIGURE 36 ICAD, INC.: KEY FINANCIALS

FIGURE 37 ICAD, INC.: SEGMENTAL REVENUE

FIGURE 38 ICAD, INC.: REGIONAL REVENUE

Purchase Option
Single User $ 4,950
Multiuser License $ 5,950
Enterprise User $ 7,250
Compare Licenses
Tailored for You
  • Dedicated Research on any specifics segment or region.
  • Focused Research on specific players in the market.
  • Custom Report based only on your requirements.
  • Flexibility to add or subtract any chapter in the study.
  • Historic data from 2014 and forecasts outlook till 2040.
  • Flexibility of providing data/insights in formats (PDF, PPT, Excel).
  • Provide cross segmentation in applicable scenario/markets.