Compressed Air Treatment Equipment Market Segmentation
Compressed Air Treatment Equipment Market By Product (USD Billion, 2025-2035)
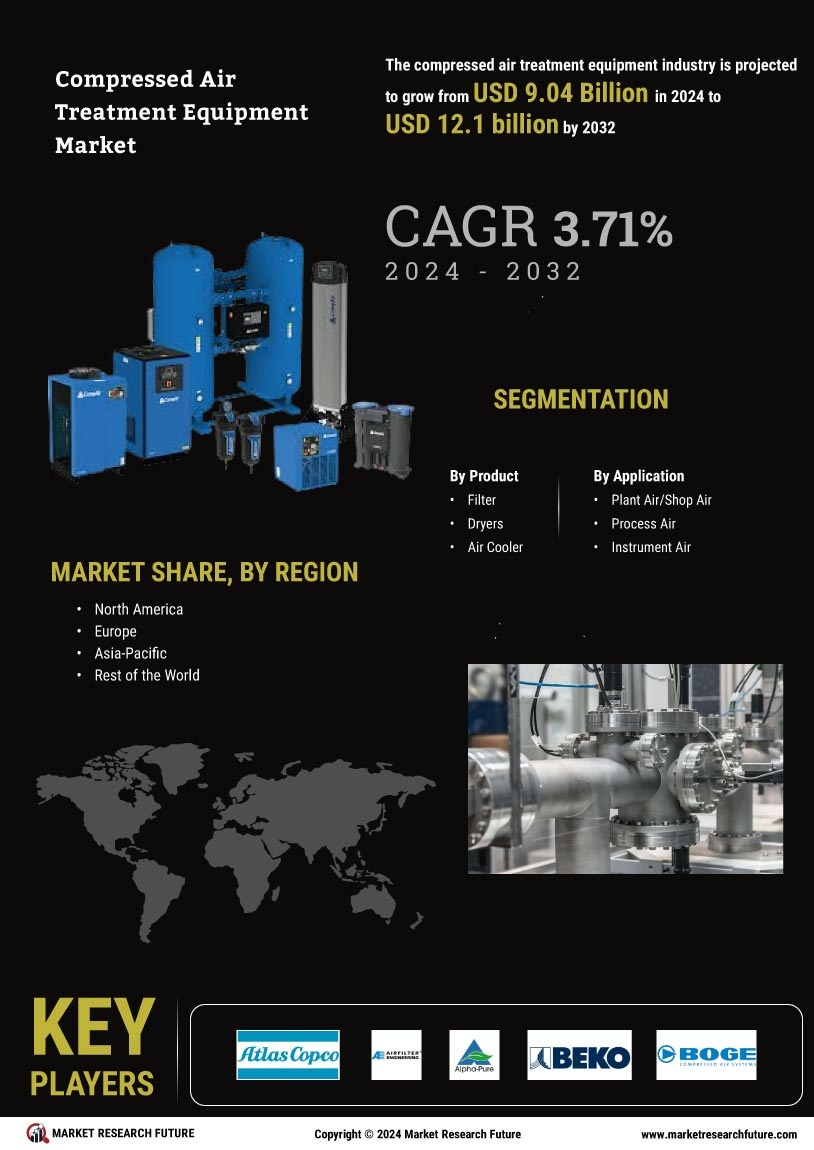
- Filters
- Dryers
- Air Coolers
Compressed Air Treatment Equipment Market By Application (USD Billion, 2025-2035)
- Plant Air/Shop Air
- Process Air
- Instrument Air
- Breathing Air