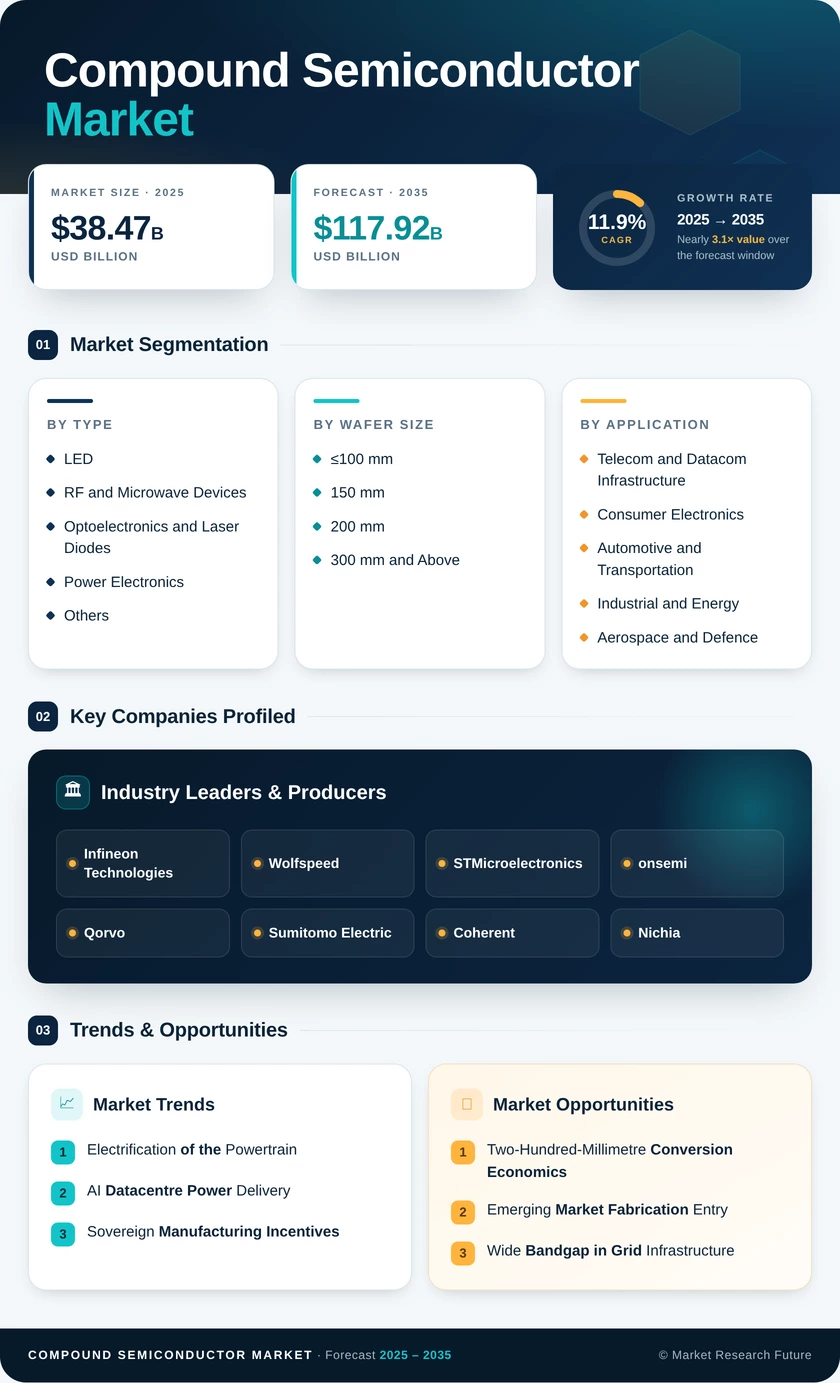
Compound Semiconductor Market (2026 – 2035)

ID: MRFR/SEM/8651-HCR 200 Pages Apoorva Priyadarshi Last Updated: October 27, 2026
Compound Semiconductor Market Size, Share and Research Report: By Application (Telecommunications, Consumer Electronics, Lighting, Automotive, Renewable Energy), By Material Type (Gallium Nitride, Gallium Arsenide, Indium Phosphide, Silicon Carbide, Zinc Oxide), By Device Type (RF Device, Power Device, LED, Photonic Device), By End Use (Industrial, Commercial, Residential) and By Regional (North America, Europe, South America, Asia Pacific, Middle East and Africa) - Industry Forecast Till 2035
Compound Semiconductor Market
Market Size
Forecast Period2026-2035
CAGR (2026-2035)11.90%
2025 Market SizeUSD 38.47 Billion
2035 Market SizeUSD 117.92 Billion
Key Players
Infineon Technologies
Wolfspeed
STMicroelectronics
onsemi
Qorvo
Sumitomo Electric
Opportunities
  • Two-Hundred-Millimetre Conversion Economics
  • Emerging Market Fabrication Entry
  • Wide Bandgap in Grid Infrastructure
  1. 1 Market Overview |
    1. 1.1 Study Assumptions & Market Definition |
    2. 1.2 Scope of the Study |
    3. 1.3 Research Methodology
  2. 2 Market Summary & Key Report Takeaways |
    1. 2.1 Key Takeaways by Technology |
    2. 2.2 Key Takeaways by Sector |
    3. 2.3 Key Takeaways by Geography
  3. 3 Global Market Size & Forecast (2021–2035) |
    1. 3.1 Historical Market Size (2021–2024) |
    2. 3.2 Base Year Estimate (2025) |
    3. 3.3 Forecast Market Size (2026–2035) |
    4. 3.4 Year-over-Year Growth Analysis
  4. 4 Market Drivers Analysis |
    1. 4.1 Electrification of the Powertrain |
    2. 4.2 AI Datacentre Power Delivery |
    3. 4.3 Sovereign Manufacturing Incentives |
    4. 4.4 Radio Frequency Infrastructure |
    5. 4.5 Micro-LED and Advanced Display Migration |
    6. 4.6 Fast-Charging and Renewable Inverter Demand
  5. 5 Market Restraints Analysis |
    1. 5.1 Capacity Running Ahead of Demand |
    2. 5.2 Raw Material Concentration Risk |
    3. 5.3 Substrate Quality Economics |
    4. 5.4 Capital Intensity of Epitaxy and Fab Tooling |
    5. 5.5 Design Engineering Talent Scarcity
  6. 6 Market Opportunity Analysis |
    1. 6.1 Two-Hundred-Millimetre Conversion Economics |
    2. 6.2 Emerging Market Fabrication Entry |
    3. 6.3 Wide Bandgap in Grid Infrastructure |
    4. 6.4 Design-Enablement and Reference Platforms |
    5. 6.5 Micro-LED Display Transition |
    6. 6.6 Industry Value Chain Analysis |
    7. 6.7 Porter's Five Forces Analysis
  7. 7 Regional Analysis |
    1. 7.1 North America | |
      1. 7.1.1 US | |
      2. 7.1.2 Canada | |
      3. 7.1.3 Mexico |
    2. 7.2 Europe | |
      1. 7.2.1 Germany | |
      2. 7.2.2 UK | |
      3. 7.2.3 France | |
      4. 7.2.4 Italy | |
      5. 7.2.5 Spain | |
      6. 7.2.6 Nordic Countries | |
      7. 7.2.7 Russia | |
      8. 7.2.8 Rest of Europe |
    3. 7.3 Asia-Pacific | |
      1. 7.3.1 China | |
      2. 7.3.2 India | |
      3. 7.3.3 Japan | |
      4. 7.3.4 South Korea | |
      5. 7.3.5 ASEAN | |
      6. 7.3.6 Rest of Asia-Pacific |
    4. 7.4 South America | |
      1. 7.4.1 Brazil | |
      2. 7.4.2 Argentina | |
      3. 7.4.3 Rest of South America |
    5. 7.5 Middle East & Africa | |
      1. 7.5.1 Saudi Arabia | |
      2. 7.5.2 UAE | |
      3. 7.5.3 South Africa | |
      4. 7.5.4 Egypt | |
      5. 7.5.5 Rest of Middle East & Africa
  8. 8 Future Outlook (2026–2035) |
    1. 8.1 The Electrification Supercycle Matures |
    2. 8.2 Substrate Supply Rebalances |
    3. 8.3 Grid and Industrial Conversion |
    4. 8.4 Sustainability Accounting Enters Procurement
  9. 9 Segmentation Analysis |
    1. 9.1 By Material Type | |
      1. 9.1.1 Gallium Arsenide | |
      2. 9.1.2 Gallium Nitride | |
      3. 9.1.3 Silicon Carbide | |
      4. 9.1.4 Indium Phosphide | |
      5. 9.1.5 Silicon Germanium | |
      6. 9.1.6 Others |
    2. 9.2 By Wafer Size | |
      1. 9.2.1 ≤100 mm | |
      2. 9.2.2 150 mm | |
      3. 9.2.3 200 mm | |
      4. 9.2.4 300 mm and Above |
    3. 9.3 By Device Type | |
      1. 9.3.1 LED | |
      2. 9.3.2 RF and Microwave Devices | |
      3. 9.3.3 Optoelectronics and Laser Diodes | |
      4. 9.3.4 Power Electronics | |
      5. 9.3.5 Others |
    4. 9.4 By End-User Industry | |
      1. 9.4.1 Telecom and Datacom Infrastructure | |
      2. 9.4.2 Consumer Electronics | |
      3. 9.4.3 Automotive and Transportation | |
      4. 9.4.4 Industrial and Energy | |
      5. 9.4.5 Aerospace and Defence | |
      6. 9.4.6 Healthcare and Others
  10. 10 Competitive Landscape |
    1. 10.1 Market Concentration Analysis |
    2. 10.2 Competitive Benchmarking Matrix |
    3. 10.3 Company Profiles | |
      1. 10.3.1 Infineon Technologies | |
      2. 10.3.2 Wolfspeed | |
      3. 10.3.3 STMicroelectronics | |
      4. 10.3.4 onsemi | |
      5. 10.3.5 Qorvo | |
      6. 10.3.6 Sumitomo Electric | |
      7. 10.3.7 Coherent | |
      8. 10.3.8 Nichia | |
      9. 10.3.9 ams OSRAM | |
      10. 10.3.10 ROHM Semiconductor | |
      11. 10.3.11 Mitsubishi Electric
  11. 11 Recent Developments & News
  12. 12 Report Scope & Methodology |
    1. 12.1 Study Period & Base Year |
    2. 12.2 Valuation Currency & Conventions |
    3. 12.3 CAGR Driver Disclaimer
  13. 13 Detailed Sources & Citations |
    1. 13.1 Data Sources |
    2. 13.2 Abbreviations
  14. 14 Frequently Asked Questions
  15. 15 LIST OF TABLES |
  16. TABLE 1 Global Compound Semiconductor Market Size & Forecast, by Revenue (USD Billion), 2021–2035 |
  17. TABLE 2 Global Compound Semiconductor Market – Year-over-Year Growth Analysis, 2021–2035 |
  18. TABLE 3 Driver Impact Analysis – Estimated Contribution to CAGR, 2026–2035 |
  19. TABLE 4 Restraint Impact Analysis – Estimated Drag on CAGR, 2026–2035 |
  20. TABLE 5 Global Compound Semiconductor Market Size, by Region, 2021–2035 (USD Billion) |
  21. TABLE 6 North America Compound Semiconductor Market Size, by Country, 2021–2035 (USD Billion) |
  22. TABLE 7 Europe Compound Semiconductor Market Size, by Country, 2021–2035 (USD Billion) |
  23. TABLE 8 Asia-Pacific Compound Semiconductor Market Size, by Country, 2021–2035 (USD Billion) |
  24. TABLE 9 South America Compound Semiconductor Market Size, by Country, 2021–2035 (USD Billion) |
  25. TABLE 10 Middle East & Africa Compound Semiconductor Market Size, by Country, 2021–2035 (USD Billion) |
  26. TABLE 11 Global Compound Semiconductor Market Size, by Material Type, 2021–2035 (USD Billion) |
  27. TABLE 12 Global Compound Semiconductor Market Size, by Wafer Size, 2021–2035 (USD Billion) |
  28. TABLE 13 Global Compound Semiconductor Market Size, by Device Type, 2021–2035 (USD Billion) |
  29. TABLE 14 Global Compound Semiconductor Market Size, by End-User Industry, 2021–2035 (USD Billion) |
  30. TABLE 15 North America Compound Semiconductor Market Size, by Material Type, 2021–2035 (USD Billion) |
  31. TABLE 16 North America Compound Semiconductor Market Size, by Device Type, 2021–2035 (USD Billion) |
  32. TABLE 17 North America Compound Semiconductor Market Size, by End-User Industry, 2021–2035 (USD Billion) |
  33. TABLE 18 Europe Compound Semiconductor Market Size, by Material Type, 2021–2035 (USD Billion) |
  34. TABLE 19 Europe Compound Semiconductor Market Size, by Device Type, 2021–2035 (USD Billion) |
  35. TABLE 20 Europe Compound Semiconductor Market Size, by End-User Industry, 2021–2035 (USD Billion) |
  36. TABLE 21 Asia-Pacific Compound Semiconductor Market Size, by Material Type, 2021–2035 (USD Billion) |
  37. TABLE 22 Asia-Pacific Compound Semiconductor Market Size, by Wafer Size, 2021–2035 (USD Billion) |
  38. TABLE 23 Asia-Pacific Compound Semiconductor Market Size, by Device Type, 2021–2035 (USD Billion) |
  39. TABLE 24 Asia-Pacific Compound Semiconductor Market Size, by End-User Industry, 2021–2035 (USD Billion) |
  40. TABLE 25 South America Compound Semiconductor Market Size, by Device Type, 2021–2035 (USD Billion) |
  41. TABLE 26 South America Compound Semiconductor Market Size, by End-User Industry, 2021–2035 (USD Billion) |
  42. TABLE 27 Middle East & Africa Compound Semiconductor Market Size, by Device Type, 2021–2035 (USD Billion) |
  43. TABLE 28 Middle East & Africa Compound Semiconductor Market Size, by End-User Industry, 2021–2035 (USD Billion) |
  44. TABLE 29 US Compound Semiconductor Market Size, by Material Type, 2021–2035 (USD Billion) |
  45. TABLE 30 China Compound Semiconductor Market Size, by Material Type, 2021–2035 (USD Billion) |
  46. TABLE 31 Japan Compound Semiconductor Market Size, by Device Type, 2021–2035 (USD Billion) |
  47. TABLE 32 Germany Compound Semiconductor Market Size, by End-User Industry, 2021–2035 (USD Billion) |
  48. TABLE 33 India Compound Semiconductor Market Size, by Wafer Size, 2021–2035 (USD Billion) |
  49. TABLE 34 Competitive Benchmarking Matrix – Global Compound Semiconductor Market, 2026 |
  50. TABLE 35 Company Profiles – Key Players, Global Compound Semiconductor Market |
  51. TABLE 36 Recent Developments & Strategic Announcements, 2023–2025 |
  52. TABLE 37 Report Scope & Methodology Summary |
  53. TABLE 38 Detailed Sources & Citations Register
  54. 16 LIST OF FIGURES |
  55. FIGURE 1 Global Compound Semiconductor Market – Market Dynamics Snapshot (Drivers, Restraints, Opportunities) |
  56. FIGURE 2 Industry Value Chain Analysis – Substrate to System Integration |
  57. FIGURE 3 Porter's Five Forces Analysis – Global Compound Semiconductor Market |
  58. FIGURE 4 Global Compound Semiconductor Market Size Trend, 2021–2035 (USD Billion) |
  59. FIGURE 5 Year-over-Year Growth Trajectory, 2022–2035 (%) |
  60. FIGURE 6 Market Share by Material Type, 2025 vs 2035 (%) |
  61. FIGURE 7 Market Share by Wafer Size, 2025 vs 2035 (%) |
  62. FIGURE 8 Market Share by Device Type, 2025 vs 2035 (%) |
  63. FIGURE 9 Market Share by End-User Industry, 2025 vs 2035 (%) |
  64. FIGURE 10 Regional Revenue Share, 2025 (%) |
  65. FIGURE 11 Regional CAGR Comparison, 2026–2035 (%) |
  66. FIGURE 12 North America Country-Level Share Distribution, 2025 (%) |
  67. FIGURE 13 Europe Country-Level Share Distribution, 2025 (%) |
  68. FIGURE 14 Asia-Pacific Country-Level Share Distribution, 2025 (%) |
  69. FIGURE 15 Competitive Landscape – Estimated Revenue Share Bands, 2026 |
  70. FIGURE 16 Competitive Positioning Matrix – Capability vs Market Presence |
  71. FIGURE 17 Driver Impact Waterfall – Contribution to Forecast CAGR |
  72. FIGURE 18 Restraint Impact Waterfall – Drag on Forecast CAGR |
  73. FIGURE 19 150 mm to 200 mm Wafer Transition Timeline, 2025–2032 |
  74. FIGURE 20 Semiconductor Content per Electric Vehicle, 2021–2035 (USD)

Segmentation Quick Reference

DimensionSub-SegmentsDominant SegmentFastest Growing Segment
By Material TypeGallium Arsenide, Gallium Nitride, Silicon Carbide, Indium Phosphide, Silicon Germanium, OthersGallium ArsenideSilicon Carbide
By Wafer Size≤100 mm, 150 mm, 200 mm, 300 mm and Above150 mm200 mm
By Device TypeLED, RF and Microwave Devices, Optoelectronics and Laser Diodes, Power Electronics, OthersLEDPower Electronics
By End-User IndustryTelecom and Datacom Infrastructure, Consumer Electronics, Automotive and Transportation, Industrial and Energy, Aerospace and Defence, Healthcare and OthersTelecom and Datacom InfrastructureAutomotive and Transportation
By GeographyNorth America, Europe, Asia-Pacific, South America, Middle East & AfricaAsia-PacificAsia-Pacific


Market Segmentation Overview

By Material Type

Sub-SegmentKey Trend
Gallium ArsenideRetains handset RF and LED epitaxy volume on depreciated fab economics
Gallium NitrideExpanding from base stations into datacentre power supplies and fast chargers
Silicon CarbideAutomotive design pipeline drives fastest growth despite near-term price erosion
Indium PhosphideDatacentre optical transceiver demand supports capacity expansion
Silicon GermaniumAutomotive radar and mixed-signal front-ends sustain steady demand
OthersSpecialty sensing chemistries remain niche but strategically monitored


Material selection has become an economic decision rather than a purely technical one. Gallium arsenide survives on cost, silicon carbide grows on system-level savings, and gallium nitride occupies the widening middle where frequency and efficiency both matter. Substrate control, not device design, increasingly determines margin.

By Wafer Size

Sub-SegmentKey Trend
≤100 mmLegacy optoelectronics and specialty devices; gradual decline
150 mmMainstream production base with installed equipment advantage
200 mmCost-per-die lever for SiC and GaN; yield remains the constraint
300 mm and AboveGaN-on-silicon leverages existing high-volume silicon fabs


Wafer diameter transitions define the cost curve for this sector. The 150 mm base persists because equipment is amortised, but every credible SiC roadmap targets 200 mm before 2028. Execution quality — boule uniformity, defect density, edge yield — will separate winners from stranded capacity.

By Device Type

Sub-SegmentKey Trend
LEDLarge revenue base under sustained commodity pricing pressure
RF and Microwave DevicesGaN displacing LDMOS across base station and radar platforms
Optoelectronics and Laser DiodesDatacentre optics and LiDAR create dual demand streams
Power ElectronicsFastest-growing class; content per system rising alongside unit volume
OthersPhotovoltaic and specialty applications with localised demand


Device economics diverge sharply. LEDs generate revenue without pricing power, while power electronics captures both volume growth and rising content value. RF sits between the two, protected by qualification barriers in defence but exposed to operator capex cycles in commercial telecom.

By End-User Industry

Sub-SegmentKey Trend
Telecom and Datacom InfrastructureLargest current base; growth decelerating post initial 5G coverage
Consumer ElectronicsFast charging and display migration offset handset maturity
Automotive and TransportationHighest growth; 800 V architectures multiply content per vehicle
Industrial and EnergyMotor drives and inverters offer counter-cyclical stability
Aerospace and DefenceLong qualification cycles, premium pricing, resilient budgets
Healthcare and OthersImaging and laser systems provide steady specialty demand


End-market leadership is changing hands over the forecast decade. Telecom's incumbency reflects a completed build cycle, while automotive demand is still in its early compounding phase. Industrial and energy applications will act as ballast when automotive procurement pauses between platform generations.




Download PDF ×

We do not share your information with anyone. However, we may send you emails based on your report interest from time to time. You may contact us at any time to opt-out.