1 Executive Summary
2 Scope Of The Report
2.1 Market Definition
2.2 Scope Of The Study
2.2.1 Definition
2.2.2 Research Objective
2.2.3 Assumptions
2.2.4 Limitations
2.3 Research Process
2.3.1 Primary Research
2.3.2 Secondary Research
2.4 Market Size Estimation
2.5 Forecast Model
3 Market Landscape
3.1 Porterβs Five Forces Analysis
3.1.1 Threat Of New Entrants
3.1.2 Bargaining Power Of Buyers
3.1.3 Threat Of Substitutes
3.1.4 Segment Rivalry
3.1.5 Bargaining Power Of Buyers
3.2 Value Chain/Supply Chain Analysis
4 Market Dynamics
4.1 Introduction
4.2 Market Drivers
4.3 Market Restraints
4.4 Market Opportunities
5 Global Coiled Tubing Market, By Service Type
5.1 Introduction
5.2 Well Intervention
5.2.1 Market Estimates & Forecast, 2020β2027
5.2.2 Market Estimates & Forecast, By Region, 2020β2027
5.2.3 Well Completion
5.2.3.1 Market Estimates & Forecast, 2020β2027
5.2.3.2 Market Estimates & Forecast, By Region, 2020β2027
5.2.4 Well Cleaning
5.2.4.1 Market Estimates & Forecast, 2020β2027
5.2.4.2 Market Estimates & Forecast, By Region, 2020β2027
5.2.5 Others
5.2.5.1 Market Estimates & Forecast, 2020β2027
5.2.5.2 Market Estimates & Forecast, By Region, 2020β2027
5.3 Drilling
5.3.1 Market Estimates & Forecast, 2020β2027
5.3.2 Market Estimates & Forecast, By Region, 2020β2027
5.4 Others
5.4.1 Market Estimates & Forecast, 2020β2027
5.4.2 Market Estimates & Forecast, By Region, 2020β2027
6 Global Coiled Tubing Market, By Application
6.1 Introduction
6.2 Onshore
6.2.1 Market Estimates & Forecast, 2020β2027
6.2.2 Market Estimates & Forecast, By Region, 2020β2027
6.3 Offshore
6.3.1 Market Estimates & Forecast, 2020β2027
6.3.2 Market Estimates & Forecast, By Region, 2020β2027
7 Global Coiled Tubing Market, By Region
7.1 Introduction
7.2 North America
7.2.1 Market Estimates & Forecast, 2020β2027
7.2.2 Market Estimates & Forecast, By Service Type, 2020β2027
7.2.3 Market Estimates & Forecast, By Application, 2020β2027
7.2.4 US
7.2.4.1 Market Estimates & Forecast, 2020β2027
7.2.4.2 Market Estimates & Forecast, By Service Type, 2020β2027
7.2.4.3 Market Estimates & Forecast, By Application, 2020β2027
7.2.5 Canada
7.2.5.1 Market Estimates & Forecast, 2020β2027
7.2.5.2 Market Estimates & Forecast, By Service Type, 2020β2027
7.2.5.3 Market Estimates & Forecast, By Application, 2020β2027
7.2.6 Mexico
7.2.6.1 Market Estimates & Forecast, 2020β2027
7.2.6.2 Market Estimates & Forecast, By Service Type, 2020β2027
7.2.6.3 Market Estimates & Forecast, By Application, 2020β2027
7.3 Europe
7.3.1 Market Estimates & Forecast, 2020β2027
7.3.2 Market Estimates & Forecast, By Service Type, 2020β2027
7.3.3 Market Estimates & Forecast, By Application, 2020β2027
7.3.4 UK
7.3.4.1 Market Estimates & Forecast, 2020β2027
7.3.4.2 Market Estimates & Forecast, By Service Type, 2020β2027
7.3.4.3 Market Estimates & Forecast, By Application, 2020β2027
7.3.5 Russia
7.3.5.1 Market Estimates & Forecast, 2020β2027
7.3.5.2 Market Estimates & Forecast, By Product, 2020β2027
7.3.5.3 Market Estimates & Forecast, By Application, 2020β2027
7.3.6 Norway
7.3.6.1 Market Estimates & Forecast, 2020β2027
7.3.6.2 Market Estimates & Forecast, By Service Type, 2020β2027
7.3.6.3 Market Estimates & Forecast, By Application, 2020β2027
7.3.7 Rest Of Europe
7.3.7.1 Market Estimates & Forecast, 2020β2027
7.3.7.2 Market Estimates & Forecast, By Service Type, 2020β2027
7.3.7.3 Market Estimates & Forecast, By Application, 2020β2027
7.4 Asia-Pacific
7.4.1 Market Estimates & Forecast, 2020β2027
7.4.2 Market Estimates & Forecast, By Service Type, 2020β2027
7.4.3 Market Estimates & Forecast, By Application, 2020β2027
7.4.4 China
7.4.4.1 Market Estimates & Forecast, 2020β2027
7.4.4.2 Market Estimates & Forecast, By Service Type, 2020β2027
7.4.4.3 Market Estimates & Forecast, By Application, 2020β2027
7.4.5 India
7.4.5.1 Market Estimates & Forecast, 2020β2027
7.4.5.2 Market Estimates & Forecast, By Service Type, 2020β2027
7.4.5.3 Market Estimates & Forecast, By Application, 2020β2027
7.4.6 Indonesia
7.4.6.1 Market Estimates & Forecast, 2020β2027
7.4.6.2 Market Estimates & Forecast, By Service Type, 2020β2027
7.4.6.3 Market Estimates & Forecast, By Application, 2020β2027
7.4.7 Rest Of Asia-Pacific
7.4.7.1 Market Estimates & Forecast, 2020β2027
7.4.7.2 Market Estimates & Forecast, By Service Type, 2020β2027
7.4.7.3 Market Estimates & Forecast, By Application, 2020β2027
7.5 Middle East & Africa
7.5.1 Market Estimates & Forecast, 2020β2027
7.5.2 Market Estimates & Forecast, By Service Type, 2020β2027
7.5.3 Market Estimates & Forecast, By Application, 2020β2027
7.5.4 Saudi Arabia
7.5.4.1 Market Estimates & Forecast, 2020β2027
7.5.4.2 Market Estimates & Forecast, By Service Type, 2020β2027
7.5.4.3 Market Estimates & Forecast, By Application, 2020β2027
7.5.5 UAE
7.5.5.1 Market Estimates & Forecast, 2020β2027
7.5.5.2 Market Estimates & Forecast, By Service Type, 2020β2027
7.5.5.3 Market Estimates & Forecast, By Application, 2020β2027
7.5.6 Algeria
7.5.6.1 Market Estimates & Forecast, 2020β2027
7.5.6.2 Market Estimates & Forecast, By Service Type, 2020β2027
7.5.6.3 Market Estimates & Forecast, By Application, 2020β2027
7.5.7 Rest Of Middle East & Africa
7.5.7.1 Market Estimates & Forecast, 2020β2027
7.5.7.2 Market Estimates & Forecast, By Service Type, 2020β2027
7.5.7.3 Market Estimates & Forecast, By Application, 2020β2027
7.6 South America
7.6.1 Market Estimates & Forecast, 2020β2027
7.6.2 Market Estimates & Forecast, By Service Type, 2020β2027
7.6.3 Market Estimates & Forecast, By Application, 2020β2027
7.6.4 Brazil
7.6.4.1 Market Estimates & Forecast, 2020β2027
7.6.4.2 Market Estimates & Forecast, By Service Type, 2020β2027
7.6.4.3 Market Estimates & Forecast, By Application, 2020β2027
7.6.5 Argentina
7.6.5.1 Market Estimates & Forecast, 2020β2027
7.6.5.2 Market Estimates & Forecast, By Service Type, 2020β2027
7.6.5.3 Market Estimates & Forecast, By Application, 2020β2027
7.6.6 Rest Of South America
7.6.6.1 Market Estimates & Forecast, 2020β2027
7.6.6.2 Market Estimates & Forecast, By Service Type, 2020β2027
7.6.6.3 Market Estimates & Forecast, By Application, 2020β2027
8 Competitive Landscape
9 Company Profile
9.1 Schlumberger (US)
9.1.1 Company Overview
9.1.2 Products/Services Offered
9.1.3 Financial Overview
9.1.4 Key Developments
9.1.5 Key Strategies
9.1.6 SWOT Analysis
9.2 Halliburton (US)
9.2.1 Company Overview
9.2.2 Products/Services Offered
9.2.3 Financial Overview
9.2.4 Key Developments
9.2.5 Key Strategies
9.2.6 SWOT Analysis
9.3 Weatherford (US)
9.3.1 Company Overview
9.3.2 Products/Services Offered
9.3.3 Financial Overview
9.3.4 Key Developments
9.3.5 Key Strategies
9.3.6 SWOT Analysis
9.4 Baker Hughes, A GE Company, LLC (US)
9.4.1 Company Overview
9.4.2 Products/Services Offered
9.4.3 Financial Overview
9.4.4 Key Developments
9.4.5 Key Strategies
9.4.6 SWOT Analysis
9.5 Nabors Industries Ltd (UK)
9.5.1 Company Overview
9.5.2 Products/Services Offered
9.5.3 Financial Overview
9.5.4 Key Developments
9.5.5 Key Strategies
9.5.6 SWOT Analysis
9.6 Superior Energy Services Inc (US)
9.6.1 Company Overview
9.6.2 Products/Services Offered
9.6.3 Financial Overview
9.6.4 Key Developments
9.6.5 Key Strategies
9.6.6 SWOT Analysis
9.7 C&J Energy Services Inc (US)
9.7.1 Company Overview
9.7.2 Products/Services Offered
9.7.3 Financial Overview
9.7.4 Key Developments
9.7.5 Key Strategies
9.7.6 SWOT Analysis
9.8 Trican (Canada)
9.8.1 Company Overview
9.8.2 Products/Services Offered
9.8.3 Financial Overview
9.8.4 Key Developments
9.8.5 Key Strategies
9.8.6 SWOT Analysis
9.9 Calfrac Well Services Ltd (Canada)
9.9.1 Company Overview
9.9.2 Products/Services Offered
9.9.3 Financial Overview
9.9.4 Key Developments
9.9.5 Key Strategies
9.9.6 SWOT Analysis
9.10 RPC Inc (US)
9.10.1 Company Overview
9.10.2 Products/Services Offered
9.10.3 Financial Overview
9.10.4 Key Developments
9.10.5 Key Strategies
9.10.6 SWOT Analysis
9.11 Step Energy Services Ltd (Canada)
9.11.1 Company Overview
9.11.2 Products/Services Offered
9.11.3 Financial Overview
9.11.4 Key Developments
9.11.5 Key Strategies
9.11.6 SWOT Analysis
9.12 Key Energy Services, Inc (US)
9.12.1 Company Overview
9.12.2 Products/Services Offered
9.12.3 Financial Overview
9.12.4 Key Developments
9.12.5 Key Strategies
9.12.6 SWOT Analysis
9.13 Archer (Bermuda)
9.13.1 Company Overview
9.13.2 Products/Services Offered
9.13.3 Financial Overview
9.13.4 Key Developments
9.13.5 Key Strategies
9.13.6 SWOT Analysis
9.14 Sanjel Energy Services, Inc (Canada)
9.14.1 Company Overview
9.14.2 Products/Services Offered
9.14.3 Financial Overview
9.14.4 Key Developments
9.14.5 Key Strategies
9.14.6 SWOT Analysis
10 List Of Tables
TABLE 1 LIST OF ASSUMPTIONS
TABLE 2 TABLE 1: SHALE GAS PRODUCTION BY COUNTRY, 2015
TABLE 3 SERVICE TYPE MARKET ESTIMATES & FORECAST, BY REGION, 2020β2027 (USD MILLION)
TABLE 4 APPLICATION MARKET ESTIMATES & FORECAST, BY REGION, 2020β2027 (USD MILLION)
TABLE 5 GLOBAL COILED TUBING MARKET, BY REGION, 2020β2027 (USD MILLION)
TABLE 6 NORTH AMERICA: COILED TUBING MARKET, BY COUNTRY, 2020β2027 (USD MILLION)
TABLE 7 NORTH AMERICA: COILED TUBING MARKET, BY SERVICE TYPE, 2020β2027 (USD MILLION)
TABLE 8 NORTH AMERICA: COILED TUBING MARKET, BY APPLICATION, 2020β2027 (USD MILLION)
TABLE 9 US: COILED TUBING MARKET, BY APPLICATION, 2020β2027 (USD MILLION)
TABLE 10 CANADA: COILED TUBING MARKET, BY APPLICATION, 2020β2027 (USD MILLION)
TABLE 11 MEXICO: COILED TUBING MARKET, BY APPLICATION, 2020β2027 (USD MILLION)
TABLE 12 EUROPE: COILED TUBING MARKET, BY COUNTRY, 2020β2027 (USD MILLION)
TABLE 13 EUROPE: COILED TUBING MARKET, BY SERVICE TYPE, 2020β2027 (USD MILLION)
TABLE 14 EUROPE: COILED TUBING MARKET, BY APPLICATION, 2020β2027 (USD MILLION)
TABLE 15 UK: COILED TUBING MARKET, BY APPLICATION, 2020β2027 (USD MILLION)
TABLE 16 RUSSIA: COILED TUBING MARKET, BY APPLICATION, 2020β2027 (USD MILLION)
TABLE 17 NORWAY: COILED TUBING MARKET, BY APPLICATION, 2020β2027 (USD MILLION)
TABLE 18 REST OF EUROPE: COILED TUBING MARKET, BY APPLICATION, 2020β2027 (USD MILLION)
TABLE 19 ASIA-PACIFIC: COILED TUBING MARKET, BY COUNTRY, 2020β2027 (USD MILLION)
TABLE 20 ASIA-PACIFIC: COILED TUBING MARKET, BY SERVICE TYPE, 2020β2027 (USD MILLION)
TABLE 21 ASIA-PACIFIC: COILED TUBING MARKET, BY APPLICATION, 2020β2027 (USD MILLION)
TABLE 22 CHINA: COILED TUBING MARKET, BY APPLICATION, 2020β2027 (USD MILLION)
TABLE 23 INDIA: COILED TUBING MARKET, BY APPLICATION, 2020β2027 (USD MILLION)
TABLE 24 INDONESIA: COILED TUBING MARKET, BY APPLICATION, 2020β2027 (USD MILLION)
TABLE 25 REST OF ASIA-PACIFIC: COILED TUBING MARKET, BY APPLICATION, 2020β2027 (USD MILLION)
TABLE 26 MIDDLE EAST & AFRICA: COILED TUBING MARKET, BY COUNTRY, 2020β2027 (USD MILLION)
TABLE 27 MIDDLE EAST & AFRICA: COILED TUBING MARKET, BY SERVICE TYPE, 2020β2027 (USD MILLION)
TABLE 28 MIDDLE EAST & AFRICA: COILED TUBING MARKET, BY APPLICATION, 2020β2027 (USD MILLION)
TABLE 29 SAUDI ARABIA: COILED TUBING MARKET, BY APPLICATION, 2020β2027 (USD MILLION)
TABLE 30 UAE: COILED TUBING MARKET, BY APPLICATION, 2020β2027 (USD MILLION)
TABLE 31 ALGERIA: COILED TUBING MARKET, BY APPLICATION, 2020β2027 (USD MILLION)
TABLE 32 REST OF MIDDLE EAST & AFRICA: COILED TUBING MARKET, BY APPLICATION, 2020β2027 (USD MILLION)
TABLE 33 SOUTH AMERICA: COILED TUBING MARKET, BY COUNTRY, 2020β2027 (USD MILLION)
TABLE 34 SOUTH AMERICA: COILED TUBING MARKET, BY SERVICE TYPE, 2020β2027 (USD MILLION)
TABLE 35 SOUTH AMERICA: COILED TUBING MARKET, BY APPLICATION, 2020β2027 (USD MILLION)
TABLE 36 BRAZIL: COILED TUBING MARKET, BY APPLICATION, 2020β2027 (USD MILLION)
TABLE 37 ARGENTINA: COILED TUBING MARKET, BY APPLICATION, 2020β2027 (USD MILLION)
TABLE 38 REST OF SOUTH AMERICA: COILED TUBING MARKET, BY APPLICATION, 2020β2027 (USD MILLION)
TABLE 39 SCHLUMBERGER: THE MOST ACTIVE PLAYER IN THE GLOBAL COILED TUBING MARKET
TABLE 40 SCHLUMBERGER LIMITED: PRODUCT OFFERING
TABLE 41 SCHLUMBERGER LIMITED: KEY DEVELOPMENTS
TABLE 42 WEATHERFORD: PRODUCT OFFERING
TABLE 43 WEATHERFORD: KEY DEVELOPMENTS
TABLE 44 BAKER HUGHES, A GE COMPANY LLC: PRODUCT OFFERING
TABLE 45 BAKER HUGHES, A GE COMPANY LLC: KEY DEVELOPMENTS
TABLE 46 NABORS INDUSTRIES LTD: PRODUCT OFFERING
TABLE 47 NABORS INDUSTRIES LTD: KEY DEVELOPMENTS
TABLE 48 SUPERIOR ENERGY SERVICES, INC.: PRODUCT OFFERING
TABLE 49 C&J ENERGY SERVICES, INC.: PRODUCT OFFERING
TABLE 50 TRICAN: PRODUCT OFFERING
TABLE 51 CALFRAC WELL SERVICES LTD: PRODUCT OFFERING
TABLE 52 RPC, INC.: PRODUCT OFFERING
TABLE 53 STEP ENERGY SERVICES LTD: PRODUCT OFFERING
TABLE 54 STEP ENERGY SERVICES LTD: KEY DEVELOPMENTS
TABLE 55 KEY ENERGY SERVICES, LLC: PRODUCT OFFERING
11 List Of Figures
FIGURE 1 MARKET SYNOPSIS
FIGURE 2 MARKET ATTRACTIVENESS ANALYSIS: GLOBAL COILED TUBING MARKET
FIGURE 3 GLOBAL COILED TUBING MARKET ANALYSIS BY SERVICE TYPE
FIGURE 4 GLOBAL COILED TUBING MARKET ANALYSIS BY APPLICATION
FIGURE 5 GLOBAL COILED TUBING MARKET ANALYSIS BY REGION
FIGURE 6 GLOBAL COILED TUBING MARKET: MARKET STRUCTURE
FIGURE 7 KEY BUYING CRITERIA OF COILED TUBING
FIGURE 8 RESEARCH PROCESS OF MRFR
FIGURE 9 TOP DOWN & BOTTOM UP APPROACH
FIGURE 10 NORTH AMERICA MARKET SIZE & MARKET SHARE BY COUNTRY (2020 VS 2027)
FIGURE 11 EUROPE MARKET SIZE & MARKET SHARE BY COUNTRY (2020 VS 2027)
FIGURE 12 ASIA-PACIFIC & MARKET SHARE BY COUNTRY (2020 VS 2027)
FIGURE 13 MIDDLE EAST & AFRICA MARKET SIZE & MARKET SHARE BY COUNTRY (2020 VS 2027)
FIGURE 14 SOUTH AMERICA MARKET SIZE & MARKET SHARE BY COUNTRY (2020 VS 2027)
FIGURE 15 DROC ANALYSIS OF GLOBAL COILED TUBING MARKET
FIGURE 16 OFFSHORE OIL AND GAS PRODUCTION SCENARIO
FIGURE 17 DRIVERS IMPACT ANALYSIS: COILED TUBING MARKET
FIGURE 18 RESTRAINTS IMPACT ANALYSIS: COILED TUBING MARKET
FIGURE 19 PORTER'S FIVE FORCES ANALYSIS OF THE GLOBAL COILED TUBING MARKET
FIGURE 20 VALUE CHAIN: GLOBAL COILED TUBING MARKET
FIGURE 21 GLOBAL COILED TUBING MARKET, BY SERVICE TYPE, 2020 (% SHARE)
FIGURE 22 GLOBAL COILED TUBING MARKET, BY SERVICE TYPE, 2020 TO 2027 (USD MILLION)
FIGURE 23 GLOBAL COILED TUBING MARKET, BY TYPE OF UTILITY, 2020 (% SHARE)
FIGURE 24 GLOBAL COILED TUBING MARKET, BY APPLICATION, 2020 TO 2027 (USD MILLION)
FIGURE 25 GLOBAL COILED TUBING MARKET, BY REGION, 2020 TO 2027 (USD MILLION)
FIGURE 26 NORTH AMERICA: COILED TUBING MARKET SHARE, BY COUNTRY, 2020 (% SHARE)
FIGURE 27 EUROPE: COILED TUBING MARKET SHARE, BY COUNTRY, 2020 (% SHARE)
FIGURE 28 ASIA-PACIFIC: COILED TUBING MARKET SHARE, BY COUNTRY, 2020 (% SHARE)
FIGURE 29 MIDDLE EAST & AFRICA: COILED TUBING MARKET SHARE, BY COUNTRY, 2020 (% SHARE)
FIGURE 30 SOUTH AMERICA: COILED TUBING MARKET SHARE, BY COUNTRY, 2020 (% SHARE)
FIGURE 31 COMPETITOR DASHBOARD: GLOBAL COILED TUBING MARKET
FIGURE 32 PRODUCT DEVELOPMENT: THE MAJOR STRATEGY ADOPTED BY KEY PLAYERS IN GLOBAL COILED TUBING MARKET
FIGURE 33 BENCHMARKING OF MAJOR COMPETITORS
FIGURE 34 MAJOR MANUFACTURER MARKET SHARE ANALYSIS, 2020
FIGURE 35 SCHLUMBERGER LIMITED: FINANCIAL OVERVIEW SNAPSHOT
FIGURE 36 SCHLUMBERGER LIMITED: SWOT ANALYSIS
FIGURE 37 HALLIBURTON: TOTAL REVENUE VS RESEARCH & DEVELOPMENT AND GEOGRAPHICAL REVENUE (2018β2020)
FIGURE 38 HALLIBURTON: SWOT ANALYSIS
FIGURE 39 WEATHERFORD: FINANCIAL OVERVIEW SNAPSHOT
FIGURE 40 WEATHERFORD: SWOT ANALYSIS
FIGURE 41 BAKER HUGHES, A GE COMPANY LLC: TOTAL REVENUE VS RESEARCH & DEVELOPMENT AND GEOGRAPHIC REVENUE (2018β2020)
FIGURE 42 BAKER HUGHES, A GE COMPANY LLC: SWOT ANALYSIS
FIGURE 43 NABORS INDUSTRIES LTD: FINANCIAL OVERVIEW SNAPSHOT
FIGURE 44 NABORS INDUSTRIES LTD: SWOT ANALYSIS
FIGURE 45 SUPERIOR ENERGY SERVICES, INC.: TOTAL REVENUE VS RESEARCH & DEVELOPMENT AND GEOGRAPHIC REVENUE (2018β2020)
FIGURE 46 SUPERIOR ENERGY SERVICES, INC.: SWOT ANALYSIS
FIGURE 47 C&J ENERGY SERVICES, INC.: TOTAL REVENUE VS RESEARCH & DEVELOPMENT AND GEOGRAPHIC REVENUE (2018β2020)
FIGURE 48 C&J ENERGY SERVICES, INC.: SWOT ANALYSIS
FIGURE 49 TRICAN: TOTAL REVENUE (2018-2020)
FIGURE 50 TRICAN: SWOT ANALYSIS
FIGURE 51 CALFRAC WELL SERVICES LTD: TOTAL REVENUE VS RESEARCH & DEVELOPMENT AND GEOGRAPHIC REVENUE (2018-2020)
FIGURE 52 CALFRAC WELL SERVICES LTD: SWOT ANALYSIS
FIGURE 53 RPC, INC.: TOTAL REVENUE VS RESEARCH & DEVELOPMENT AND GEOGRAPHIC REVENUE (2018-2020)
FIGURE 54 RPC, INC.: SWOT ANALYSIS
FIGURE 55 STEP ENERGY SERVICES LTD: TOTAL REVENUE VS RESEARCH & DEVELOPMENT AND GEOGRAPHIC REVENUE (2018-2020)
FIGURE 56 STEP ENERGY SERVICES LTD: SWOT ANALYSIS
FIGURE 57 KEY ENERGY SERVICES, LLC: TOTAL REVENUE VS RESEARCH & DEVELOPMENT AND GEOGRAPHIC REVENUE (2018-2020)
FIGURE 58 KEY ENERGY SERVICES, LLC: SWOT ANALYSIS
$4.0 Billion
5.70%
North America
2022-2027
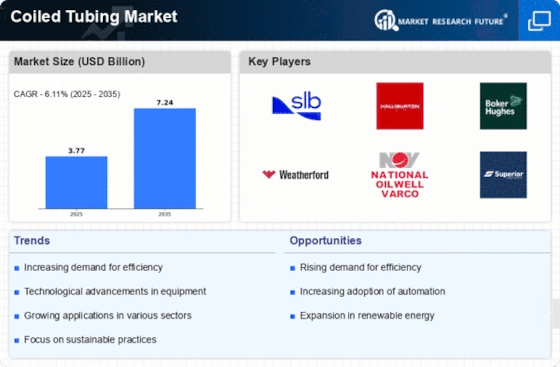
Market Research Future (MRFR) presumes the Coiled Tubing Market size to expand at 5.70% CAGR during the forecast period. The global market for coiled tubing is expected to see significant growth during the forecast period. The coiled tubing industry is powered by growing efforts by upstream companies to increase production from mature fields.
The outbreak of COVID-19 has impacted the global economy of various sectors, including the oil and gas, automotive, manufacturing, and power generation industries in a number of ways. The COVID-19 pandemic disrupted the supply chain of the oil and gas industry and adversely affected the exploration and production activities of the industry. Lockdown restrictions have sharply decreased global demand for oil and gas as the transportation sector has come to a standstill. Moreover, the disruption in demand and supply of oil and gas, which has resulted in significant financial losses in the industry, has led to job losses and pay cuts. However, as per the BP Statistical Review of World Energy 2019, the global production of oil and natural gas increased from 92,502 thousand barrels per day (TBPD) in 2017 to 94,718 TBPD in 2018, while natural gas production rose by 5.2% in 2018 with 3,677,7 billion cubic meters (bcm) in 2017 to 3,867,9 bcm in 2018. Nevertheless, the COVID-19 pandemic has been considerably disrupted this momentum. As coiled tubing is a required equipment for oil and gas production activities, the decline in demand for oil and gas has disrupted global demand for the coiled tubing industry.
In addition, major oil-producing countries such as the US, Russia, and Saudi Arabia have seen a sharp decline in demand and supply of oil and gas, which has had a direct effect on the global oil and gas market. The effects of the global oil price drop and the uncertainty in the policies and measures taken by the government authorities have caused a catastrophic blow to the worldwide economy, disruption of supply chains, and choking off demand and the supply of oil and gas. However, as the market stabilizes, demand for coiled tubing is expected to steadily regain its average growth rate by early 2021.
Notable players in the global coiled tubing market are Schlumberger (US), Halliburton (US), Weatherford (US), Baker Hughes, a GE Company LLC (US), Nabors Industries Ltd (UK), C&J Energy Services, Inc (US), Trican (Canada), Calfrac Well Services Ltd (Canada), RPC Inc (US), Step Energy Services Ltd (US), and Key Energy Services Inc (US).
Rising demand for well intervention operations is driving the coiled tubing market
High expenditure in global upstream and operational activities has begun to grow from the NOCs and integrated oil firms. In addition, with the growing demand for oil & gas, the oil & gas upstream sector is enhancing its operating activities and increasing production. All of these factors drive demand for the market.
Risks linked with coiled tubing operations and regulations associated with operational safety are restraining the market growth
Coiled tubing is a subtle piece of equipment, and the tubing is relatively thin-walled. As the tubing is continuously bent and straightened, frequently at high internal pressure, which can create a minor flaw, whether caused by corrosion or mechanically, due to which there are high chances for operational damage. Surveys show that over the last two decades, 80–90% of coiled tubing string failures have been associated with corrosion, human error, mechanical damage, and string manufacturing problems.
Global Coiled Tubing Industry has been segmented into Service Type and Application.
The well intervention segment is leading the market due to the increasing number of aging wells. The well intervention segment is divided into well completion, well cleaning, and others, including well perforation, well simulation, pumping, and circulation.
The onshore segment held a greater market share in 2018 as it is more feasible and cost-effective than offshore applications due to the use of smaller service rigs and mobile, self-contained coiled tubing rig for light operations. Furthermore, the rise in shale gas exploration, especially in the US, and the increase in drilling activities are estimated to drive the growth of onshore applications worldwide.
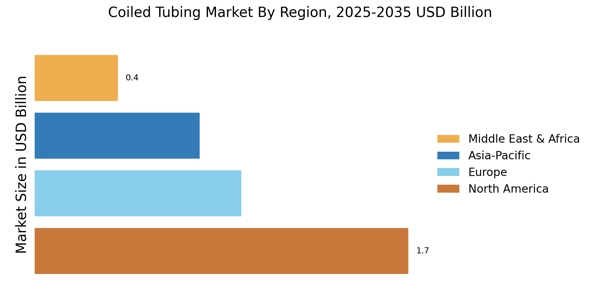
North America is expected to be the largest market between 2018 and 2023, led by the rise in unconventional resources in the US and Canada. Furthermore, demand for coiled tubing operations in offshore fields in the Gulf of Mexico and other offshore fields in the US is expected to boost the market growth
Eminent market players are focused on ventures and acquisitions to meet the competitive edge in the coiled tubing industry. Mergers and acquisitions are one of the main tactics adopted by leading players to gain market share. In addition, product upgrades, along with the development of a robust supply network, are some of the other major strategies pursued by global players to improve their current market shares. As a result, the global market trend for coiled tubing will see substantial growth over the forecast period.
In June 2020, Weatherford introduced the Velox Wellhead System, a solution for operators who need to lock in pressure integrity while improving safety and enhancing efficiency.
In January 2020, Halliburton was given seven contracts for drilling and completion services for the next stage of field development of the INPEX-operated Ichthys Project in the Browse Basin offshore northern Australia.
This research report examines vital factors, constraints, and challenges in the global coiled tubing market, regional and segment revenue estimates, and evaluations. The base year is 2018; the prediction period is 2018-2023. The segmentation of the market is represented in the following manner.
Report Attribute/Metric | Details |
---|---|
Market Size | 2030: Significant Value |
CAGR | 5.70% CAGR (2022-2030) |
Base Year | 2021 |
Forecast Period | 2022-2030 |
Historical Data | 2019 & 2020 |
Forecast Units | Value (USD Million) |
Report Coverage | Revenue Forecast, Competitive Landscape, Growth Factors, and Trends |
Segments Covered | Service Type, Application |
Geographies Covered | North America, Europe, Asia-Pacific, and Rest of the World (RoW) |
Key Vendors | Schlumberger (US), Halliburton (US), Weatherford (US), Baker Hughes, a GE Company LLC (US), Nabors Industries Ltd (UK), C&J Energy Services, Inc (US), Trican (Canada), Calfrac Well Services Ltd (Canada), RPC Inc (US), Step Energy Services Ltd (US), and Key Energy Services Inc (US) |
Key Market Opportunities | High expenditure in global upstream and operational activities |
Key Market Drivers | Rising demand for well intervention operations is driving the coiled tubing market |
Frequently Asked Questions (FAQ) :
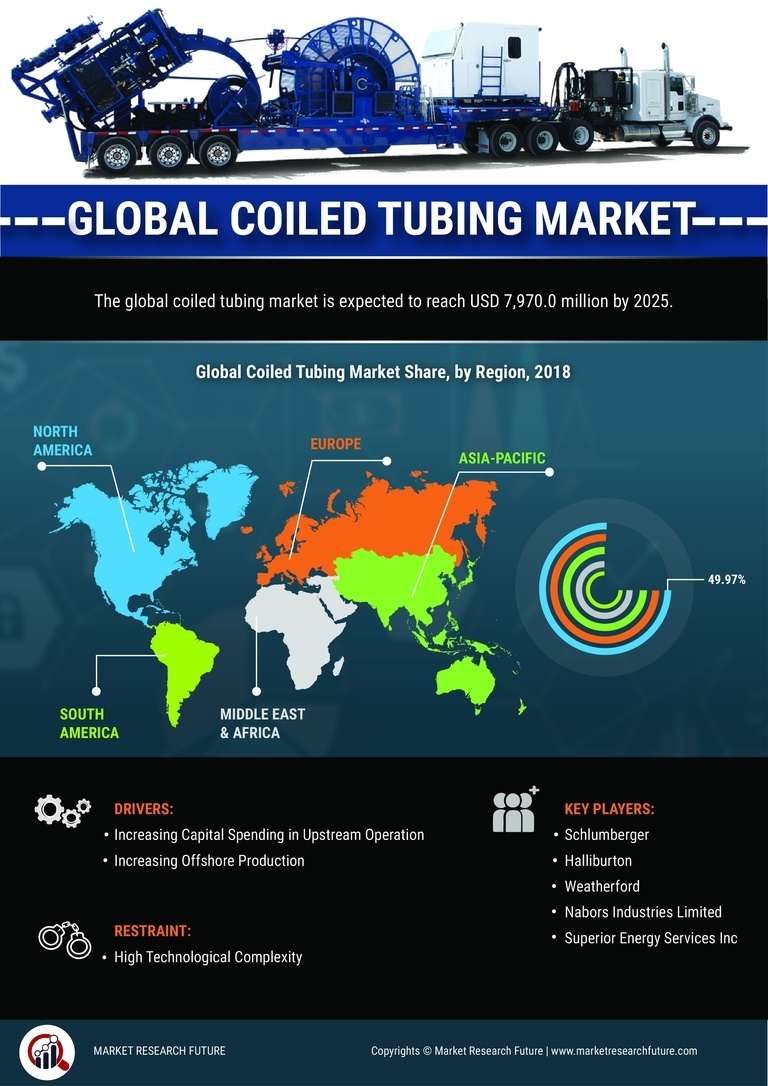
The coiled tubing global market is poised to reach USD 7970 Mn by 2025.
The coiled tubing global market is projected to strike 5.70% CAGR.
Rising investments in upstream operations are poised to drive the expansion of the coiled tubing market.
High technological complexity is projected to check the augmentation of the coiled tubing market.
The contributing participants are Schlumberger (US), Weatherford (US), Halliburton (US), Baker Hughes, a GE Company LLC (US), Step Energy Services Ltd (US), C&J Energy Services, Inc (US), Nabors Industries Ltd (UK), Trican (Canada), RPC Inc (US), Calfrac Well Services Ltd (Canada), and Key Energy Services Inc (US).
The service type-based segments of the coiled tubing market are drilling, well intervention, and others.
The sub-segments of the well intervention are well cleaning, well completion, and others.