Segmentation Quick Reference
| Dimension | Sub-Segments | Dominant Segment | Fastest Growing Segment |
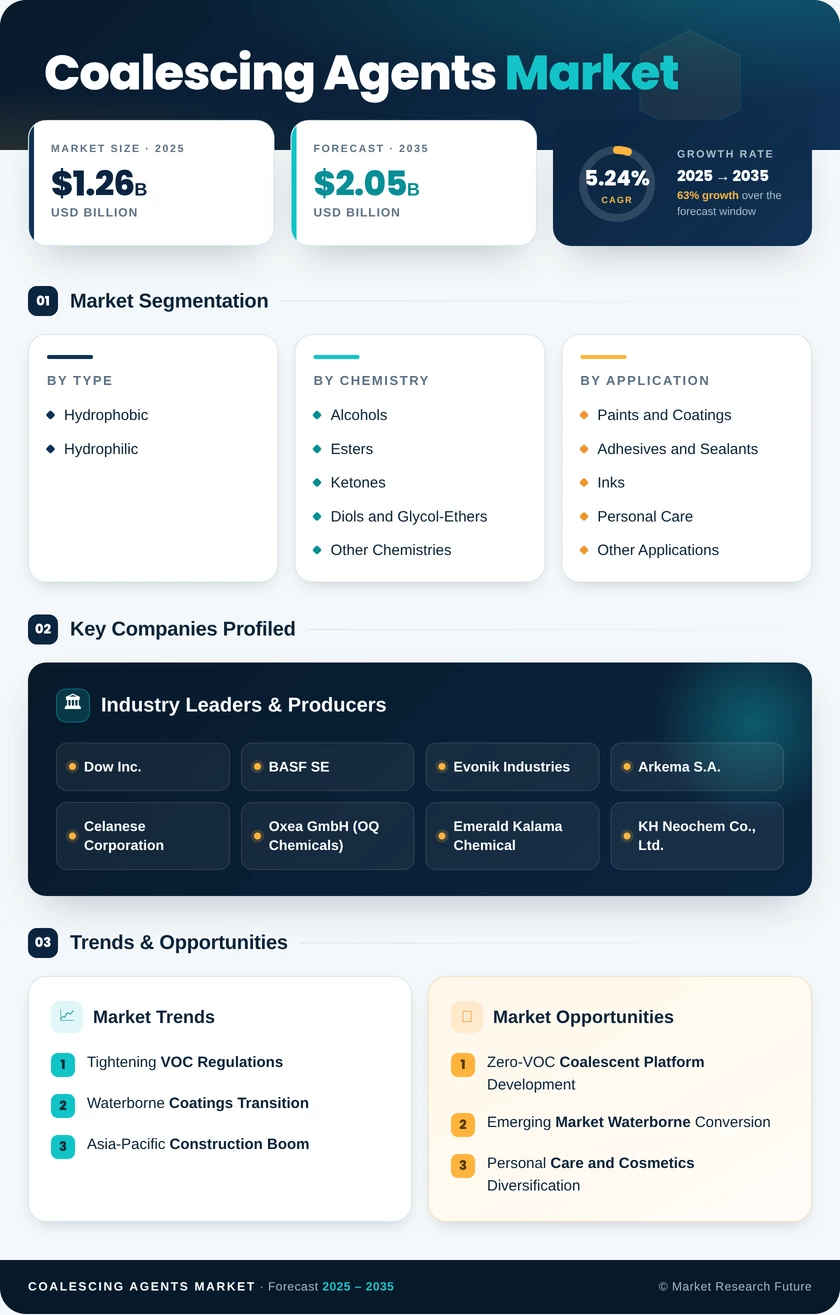
| By Type | Hydrophilic, Hydrophobic | Hydrophobic (64.3% share, 2025) | Hydrophilic (5.93% CAGR) |
| By Chemistry | Esters, Ketones, Alcohols, Diols and Glycol-Ethers, Other Chemistries | Alcohols (USD 0.55B, 2025) | Esters (5.75% CAGR) |
| By Application | Paints and Coatings, Adhesives and Sealants, Inks, Personal Care, Other Applications | Paints and Coatings (49.1% share, 2025) | Personal Care (6.15% CAGR) |
| By Geography | Asia-Pacific, North America, Europe, South America, Middle East & Africa | Asia-Pacific (41.0% share, 2025) | Asia-Pacific (5.71% CAGR) |
Market Segmentation Overview
By Type
| Sub-Segment | Key Trend |
| Hydrophilic | Growing demand in personal care emulsions and clean-beauty reformulations; improved shelf stability in high-pH latex systems |
| Hydrophobic | Continued dominance in acrylic and vinyl-acrylic latex dispersions for architectural and industrial paints |
Hydrophobic coalescents remain the default choice for conventional waterborne coatings, while hydrophilic grades are carving out high-growth niches in personal care and specialty adhesive applications driven by regulatory pressure for lower-emission formulations.
By Chemistry
| Sub-Segment | Key Trend |
| Esters | Fastest growth driven by low-odor, low-VOC performance in architectural coatings |
| Ketones | Stable demand in industrial protective coatings requiring fast evaporation rates |
| Alcohols | Largest segment anchored by Texanol and glycol-ether derivatives as industry-standard coalescents |
| Diols and Glycol-Ethers | High-performance niche for automotive and aerospace coating applications |
| Other Chemistries | Emerging bio-based and hybrid chemistries targeting zero-VOC certification |
Alcohols maintain volume leadership due to decades of formulation optimization, but esters are gaining share as regulators worldwide tighten VOC thresholds and formulators prioritize low-odor performance.
By Application
| Sub-Segment | Key Trend |
| Paints and Coatings | Dominant application; architectural segment drives volume, automotive refinish drives value |
| Adhesives and Sealants | Waterborne conversion in construction sealants expanding coalescent use |
| Inks | Packaging ink reformulation for food-contact compliance increasing demand |
| Personal Care | Fastest-growing segment; clean-beauty trends drive adoption of cosmetics-grade coalescents |
| Other Applications | Textile finishing, leather treatment, and specialty emulsions |
Paints and coatings account for nearly half of global coalescent consumption, but personal care represents the most dynamic growth frontier as cosmetics and skincare brands reformulate away from traditional solvent-based systems.
By Geography
| Sub-Segment | Key Trend |
| Asia-Pacific | Largest and fastest-growing region; China and India drive volume through construction and urbanization |
| North America | Regulatory-led demand from EPA VOC mandates; premium pricing for low-VOC grades |
| Europe | Mature market with strong innovation in bio-based and reactive coalescents |
| South America | Early-stage waterborne conversion; Brazil dominates regional consumption |
| Middle East & Africa | Infrastructure mega-projects in Saudi Arabia and UAE creating new demand corridors |
Asia-Pacific's combination of scale, feedstock economics, and accelerating regulatory adoption positions it as the center of gravity for global coalescent demand through 2035.