Cloud Storage Gateway Market (2026 – 2035)

ID: MRFR/ICT/29721-HCR 128 Pages Nirmit Biswas Last Updated: September 17, 2026
Cloud Storage Gateway Market Size, Share and Research Report By Component (Software and Services), By PoS Type (Fixed PoS and Mobile/MPoS), By Deployment Model (Public Cloud, Private Cloud, and Hybrid Cloud), By Organization Size (Small and Medium Enterprises (SMEs) and Large Enterprises), By End-User Industry (Retail and Consumer Goods, Hospitality and Restaurants, Healthcare, Entertainment and Leisure, Transportation and Logistics, and Others), And By Region (North America, Europe, Asia-Pacific, And Rest Of The World) – Industry Forecast Till 2035
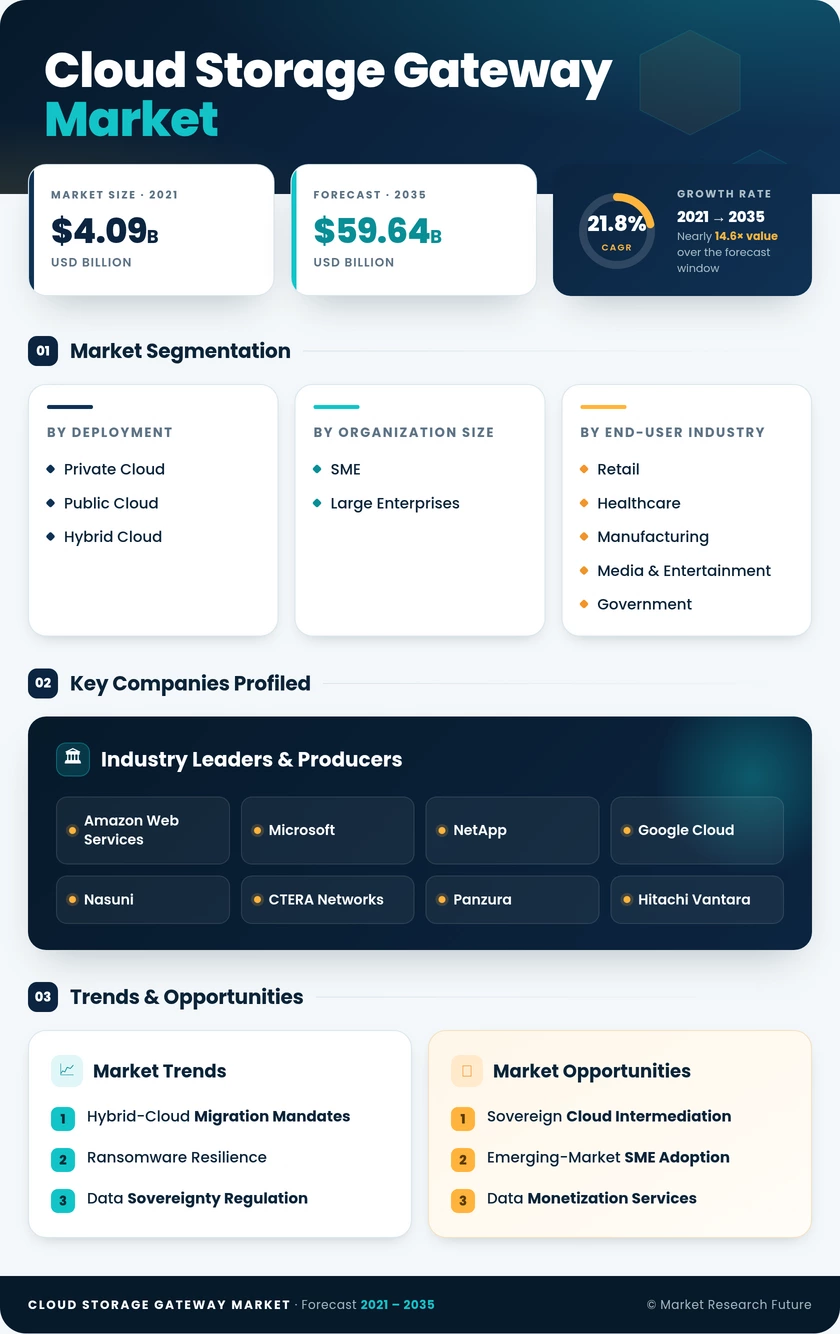
Cloud Storage Gateway Market
Market Size
Forecast Period2026-2035
CAGR (2026-2035)21.8%
2025 Market SizeUSD 8.28 Billion
2035 Market SizeUSD 59.64 Billion
Key Players
Amazon Web Services
Microsoft
NetApp
Google Cloud
Nasuni
CTERA Networks
Opportunities
  • Sovereign Cloud Intermediation
  • Emerging-Market SME Adoption
  • Data Monetization Services
  1. 1 Market Summary |
    1. 1.1 Study Assumptions & Market Definition |
    2. 1.2 Scope of the Study |
    3. 1.3 Research Methodology
  2. 2 Key Report Takeaways |
    1. 2.1 By Deployment |
    2. 2.2 By Sector |
    3. 2.3 By Geography
  3. 3 Market Size & Forecast (2021–2035) |
    1. 3.1 Historical Market Size (2021–2025) |
    2. 3.2 Current & Forecast Market Size (2026–2035) |
    3. 3.3 Year-over-Year Growth Analysis
  4. 4 Driver Impact Analysis |
    1. 4.1 Hybrid-Cloud Migration Mandates |
    2. 4.2 Ransomware Resilience |
    3. 4.3 Data Sovereignty Regulation |
    4. 4.4 AI Data Pipeline Caching
  5. 5 Restraints Impact Analysis |
    1. 5.1 Egress Economics |
    2. 5.2 Bandwidth and Latency Constraints |
    3. 5.3 Security Accountability Gaps
  6. 6 Opportunities |
    1. 6.1 Sovereign Cloud Intermediation |
    2. 6.2 Emerging-Market SME Adoption |
    3. 6.3 Data Monetization Services |
    4. 6.4 AI-Native Storage Tiering |
    5. 6.5 Healthcare Imaging Archives
  7. 7 Regional Market Share & Country-Level Analysis |
    1. 7.1 North America | |
      1. 7.1.1 US | |
      2. 7.1.2 Canada | |
      3. 7.1.3 Mexico |
    2. 7.2 Europe | |
      1. 7.2.1 Germany | |
      2. 7.2.2 UK | |
      3. 7.2.3 France | |
      4. 7.2.4 Italy | |
      5. 7.2.5 Spain | |
      6. 7.2.6 Nordic Countries | |
      7. 7.2.7 Russia | |
      8. 7.2.8 Rest of Europe |
    3. 7.3 Asia-Pacific | |
      1. 7.3.1 China | |
      2. 7.3.2 India | |
      3. 7.3.3 Japan | |
      4. 7.3.4 South Korea | |
      5. 7.3.5 ASEAN | |
      6. 7.3.6 Rest of Asia-Pacific |
    4. 7.4 South America | |
      1. 7.4.1 Brazil | |
      2. 7.4.2 Argentina | |
      3. 7.4.3 Rest of South America |
    5. 7.5 Middle East & Africa | |
      1. 7.5.1 Saudi Arabia | |
      2. 7.5.2 UAE | |
      3. 7.5.3 South Africa | |
      4. 7.5.4 Egypt | |
      5. 7.5.5 Rest of MEA
  8. 8 Future Outlook (2026–2035) |
    1. 8.1 Autonomous Data Placement |
    2. 8.2 Platform Economics |
    3. 8.3 Sustainability Reporting |
    4. 8.4 Edge Convergence
  9. 9 Market Segmentation Analysis |
    1. 9.1 By Deployment | |
      1. 9.1.1 Private Cloud | |
      2. 9.1.2 Public Cloud | |
      3. 9.1.3 Hybrid Cloud |
    2. 9.2 By Organization Size | |
      1. 9.2.1 SME | |
      2. 9.2.2 Large Enterprises |
    3. 9.3 By End-user Industry | |
      1. 9.3.1 Retail | |
      2. 9.3.2 Healthcare | |
      3. 9.3.3 Manufacturing | |
      4. 9.3.4 Media & Entertainment | |
      5. 9.3.5 Government | |
      6. 9.3.6 Education | |
      7. 9.3.7 Other End-user Industries
  10. 10 Competitive Landscape |
    1. 10.1 Market Concentration Analysis |
    2. 10.2 Competitive Benchmarking Matrix |
    3. 10.3 Company Profiles | |
      1. 10.3.1 Amazon Web Services | |
      2. 10.3.2 Microsoft | |
      3. 10.3.3 NetApp | |
      4. 10.3.4 Google Cloud | |
      5. 10.3.5 Nasuni | |
      6. 10.3.6 CTERA Networks | |
      7. 10.3.7 Panzura | |
      8. 10.3.8 Hitachi Vantara | |
      9. 10.3.9 Dell Technologies | |
      10. 10.3.10 IBM | |
      11. 10.3.11 Oracle | |
      12. 10.3.12 Zadara
  11. 11 Recent News & Developments
  12. 12 Report Scope & Methodology |
    1. 12.1 Study Period & Base Year |
    2. 12.2 Valuation Currency |
    3. 12.3 Abbreviations
  13. 13 Detailed Sources & Citations
  14. 14 Frequently Asked Questions
  15. 15 LIST OF TABLES |
  16. TABLE 1 Global Cloud Storage Gateway Market Size & Forecast, by Revenue (USD Billion), 2021–2035 |
  17. TABLE 2 Global Cloud Storage Gateway Market – Year-over-Year Growth Analysis, 2021–2035 |
  18. TABLE 3 Driver Impact Analysis Matrix, 2026–2035 |
  19. TABLE 4 Restraint Impact Analysis Matrix, 2026–2035 |
  20. TABLE 5 Global Cloud Storage Gateway Market Size, by Region, 2021–2035 (USD Billion) |
  21. TABLE 6 North America Market Size, by Country, 2021–2035 (USD Billion) |
  22. TABLE 7 Europe Market Size, by Country, 2021–2035 (USD Billion) |
  23. TABLE 8 Asia-Pacific Market Size, by Country, 2021–2035 (USD Billion) |
  24. TABLE 9 South America Market Size, by Country, 2021–2035 (USD Billion) |
  25. TABLE 10 Middle East & Africa Market Size, by Country, 2021–2035 (USD Billion) |
  26. TABLE 11 Global Market Size, by Deployment, 2021–2035 (USD Billion) |
  27. TABLE 12 Global Market Size, by Organization Size, 2021–2035 (USD Billion) |
  28. TABLE 13 Global Market Size, by End-user Industry, 2021–2035 (USD Billion) |
  29. TABLE 14 North America Market Size, by Deployment, 2021–2035 (USD Billion) |
  30. TABLE 15 North America Market Size, by End-user Industry, 2021–2035 (USD Billion) |
  31. TABLE 16 Europe Market Size, by Deployment, 2021–2035 (USD Billion) |
  32. TABLE 17 Europe Market Size, by End-user Industry, 2021–2035 (USD Billion) |
  33. TABLE 18 Asia-Pacific Market Size, by Deployment, 2021–2035 (USD Billion) |
  34. TABLE 19 Asia-Pacific Market Size, by End-user Industry, 2021–2035 (USD Billion) |
  35. TABLE 20 South America Market Size, by Organization Size, 2021–2035 (USD Billion) |
  36. TABLE 21 Middle East & Africa Market Size, by Organization Size, 2021–2035 (USD Billion) |
  37. TABLE 22 Competitive Benchmarking Matrix, 2026 |
  38. TABLE 23 Company Profiles – Key Players |
  39. TABLE 24 Recent Developments & Strategic Announcements, 2023–2025 |
  40. TABLE 25 Report Scope & Methodology Parameters |
  41. TABLE 26 Detailed Sources & Citations Register
  42. 16 LIST OF FIGURES |
  43. FIGURE 1 Market Dynamics – Drivers, Restraints and Opportunities Snapshot |
  44. FIGURE 2 Industry Value Chain Analysis |
  45. FIGURE 3 Porter's Five Forces Analysis |
  46. FIGURE 4 Global Market Size Trend, 2021–2035 (USD Billion) |
  47. FIGURE 5 Year-over-Year Growth Curve, 2022–2035 (%) |
  48. FIGURE 6 Market Share by Deployment, 2025 vs 2035 (%) |
  49. FIGURE 7 Market Share by Organization Size, 2025 vs 2035 (%) |
  50. FIGURE 8 Market Share by End-user Industry, 2025 (%) |
  51. FIGURE 9 Regional Revenue Share, 2025 (%) |
  52. FIGURE 10 Regional CAGR Comparison, 2026–2035 (%) |
  53. FIGURE 11 North America Country-Level Share, 2025 (%) |
  54. FIGURE 12 Asia-Pacific Country-Level Growth Comparison, 2026–2035 (%) |
  55. FIGURE 13 Competitive Landscape – Estimated Revenue Share Bands, 2026 |
  56. FIGURE 14 Vendor Positioning Quadrant – Capability vs Multi-Cloud Neutrality |
  57. FIGURE 15 Regulatory Timeline Impact Map, 2023–2030

Segmentation Quick Reference

DimensionSub-SegmentsDominant SegmentFastest Growing Segment
By DeploymentPrivate Cloud, Public Cloud, Hybrid CloudHybrid CloudPublic Cloud
By Organization SizeSME, Large EnterprisesLarge EnterprisesSME
By End-user IndustryRetail, Healthcare, Manufacturing, Media & Entertainment, Government, Education, Other End-user IndustriesMedia & EntertainmentEducation
By GeographyNorth America, Europe, Asia-Pacific, South America, Middle East & AfricaNorth AmericaAsia-Pacific


Market Segmentation Overview

By Deployment

Sub-SegmentKey Trend
Private CloudSustained demand from defense, central banking, and classified archives requiring physical isolation
Public CloudFastest expansion as switching-fee removal and improved encryption controls reduce perceived risk
Hybrid CloudDefault enterprise architecture; policy engines pin regulated classes locally while bursting elsewhere


Deployment preference is a compliance decision dressed as a technical one. Hybrid retains the largest revenue pool because most regulated enterprises cannot fully exit on-premises footprints, while public deployment accelerates fastest as legal friction around portability continues to fall through the late 2020s.

By Organization Size

Sub-SegmentKey Trend
SMEVirtual appliance and subscription licensing removes capital barriers, opening emerging-market channel demand
Large EnterprisesMulti-site consolidation, audit obligations and petabyte-scale archives sustain the majority revenue base


Large enterprises will continue to generate most revenue through 2035, but the growth story sits with mid-sized firms reached through managed service providers. Pricing innovation, not product innovation, is the primary unlock in that segment.

By End-user Industry

Sub-SegmentKey Trend
RetailMulti-site surveillance retention and omnichannel asset libraries
HealthcareTwenty-year imaging retention obligations driving archive tiering
ManufacturingCAD, PLM and inspection data consolidation off aging filers
Media & Entertainment4K/8K production archives and global collaborative editing
GovernmentStatutory records retention with residency constraints
EducationResearch data management mandates from funding bodies
Other End-user IndustriesEnergy seismic datasets, legal discovery archives, logistics telemetry


Vertical demand correlates almost perfectly with average file size and retention duration. Media and healthcare lead on both variables, while education posts the sharpest growth as research-funding bodies attach data-management conditions to grants.




Download PDF ×

We do not share your information with anyone. However, we may send you emails based on your report interest from time to time. You may contact us at any time to opt-out.