Cloud Enterprise Content Management Market (2026 – 2035)

ID: MRFR/ICT/28281-HCR 100 Pages Nirmit Biswas Last Updated: September 29, 2026
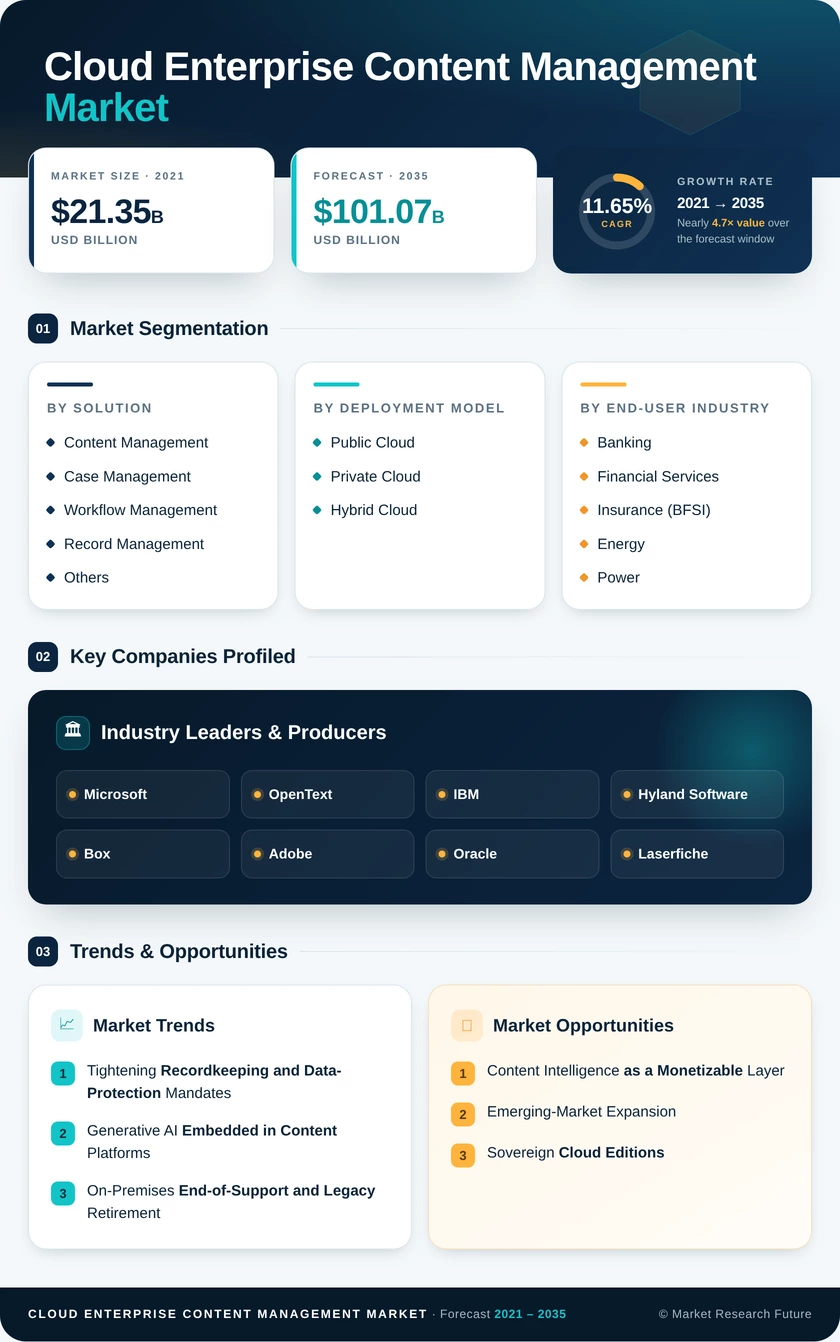
Cloud Enterprise Content Management Market Size, Share and Research Report By Solution (Content Management, Case Management, Workflow Management, Record Management, and Others), By Deployment Model (Public Cloud, Private Cloud, and Hybrid Cloud), By End-User Industry (Banking, Financial Services and Insurance (BFSI), Energy and Power, Manufacturing, Retail, Healthcare, Telecom and IT, Government, Education, and Others), By Service (Professional and Managed), By Organization Size (Small and Medium Enterprises, and Large Enterprises) And By Region (North America, Europe, Asia-Pacific, And Rest Of The World) – Industry Forecast Till 2035
Cloud Enterprise Content Management Market
Market Size
Forecast Period2026-2035
CAGR (2026-2035)11.65%
2025 Market SizeUSD 33.38 Billion
2035 Market SizeUSD 101.07 Billion
Key Players
Microsoft
OpenText
IBM
Hyland Software
Box
Adobe
Opportunities
  • Content Intelligence as a Monetizable Layer
  • Emerging-Market Expansion
  • Sovereign Cloud Editions
  1. 1 Market Summary | |
  2. 2 Key Report Takeaways | |
    1. 2.1 By Solution | |
    2. 2.2 By Deployment Model | |
    3. 2.3 By End-User Industry | |
    4. 2.4 By Service | |
    5. 2.5 By Organization Size | |
    6. 2.6 By Region | |
  3. 3 Market Size and Forecast (2021–2035) | |
  4. 4 Driver Impact Analysis | |
    1. 4.1 Tightening Recordkeeping and Data-Protection Mandates | |
    2. 4.2 Generative AI Embedded in Content Platforms | |
    3. 4.3 On-Premises End-of-Support and Legacy Retirement | |
    4. 4.4 Persistent Hybrid Work Patterns | |
    5. 4.5 Digital Government and Data-Protection Laws in Asia-Pacific | |
    6. 4.6 Healthcare Interoperability Rules | |
  5. 5 Restraints Impact Analysis | |
    1. 5.1 Data Residency and Cross-Border Transfer Uncertainty | |
    2. 5.2 Complexity of Legacy Repository Migration | |
    3. 5.3 Egress Fees and Cost Unpredictability | |
    4. 5.4 Cybersecurity and Ransomware Exposure | |
    5. 5.5 Shortage of Cloud and Security Skills | |
  6. 6 Opportunities | |
    1. 6.1 Content Intelligence as a Monetizable Layer | |
    2. 6.2 Emerging-Market Expansion | |
    3. 6.3 Sovereign Cloud Editions | |
    4. 6.4 Managed Compliance Services | |
    5. 6.5 Sustainability-Reporting Evidence Trails | |
  7. 7 Regional Market Share and Country-Level Analysis | |
    1. 7.1 North America | | |
      1. 7.1.1 United States | | |
      2. 7.1.2 Canada | |
    2. 7.2 Europe | | |
      1. 7.2.1 Germany | | |
      2. 7.2.2 United Kingdom | | |
      3. 7.2.3 France | | |
      4. 7.2.4 Rest of Europe | |
    3. 7.3 Asia-Pacific | | |
      1. 7.3.1 China | | |
      2. 7.3.2 Japan | | |
      3. 7.3.3 India | | |
      4. 7.3.4 Australia | | |
      5. 7.3.5 Rest of Asia-Pacific | |
    4. 7.4 South America | | |
      1. 7.4.1 Brazil | | |
      2. 7.4.2 Rest of South America | |
    5. 7.5 Middle East & Africa | | |
      1. 7.5.1 Saudi Arabia | | |
      2. 7.5.2 United Arab Emirates | | |
      3. 7.5.3 South Africa | | |
      4. 7.5.4 Rest of Middle East & Africa | |
  8. 8 Future Outlook (2026–2035) | |
    1. 8.1 Agentic AI and Autonomous Content Operations | |
    2. 8.2 Platform Consolidation and Consumption Economics | |
    3. 8.3 Sovereign and Hybrid Infrastructure | |
    4. 8.4 ESG Reporting and Records Defensibility | |
  9. 9 Segmentation Analysis | |
    1. 9.1 By Solution | | |
      1. 9.1.1 Content Management | | |
      2. 9.1.2 Case Management | | |
      3. 9.1.3 Workflow Management | | |
      4. 9.1.4 Record Management | | |
      5. 9.1.5 Others | |
    2. 9.2 By Deployment Model | | |
      1. 9.2.1 Public Cloud | | |
      2. 9.2.2 Private Cloud | | |
      3. 9.2.3 Hybrid Cloud | |
    3. 9.3 By End-User Industry | | |
      1. 9.3.1 Banking, Financial Services and Insurance (BFSI) | | |
      2. 9.3.2 Energy and Power | | |
      3. 9.3.3 Manufacturing | | |
      4. 9.3.4 Retail | | |
      5. 9.3.5 Healthcare | | |
      6. 9.3.6 Telecom and IT | | |
      7. 9.3.7 Government | | |
      8. 9.3.8 Education | | |
      9. 9.3.9 Others | |
    4. 9.4 By Service | | |
      1. 9.4.1 Professional | | |
      2. 9.4.2 Managed | |
    5. 9.5 By Organization Size | | |
      1. 9.5.1 Small and Medium Enterprises | | |
      2. 9.5.2 Large Enterprises | |
  10. 10 Competitive Landscape | |
  11. 11 Recent News & Developments | |
  12. 12 Report Scope and Methodology | |
  13. 13 Detailed Sources and Citations | |
  14. 14 Frequently Asked Questions (FAQs) | | LIST OF TABLES | |
  15. TABLE 1 Global Market Snapshot — Key Metrics, 2025–2035 | |
  16. TABLE 2 Global Market Size & Forecast, by Revenue (USD Billion), 2021–2035 | |
  17. TABLE 3 Driver Impact Analysis | |
  18. TABLE 4 Restraints Impact Analysis | |
  19. TABLE 5 Regional Summary, 2025–2035 | |
  20. TABLE 6 North America — Country-Level Analysis | |
  21. TABLE 7 Europe — Country-Level Analysis | |
  22. TABLE 8 Asia-Pacific — Country-Level Analysis | |
  23. TABLE 9 South America — Country-Level Analysis | |
  24. TABLE 10 Middle East & Africa — Country-Level Analysis | |
  25. TABLE 11 Global Market, by Solution, 2025–2035 | |
  26. TABLE 12 Global Market, by Deployment Model, 2025–2035 | |
  27. TABLE 13 Global Market, by End-User Industry, 2025–2035 | |
  28. TABLE 14 Global Market, by Service, 2025–2035 | |
  29. TABLE 15 Global Market, by Organization Size, 2025–2035 | |
  30. TABLE 16 Competitive Benchmarking Table, 2025 | |
  31. TABLE 17 Report Scope and Methodology | |
  32. TABLE 18 Detailed Sources and Citations | |
  33. TABLE 19 Segmentation Quick Reference | | LIST OF FIGURES | |
  34. FIGURE 1 Market Dynamics Overview — Drivers, Restraints and Opportunities | |
  35. FIGURE 2 Industry Value Chain Analysis | |
  36. FIGURE 3 Porter's Five Forces Analysis | |
  37. FIGURE 4 Global Market Size Trend, 2021–2035 (USD Billion) | |
  38. FIGURE 5 Market Share by Solution, 2025 | |
  39. FIGURE 6 Market Share by Deployment Model, 2025 | |
  40. FIGURE 7 Market Share by End-User Industry, 2025 | |
  41. FIGURE 8 Market Share by Service, 2025 | |
  42. FIGURE 9 Market Share by Organization Size, 2025 | |
  43. FIGURE 10 Regional Market Share, 2025 | |
  44. FIGURE 11 Regional Growth Comparison, 2026–2035 CAGR | |
  45. FIGURE 12 Competitive Positioning Matrix | |
  46. FIGURE 13 Estimated Revenue Share Ranges of Key Players, 2025

Segmentation Quick Reference

DimensionSub-SegmentsDominant SegmentFastest Growing Segment
By SolutionContent Management; Case Management; Workflow Management; Record Management; OthersContent Management (31.3% share)Others (14.2% CAGR)
By Deployment ModelPublic Cloud; Private Cloud; Hybrid CloudPublic Cloud (59.1% share)Hybrid Cloud (15.4% CAGR)
By End-User IndustryBanking, Financial Services and Insurance (BFSI); Energy and Power; Manufacturing; Retail; Healthcare; Telecom and IT; Government; Education; OthersBanking, Financial Services and Insurance (BFSI) (24.9% share)Healthcare (12.8% CAGR)
By ServiceProfessional; ManagedProfessional (52.5% share)Managed (14.0% CAGR)
By Organization SizeSmall and Medium Enterprises; Large EnterprisesLarge Enterprises (64.2% share)Small and Medium Enterprises (13.9% CAGR)
By RegionNorth America; Europe; Asia-Pacific; South America; Middle East & AfricaNorth America (38.4% share)Asia-Pacific (14.1% CAGR)


Market Segmentation Overview

By Solution

Sub-SegmentKey Trend
Content ManagementRepository of record for policies, SOPs, and contracts
Case ManagementStatutory-deadline tracking in claims and permitting
Workflow ManagementNo-code approval design by business users
Record ManagementRetention scope expanding to chat and social posts
OthersCapture, rich-media and asset-library growth


Content Management leads with a 31.3% share because every regulated function needs a single authoritative copy of its governing documents. Others grow fastest at a 14.2% CAGR as training and marketing teams produce video and high-resolution imagery that demands automated tagging and version control. Workflow Management and Case Management increasingly ship as add-ons to the core repository, raising account value per customer.

By Deployment Model

Sub-SegmentKey Trend
Public CloudElastic search and AI services on multi-tenant SaaS
Private CloudIsolation for defence and life-sciences workloads
Hybrid CloudSensitive records private, general content public


Public Cloud holds a 59.1% share because multi-tenant SaaS delivers the fastest route to AI features and elastic storage. Hybrid Cloud grows fastest at a 15.4% CAGR as GDPR, PIPL and DORA push banks and insurers to keep financial records on private nodes. Private Cloud persists where physical isolation is contractual, but capital cost caps its expansion.

By End-User Industry

Sub-SegmentKey Trend
Banking, Financial Services and Insurance (BFSI)Communications capture and audit-ready retention
Energy and PowerSCADA-linked maintenance and incident records
ManufacturingVersion-controlled supplier and product documents
RetailVendor contracts and campaign content
HealthcareEHR-linked release-of-information workflows
Telecom and ITCentralized network diagrams and SLAs
GovernmentCitizen-service digitization
EducationShared digital-learning repositories
OthersLegal and professional-services matter files


Banking, Financial Services and Insurance (BFSI) leads with a 24.9% share, since Basel III, MiFID II and SEC enforcement make retention failures directly costly. Healthcare grows fastest at a 12.8% CAGR because information-blocking penalties of up to USD 1 million per violation force hospitals to connect EHR platforms with content repositories. Government and Manufacturing follow as steady adopters of domain-specific retention templates.

By Service

Sub-SegmentKey Trend
ProfessionalLegacy migration, metadata mapping and change management
ManagedOutcome-based compliance and run-state operations


Professional services lead with a 52.5% share because decades-old repositories require bespoke mapping and taxonomy redesign before any cloud cutover. Managed services grow faster at a 14.0% CAGR as enterprises outsource patching, legal-hold administration, and policy audits under fixed-fee contracts. Integrators that combine both service types capture the full lifecycle of a customer's platform.

By Organization Size

Sub-SegmentKey Trend
Small and Medium EnterprisesPackaged SaaS with preconfigured retention templates
Large EnterprisesMulti-repository consolidation and AI governance


Large Enterprises hold a 64.2% share, funding consolidation of overlapping repositories and AI readiness across global estates. Small and Medium Enterprises grow faster at a 13.9% CAGR as low-setup SaaS editions let them move straight from shared drives to governed cloud storage. SME growth is strongest in Asia-Pacific and South America, where few firms carry on-premises legacy systems.




Download PDF ×

We do not share your information with anyone. However, we may send you emails based on your report interest from time to time. You may contact us at any time to opt-out.