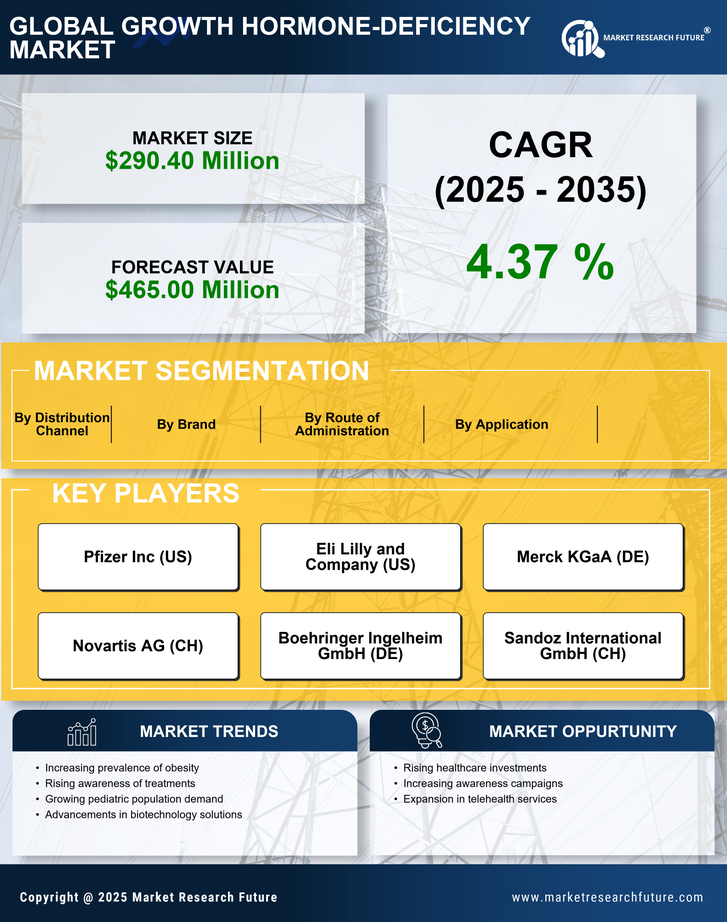
Request Free Sample ×

Kindly complete the form below to receive a free sample of this Report

* Please use a valid business email

Leading companies partner with us for data-driven Insights

clients tt-cursor
Hero Background

China Growth Hormone Deficiency Market

ID: MRFR/HC/48318-HCR
200 Pages
Rahul Gotadki
Last Updated: April 06, 2026

China Growth Hormone Deficiency Market Research Report By Application (Pediatric Growth Hormone Deficiency, Turner Syndrome, Idiopathic Short Stature, Small for Gestational Age, Adult Growth Hormone Deficiency, Prader-Willi Syndrome, Others), By Route of Administration (Subcutaneous, Intravenous, Intramuscular), By Distribution Channel (Hospital Pharmacies, Retail Pharmacies, Online Pharmacies, Specialty Pharmacy) and By Brand (Norditropin, Genotropin, Humatrope, Saizen, Omnitrope, others) - Growth & Industry Forecast 2025 To 2035

Share:
Download PDF ×

We do not share your information with anyone. However, we may send you emails based on your report interest from time to time. You may contact us at any time to opt-out.

China Growth Hormone Deficiency Market Infographic
Purchase Options
  1. 1 SECTION I: EXECUTIVE SUMMARY AND KEY HIGHLIGHTS
    1. 1.1 EXECUTIVE SUMMARY
      1. 1.1.1 Market Overview
      2. 1.1.2 Key Findings
      3. 1.1.3 Market Segmentation
      4. 1.1.4 Competitive Landscape
      5. 1.1.5 Challenges and Opportunities
      6. 1.1.6 Future Outlook
  2. 2 SECTION II: SCOPING, METHODOLOGY AND MARKET STRUCTURE
    1. 2.1 MARKET INTRODUCTION
      1. 2.1.1 Definition
      2. 2.1.2 Scope of the study
        1. 2.1.2.1 Research Objective
        2. 2.1.2.2 Assumption
        3. 2.1.2.3 Limitations
    2. 2.2 RESEARCH METHODOLOGY
      1. 2.2.1 Overview
      2. 2.2.2 Data Mining
      3. 2.2.3 Secondary Research
      4. 2.2.4 Primary Research
        1. 2.2.4.1 Primary Interviews and Information Gathering Process
        2. 2.2.4.2 Breakdown of Primary Respondents
      5. 2.2.5 Forecasting Model
      6. 2.2.6 Market Size Estimation
        1. 2.2.6.1 Bottom-Up Approach
        2. 2.2.6.2 Top-Down Approach
      7. 2.2.7 Data Triangulation
      8. 2.2.8 Validation
  3. 3 SECTION III: QUALITATIVE ANALYSIS
    1. 3.1 MARKET DYNAMICS
      1. 3.1.1 Overview
      2. 3.1.2 Drivers
      3. 3.1.3 Restraints
      4. 3.1.4 Opportunities
    2. 3.2 MARKET FACTOR ANALYSIS
      1. 3.2.1 Value chain Analysis
      2. 3.2.2 Porter's Five Forces Analysis
        1. 3.2.2.1 Bargaining Power of Suppliers
        2. 3.2.2.2 Bargaining Power of Buyers
        3. 3.2.2.3 Threat of New Entrants
        4. 3.2.2.4 Threat of Substitutes
        5. 3.2.2.5 Intensity of Rivalry
      3. 3.2.3 COVID-19 Impact Analysis
        1. 3.2.3.1 Market Impact Analysis
        2. 3.2.3.2 Regional Impact
        3. 3.2.3.3 Opportunity and Threat Analysis
  4. 4 SECTION IV: QUANTITATIVE ANALYSIS
    1. 4.1 Pharmaceutical, BY Brand (USD Million)
      1. 4.1.1 Norditropin
      2. 4.1.2 Genotropin
      3. 4.1.3 Humatrope
      4. 4.1.4 Saizen
      5. 4.1.5 Omnitrope
      6. 4.1.6 Others
    2. 4.2 Pharmaceutical, BY Application (USD Million)
      1. 4.2.1 Paediatric Growth Hormone Deficiency
      2. 4.2.2 Idiopathic Short Stature
      3. 4.2.3 Small for Gestational Age
      4. 4.2.4 Turner Syndrome
      5. 4.2.5 Adult Growth Hormone Deficiency
      6. 4.2.6 Prader-Willi Syndrome
      7. 4.2.7 Others
    3. 4.3 Pharmaceutical, BY Route of Administration (USD Million)
      1. 4.3.1 Subcutaneous
      2. 4.3.2 Intramuscular
      3. 4.3.3 Intravenous
    4. 4.4 Pharmaceutical, BY Distribution Channel (USD Million)
      1. 4.4.1 Hospital Pharmacies
      2. 4.4.2 Retail Pharmacies
      3. 4.4.3 Clinics
      4. 4.4.4 E-Commerce Websites
  5. 5 SECTION V: COMPETITIVE ANALYSIS
    1. 5.1 Competitive Landscape
      1. 5.1.1 Overview
      2. 5.1.2 Competitive Analysis
      3. 5.1.3 Market share Analysis
      4. 5.1.4 Major Growth Strategy in the Pharmaceutical
      5. 5.1.5 Competitive Benchmarking
      6. 5.1.6 Leading Players in Terms of Number of Developments in the Pharmaceutical
      7. 5.1.7 Key developments and growth strategies
        1. 5.1.7.1 New Product Launch/Service Deployment
        2. 5.1.7.2 Merger & Acquisitions
        3. 5.1.7.3 Joint Ventures
      8. 5.1.8 Major Players Financial Matrix
        1. 5.1.8.1 Sales and Operating Income
        2. 5.1.8.2 Major Players R&D Expenditure. 2023
    2. 5.2 Company Profiles
      1. 5.2.1 Pfizer Inc (US)
        1. 5.2.1.1 Financial Overview
        2. 5.2.1.2 Products Offered
        3. 5.2.1.3 Key Developments
        4. 5.2.1.4 SWOT Analysis
        5. 5.2.1.5 Key Strategies
      2. 5.2.2 Eli Lilly and Company (US)
        1. 5.2.2.1 Financial Overview
        2. 5.2.2.2 Products Offered
        3. 5.2.2.3 Key Developments
        4. 5.2.2.4 SWOT Analysis
        5. 5.2.2.5 Key Strategies
      3. 5.2.3 Merck KGaA (DE)
        1. 5.2.3.1 Financial Overview
        2. 5.2.3.2 Products Offered
        3. 5.2.3.3 Key Developments
        4. 5.2.3.4 SWOT Analysis
        5. 5.2.3.5 Key Strategies
      4. 5.2.4 Novartis AG (CH)
        1. 5.2.4.1 Financial Overview
        2. 5.2.4.2 Products Offered
        3. 5.2.4.3 Key Developments
        4. 5.2.4.4 SWOT Analysis
        5. 5.2.4.5 Key Strategies
      5. 5.2.5 Boehringer Ingelheim GmbH (DE)
        1. 5.2.5.1 Financial Overview
        2. 5.2.5.2 Products Offered
        3. 5.2.5.3 Key Developments
        4. 5.2.5.4 SWOT Analysis
        5. 5.2.5.5 Key Strategies
      6. 5.2.6 Sandoz International GmbH (CH)
        1. 5.2.6.1 Financial Overview
        2. 5.2.6.2 Products Offered
        3. 5.2.6.3 Key Developments
        4. 5.2.6.4 SWOT Analysis
        5. 5.2.6.5 Key Strategies
      7. 5.2.7 Horizon Therapeutics plc (IE)
        1. 5.2.7.1 Financial Overview
        2. 5.2.7.2 Products Offered
        3. 5.2.7.3 Key Developments
        4. 5.2.7.4 SWOT Analysis
        5. 5.2.7.5 Key Strategies
      8. 5.2.8 Ipsen S.A. (FR)
        1. 5.2.8.1 Financial Overview
        2. 5.2.8.2 Products Offered
        3. 5.2.8.3 Key Developments
        4. 5.2.8.4 SWOT Analysis
        5. 5.2.8.5 Key Strategies
      9. 5.2.9 Ferring Pharmaceuticals (CH)
        1. 5.2.9.1 Financial Overview
        2. 5.2.9.2 Products Offered
        3. 5.2.9.3 Key Developments
        4. 5.2.9.4 SWOT Analysis
        5. 5.2.9.5 Key Strategies
    3. 5.3 Appendix
      1. 5.3.1 References
      2. 5.3.2 Related Reports
  6. 6 LIST OF FIGURES
    1. 6.1 MARKET SYNOPSIS
    2. 6.2 CHINA MARKET ANALYSIS BY BRAND
    3. 6.3 CHINA MARKET ANALYSIS BY APPLICATION
    4. 6.4 CHINA MARKET ANALYSIS BY ROUTE OF ADMINISTRATION
    5. 6.5 CHINA MARKET ANALYSIS BY DISTRIBUTION CHANNEL
    6. 6.6 KEY BUYING CRITERIA OF PHARMACEUTICAL
    7. 6.7 RESEARCH PROCESS OF MRFR
    8. 6.8 DRO ANALYSIS OF PHARMACEUTICAL
    9. 6.9 DRIVERS IMPACT ANALYSIS: PHARMACEUTICAL
    10. 6.10 RESTRAINTS IMPACT ANALYSIS: PHARMACEUTICAL
    11. 6.11 SUPPLY / VALUE CHAIN: PHARMACEUTICAL
    12. 6.12 PHARMACEUTICAL, BY BRAND, 2024 (% SHARE)
    13. 6.13 PHARMACEUTICAL, BY BRAND, 2024 TO 2035 (USD Million)
    14. 6.14 PHARMACEUTICAL, BY APPLICATION, 2024 (% SHARE)
    15. 6.15 PHARMACEUTICAL, BY APPLICATION, 2024 TO 2035 (USD Million)
    16. 6.16 PHARMACEUTICAL, BY ROUTE OF ADMINISTRATION, 2024 (% SHARE)
    17. 6.17 PHARMACEUTICAL, BY ROUTE OF ADMINISTRATION, 2024 TO 2035 (USD Million)
    18. 6.18 PHARMACEUTICAL, BY DISTRIBUTION CHANNEL, 2024 (% SHARE)
    19. 6.19 PHARMACEUTICAL, BY DISTRIBUTION CHANNEL, 2024 TO 2035 (USD Million)
    20. 6.20 BENCHMARKING OF MAJOR COMPETITORS
  7. 7 LIST OF TABLES
    1. 7.1 LIST OF ASSUMPTIONS
  8. 7.1.1
    1. 7.2 China MARKET SIZE ESTIMATES; FORECAST
      1. 7.2.1 BY BRAND, 2025-2035 (USD Million)
      2. 7.2.2 BY APPLICATION, 2025-2035 (USD Million)
      3. 7.2.3 BY ROUTE OF ADMINISTRATION, 2025-2035 (USD Million)
      4. 7.2.4 BY DISTRIBUTION CHANNEL, 2025-2035 (USD Million)
    2. 7.3 PRODUCT LAUNCH/PRODUCT DEVELOPMENT/APPROVAL
  9. 7.3.1
    1. 7.4 ACQUISITION/PARTNERSHIP
  10. 7.4.1

China Pharmaceutical Market Segmentation

Pharmaceutical By Brand (USD Million, 2025-2035)

  • Norditropin
  • Genotropin
  • Humatrope
  • Saizen
  • Omnitrope
  • Others

Pharmaceutical By Application (USD Million, 2025-2035)

  • Paediatric Growth Hormone Deficiency
  • Idiopathic Short Stature
  • Small for Gestational Age
  • Turner Syndrome
  • Adult Growth Hormone Deficiency
  • Prader-Willi Syndrome
  • Others

Pharmaceutical By Route of Administration (USD Million, 2025-2035)

  • Subcutaneous
  • Intramuscular
  • Intravenous

Pharmaceutical By Distribution Channel (USD Million, 2025-2035)

  • Hospital Pharmacies
  • Retail Pharmacies
  • Clinics
  • E-Commerce Websites

Compare Licence

×
Features License Type
Single User Multiuser License Enterprise User
Price $4,950 $5,950 $7,250
Maximum User Access Limit 1 User Upto 10 Users Unrestricted Access Throughout the Organization
Free Customization
Direct Access to Analyst
Deliverable Format
Platform Access
Discount on Next Purchase 10% 15% 15%
Printable Versions