China Information and Communications Technology Market Segmentation
Information and Communications Technology By Type (USD Million, 2025-2035)
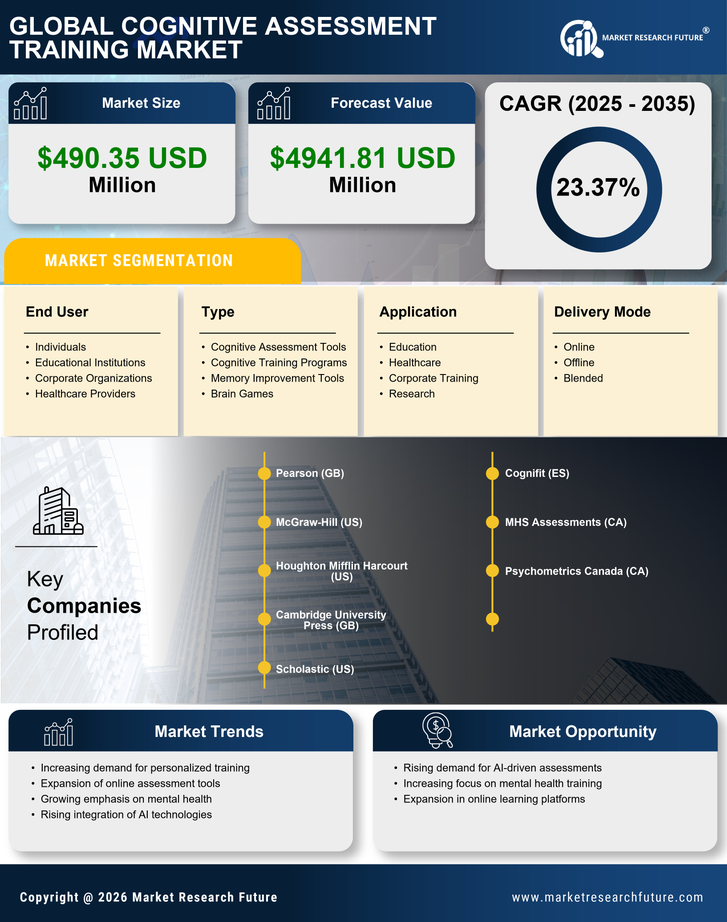
- Cognitive Assessment Tools
- Cognitive Training Programs
- Memory Improvement Tools
- Brain Games
Information and Communications Technology By Application (USD Million, 2025-2035)
- Education
- Healthcare
- Corporate Training
- Research
Information and Communications Technology By End User (USD Million, 2025-2035)
- Individuals
- Educational Institutions
- Corporate Organizations
- Healthcare Providers
Information and Communications Technology By Delivery Mode (USD Million, 2025-2035)
- Online
- Offline
- Blended