ID: MRFR/CnM/1393-HCR | February 2021 | Region: Global | 110 pages
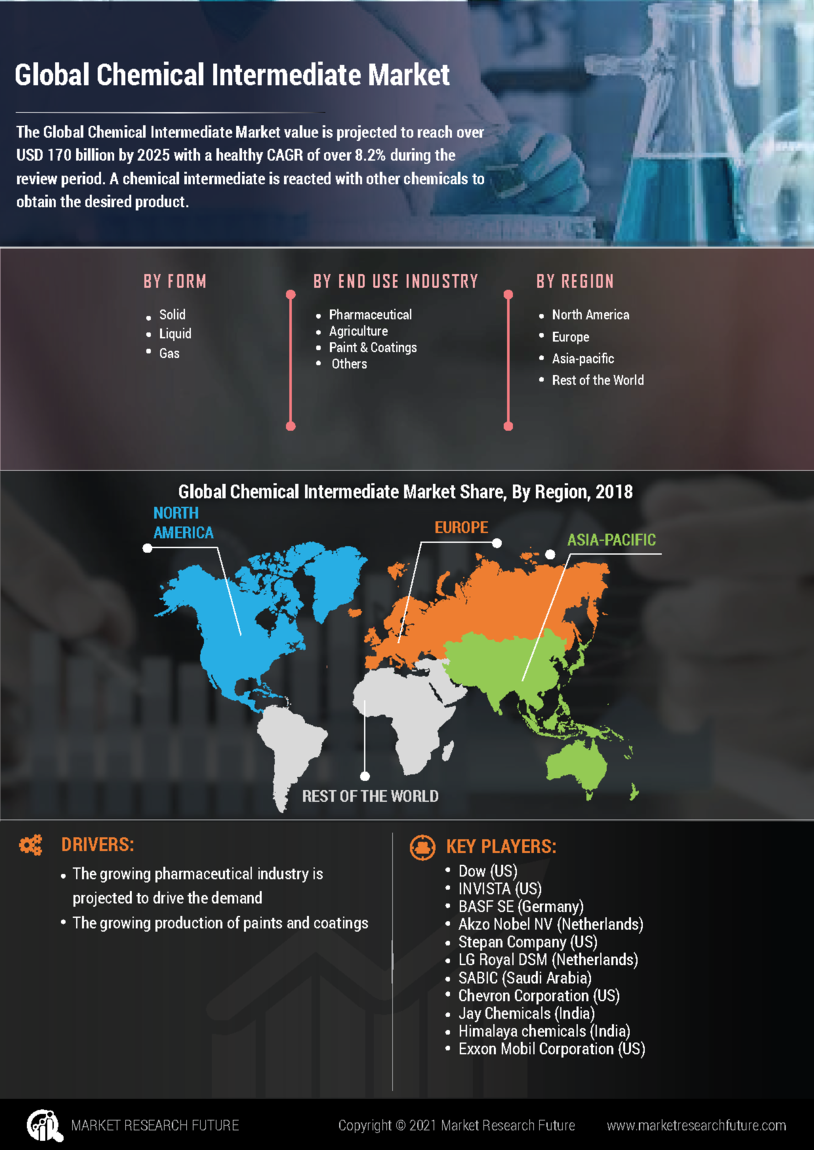
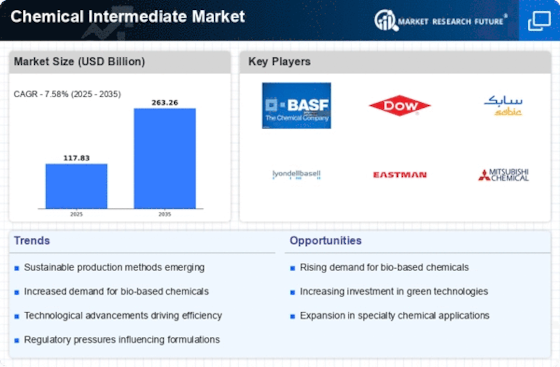
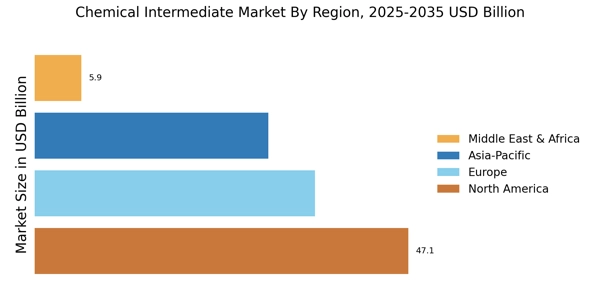
Market overview: According to MRFR analysis, the global chemical intermediate market value is projected to reach over USD 170 billion by 2025 with a healthy CAGR of over 8.2% during the review period. A chemical intermediate is reacted with other chemicals to obtain the desired product. The chemical industry has been focusing on the production of chemical intermediate owing to its wide application in various end-use industries such as agriculture, pharmaceuticals, and paint & coatings. For instance, January 2018 Jubilant Life Sciences invest USD 3.63 billion for setting up pesticides and pesticides intermediate product plant in Gujarat, India. Chemical intermediate is used for producing agriculture chemicals such as pesticides and fertilizer. The primary occupation of any country is agriculture, and the increasing adoption of sustainable farming is driving market growth. With the growing population, the subsequent demand for food will increase rapidly in the coming years. To meet this increasing demand, efficient crop production with better quality is necessary. Such factors are expected to drive the demand for agrochemical products, thus positively influencing the consumption of the chemical intermediate market. Chemical intermediate finds significant application in the pharmaceutical industry, increasing usage of chemical intermediate in the manufacturing of drugs is propelling market demand. Growth of the pharmaceuticals industry is driven by the medical progress owing to the increasing disease prevalence, drug affordability, consumer awareness, and supportive government policies. With the advancements in science and technology, the research in the pharmaceutical industry is entering a new era in medicines development, resulting in decreased mortality. For instance, controlling high blood pressure and cardiovascular disease with antihypertensive and cholesterol-lowering medicines, and controlling of cancers through the targeted therapy are some of the recent developments in medical science responsible for reduced mortality. The advances in medical science are expected to drive the pharmaceutical industry positively impacting the global chemical intermediate market. According to the European Federation of Pharmaceutical Industries & Association (EFPIA), in 2016, North America accounted for 49% of world pharmaceutical sales, whereas Europe accounted for 21.5%. Increasing per capita income coupled with consumer awareness in emerging economies of such as India, Thailand, Indonesia, and Malaysia in Asia-Pacific; and Brazil and Mexico in Latin America have led to a shift in R&D from developed regions to these regions. Indian Brand Equity Foundation, the country’s pharmaceutical industry is expected to grow at a CAGR of 22.4% during 2015–2020 to reach USB 55 billion. Moreover, India’s pharmaceutical exports stood at USD 17.27 billion in 2017 and are likely to drive the market during the forecast period. In 2015, Japan invested USD 121.08 million in its R&D for development of new medicines and drugs. Therefore, the growing pharmaceutical industry is projected to drive the demand for the chemical intermediate market. Global Chemical Intermediate Market Share, by Form, 2018 (%) Source: MRFR analysis Regional analysis: The global market for chemical intermediate has been segmented into five key regions, namely, Asia-Pacific, North America, Middle East & Africa, Europe, and Latin America. In Asia-Pacific, the chemical intermediate market is witnessing steady growth owing to high demand from end-use industries such as paint & coatings, paint & coatings, agriculture, and pharmaceutical. Increasing investment in the construction industry has propelled paint & coatings demand thus influencing the consumption of chemical intermediate. In Europe, high government spending on pharmaceutical sector owing to rise in aging population is expected to drive the demand for chemical intermediate in the region. The Middle East & Africa and Latin America are growing with healthy CAGR due to the presence of a large number of oil & gas producing companies. The strong petrochemical industry is estimated to drive the demand for chemical intermediate during the review period. Segmentation analysis: The global chemical intermediate market has been divided based on form, end-use industry, and region. Based on form, the global chemical intermediate market has been classified as solid, liquid, and gas. On the basis of end-use industry, the global chemical intermediate market has been segmented into pharmaceutical, agriculture, paint & coatings, and others. The global chemical intermediate market, by region, has been studied across five major regions, namely, Asia-Pacific, North America, the Middle East & Africa, Europe, and Latin America. Key players: The key players operating in the global chemical intermediate market are Dow (US), INVISTA (US), BASF SE (Germany), Akzo Nobel NV (Netherlands), Stepan Company (US), LG Royal DSM (Netherlands), SABIC (Saudi Arabia), Chevron Corporation (US), Jay Chemicals (India), Himalaya chemicals (India) and Exxon Mobil Corporation (US). Target Audience:
Report Attribute/Metric | Details |
---|---|
Market Size | USD 170 Billion |
CAGR | 8.2% (2018-2025) |
Base Year | 2019 |
Forecast Period | 2020-2027 |
Historical Data | 2018 |
Forecast Units | Value (USD Billion) |
Report Coverage | Revenue Forecast, Competitive Landscape, Growth Factors, and Trends |
Segments Covered | Form, End-Use and Region |
Geographies Covered | North America, Europe, Asia-Pacific, and Rest of the World (RoW) |
Key Vendors | Dow (US), INVISTA (US), BASF SE (Germany), Akzo Nobel NV (Netherlands), Stepan Company (US), LG Royal DSM (Netherlands), SABIC (Saudi Arabia), Chevron Corporation (US), Jay Chemicals (India), Himalaya chemicals (India) and Exxon Mobil Corporation (US). |
Key Market Opportunities | Increasing usage of chemical intermediate in the manufacturing of drugs is propelling market demand |
Key Market Drivers | Increasing adoption of sustainable farming |
Frequently Asked Questions (FAQ) :
The global chemical intermediate market is expected to rise to a valuation of more than USD 170 billion by 2025.
The global chemical intermediates market is expected to exhibit a strong 8.2% CAGR over the forecast period from 2019 to 2025.
The liquid segment dominates the global chemical intermediate market, with a share of close to 50% in 2018.
The growing production of paints and coatings and pharmaceutical products is likely to be the major driver for the global chemical intermediate market over the forecast period.
Leading players in the chemical intermediate market include Dow, BASF SE, Akzo Nobel, Stepan Company, SABIC, Jay Chemicals, Chevron Corporation, Himalaya Chemicals, and ExxonMobil.
TABLE OF CONTENTS
1 Executive Summary
2 Scope of the Report
2.1 Market Definition
2.2 Scope of the Study
2.2.1 Research Objectives
2.2.2 Assumptions & Limitations
2.3 Markets Structure
3 Market Research Methodology
3.1 Research Process
3.2 Primary Research
3.3 Secondary Research
3.4 Forecast Model
4 Market Landscape
4.1 Supply Chain Analysis
4.1.1 Raw Material Suppliers
4.1.2 Manufacturers/Producers
4.1.3 Distributors/Retailers/Wholesalers/E-Commerce Merchants
4.1.4 End-Use Industry
4.2 Porter’s Five Forces Analysis
4.2.1 Threat of New Entrants
4.2.2 Bargaining Power of Buyers
4.2.3 Bargaining Power of Suppliers
4.2.4 Threat of Substitutes
4.2.5 Intensity of Competitive Rivalry
5 Industry Overview of the Global Chemical Intermediate Market
5.1 Introduction
5.2 Drivers
5.3 Restraints
5.4 Opportunities
5.5 Challenges
6 Market Trends
6.1 Introduction
6.2 Growth Trends
6.3 Impact Analysis
7. Global Chemical Intermediate Market, by Form
7.1 Introduction
7.2 Solid
7.2.1. Market Estimates & Forecast, 2020–2027
7.2.2. Market Estimates & Forecast, by Region, 2020–2027
7.3 Liquid
7.3.1 Market Estimates & Forecast, 2020–2027
7.3.2 Market Estimates & Forecast, by Region, 2020–2027
7.4 Gas
7.4.1 Market Estimates & Forecast, 2020–2027
7.4.2 Market Estimates & Forecast, by Region, 2020–2027
8. Global Chemical Intermediate Market, by End Use Industry
8.1 Introduction
8.2 Pharmaceutical
8.2.1 Market Estimates & Forecast, 2020–2027
8.2.2 Market Estimates & Forecast, by Region, 2020–2027
8.3 Agriculture
8.3.1 Market Estimates & Forecast, 2020–2027
8.3.2 Market Estimates & Forecast, by Region, 2020–2027
8.4 Paint & Coatings
8.4.1 Market Estimates & Forecast, 2020–2027
8.4.2 Market Estimates & Forecast, by Region, 2020–2027
8.5 Cosmetics & Personal Care
8.5.1 Market Estimates & Forecast, 2020–2027
8.5.2 Market Estimates & Forecast, by Region, 2020–2027
8.6 Paint & Coatings
8.6.1 Market Estimates & Forecast, 2020–2027
8.6.2 Market Estimates & Forecast, by Region, 2020–2027
8.7 Others
8.7.1 Market Estimates & Forecast, 2020–2027
8.7.2 Market Estimates & Forecast, by Region, 2020–2027
9. Global Chemical Intermediate Market, by Region
9.1 Introduction
9.2 North America
9.2.1 Market Estimates & Forecast, 2020–2027
9.2.2 Market Estimates & Forecast by Form , 2020–2027
9.2.5 Market Estimates & Forecast by End Use Industry, 2020–2027
9.2.6 US
9.2.6.1 Market Estimates & Forecast, 2020–2027
9.2.6.2 Market Estimates & Forecast by Form , 2020–2027
9.2.6.5 Market Estimates & Forecast by End Use Industry, 2020–2027
9.2.7 Canada
9.2.7.1 Market Estimates & Forecast, 2020–2027
9.2.7.2 Market Estimates & Forecast by Form , 2020–2027
9.2.7.5 Market Estimates & Forecast by End Use Industry, 2020–2027
9.3 Europe
9.3.1 Market Estimates & Forecast, 2020–2027
9.3.2 Market Estimates & Forecast by Form , 2020–2027
9.3.5 Market Estimates & Forecast by End Use Industry, 2020–2027
9.3.6 Germany
9.3.6.1 Market Estimates & Forecast, 2020–2027
9.3.6.2 Market Estimates & Forecast by Form , 2020–2027
9.3.6.5 Market Estimates & Forecast by End Use Industry, 2020–2027
9.3.7. France
9.3.7.1 Market Estimates & Forecast, 2020–2027
9.3.7.2 Market Estimates & Forecast by Form , 2020–2027
9.3.7.5 Market Estimates & Forecast by End Use Industry, 2020–2027
9.3.8 Italy
9.3.8.1 Market Estimates & Forecast, 2020–2027
9.3.8.2 Market Estimates & Forecast by Form , 2020–2027
9.3.8.5 Market Estimates & Forecast by End Use Industry, 2020–2027
9.3.9 Spain
9.3.9.1 Market Estimates & Forecast, 2020–2027
9.3.9.2 Market Estimates & Forecast by Form , 2020–2027
9.3.9.5 Market Estimates & Forecast by End Use Industry, 2020–2027
9.3.10 UK
9.3.10.1 Market Estimates & Forecast, 2020–2027
9.3.10.2 Market Estimates & Forecast by Form , 2020–2027
9.3.10.5 Market Estimates & Forecast by End Use Industry, 2020–2027
9.3.11 Russia
9.3.11.1 Market Estimates & Forecast, 2020–2027
9.3.11.2 Market Estimates & Forecast by Form , 2020–2027
9.3.11.5 Market Estimates & Forecast by End Use Industry, 2020–2027
9.3.12 Netherlands
9.3.12.1 Market Estimates & Forecast, 2020–2027
9.3.12.2 Market Estimates & Forecast by Form , 2020–2027
9.3.12.3 Market Estimates & Forecast by End Use Industry, 2020–2027
9.3.13 Rest of Europe
9.3.13.1 Market Estimates & Forecast, 2020–2027
9.3.13.2 Market Estimates & Forecast by Form , 2020–2027
9.3.13.5 Market Estimates & Forecast by End Use Industry, 2020–2027
9.4 Asia-Pacific
9.4.1 Market Estimates & Forecast, 2020–2027
9.4.2 Market Estimates & Forecast by Form , 2020–2027
9.4.5 Market Estimates & Forecast by End Use Industry, 2020–2027
9.4.6 China
9.4.6.1 Market Estimates & Forecast, 2020–2027
9.4.6.2 Market Estimates & Forecast by Form , 2020–2027
9.4.6.5 Market Estimates & Forecast by End Use Industry, 2020–2027
9.4.7 India
9.4.7.1 Market Estimates & Forecast, 2020–2027
9.4.7.2 Market Estimates & Forecast by Form , 2020–2027
9.4.7.5 Market Estimates & Forecast by End Use Industry, 2020–2027
9.4.8 Japan
9.4.8.1 Market Estimates & Forecast, 2020–2027
9.4.8.2 Market Estimates & Forecast by Form , 2020–2027
9.4.8.5 Market Estimates & Forecast by End Use Industry, 2020–2027
9.4.9 Australia
9.4.9.1 Market Estimates & Forecast, 2020–2027
9.4.9.2 Market Estimates & Forecast by Form , 2020–2027
9.4.9.5 Market Estimates & Forecast by End Use Industry, 2020–2027
9.4.10 Malaysia
9.4.10.1 Market Estimates & Forecast, 2020–2027
9.4.10.2 Market Estimates & Forecast by Form , 2020–2027
9.4.10.5Market Estimates & Forecast by End Use Industry, 2020–2027
9.4.11 South Korea
9.4.11.1 Market Estimates & Forecast, 2020–2027
9.4.11.2 Market Estimates & Forecast by Form , 2020–2027
9.4.11.5 Market Estimates & Forecast by End Use Industry, 2020–2027
9.4.12 Rest of Asia-Pacific
9.4.12.1 Market Estimates & Forecast, 2020–2027
9.4.12.2 Market Estimates & Forecast by Form , 2020–2027
9.4.12.5Market Estimates & Forecast by End Use Industry, 2020–2027
9.5 Middle East & Africa
9.5.1 Market Estimates & Forecast, 2020–2027
9.5.2 Market Estimates & Forecast by Form , 2020–2027
9.5.5 Market Estimates & Forecast by End Use Industry, 2020–2027
9.5.6 Saudi Arabia
9.5.6.1 Market Estimates & Forecast, 2020–2027
9.5.6.2 Market Estimates & Forecast by Form , 2020–2027
9.5.6.5 Market Estimates & Forecast by End Use Industry, 2020–2027
9.5.7 UAE
9.5.7.1 Market Estimates & Forecast, 2020–2027
9.5.7.2 Market Estimates & Forecast by Form , 2020–2027
9.5.7.5 Market Estimates & Forecast by End Use Industry, 2020–2027
9.5.8 Africa
9.5.8.1 Market Estimates & Forecast, 2020–2027
9.5.8.2 Market Estimates & Forecast by Form , 2020–2027
9.5.8.5Market Estimates & Forecast by End Use Industry, 2020–2027
9.5.9 Rest of the Middle East & Africa
9.5.9.1 Market Estimates & Forecast, 2020–2027
9.5.9.2 Market Estimates & Forecast by Form , 2020–2027
9.5.9.5 Market Estimates & Forecast by End Use Industry, 2020–2027
9.6 Latin America
9.6.1 Market Estimates & Forecast, 2020–2027
9.6.2 Market Estimates & Forecast by Form , 2020–2027
9.6.5 Market Estimates & Forecast by End Use Industry, 2020–2027
9.6.4 Brazil
9.6.4.1 Market Estimates & Forecast, 2020–2027
9.6.4.2 Market Estimates & Forecast by Form , 2020–2027
9.6.4.5 Market Estimates & Forecast by End Use Industry, 2020–2027
9.6.5 Argentina
9.6.5.1 Market Estimates & Forecast, 2020–2027
9.6.5.2 Market Estimates & Forecast by Form , 2020–2027
9.6.5.5 Market Estimates & Forecast by End Use Industry, 2020–2027
9.6.6 Mexico
9.6.6.1 Market Estimates & Forecast, 2020–2027
9.6.6.2 Market Estimates & Forecast by Form , 2020–2027
9.6.6.5 Market Estimates & Forecast by End Use Industry, 2020–2027
9.6.7 Rest of Latin America
9.6.7.1 Market Estimates & Forecast, 2020–2027
9.6.7.2 Market Estimates & Forecast by Form , 2020–2027
9.6.7.5 Market Estimates & Forecast by End Use Industry, 2020–2027
10. Competitive Landscape
10.1 Introduction
10.2 Market Key Strategies
10.3 Key Development Analysis
(Expansions/Mergers & Acquisitions/Joint Ventures/Agreements/Investments)
11. Company Profiles
11.1 Dow
11.1.1 Company Overview
11.1.2 Financial Updates
11.1.3 Form /Business Segment Overview
11.1.4 Key Developments
11.1.5 SWOT Analysis
11.1.6 Key Strategies
11.2 Exxon Mobil Corporation
11.2.1 Company Overview
11.2.2 Financial Updates
11.2.3 Form /Business Segment Overview
11.2.4 Key Developments
11.2.5 SWOT Analysis
11.2.6 Key Strategies
11.3 INVISTA
11.3.1 Company Overview
11.3.2 Financial Updates
11.3.3 Form /Business Segment Overview
11.3.4 Key Developments
11.3.5 SWOT Analysis
11.3.6 Key Strategies
11.4 BASF SE
11.4.1 Company Overview
11.4.2 Financial Updates
11.4.3 Form /Business Segment Overview
11.4.4 Key Developments
11.4.5 SWOT Analysis
11.4.6 Key Strategies
11.5 Akzo Nobel NV
11.5.1 Company Overview
11.5.2 Financial Updates
11.5.3 Form /Business Segment Overview
11.5.4 Key Developments
11.5.5 SWOT Analysis
11.5.6 Key Strategies
11.6 Stepan Company
11.6.1 Company Overview
11.6.2 Financial Updates
11.6.3 Form /Business Segment Overview
11.6.4 Key Developments
11.6.5 SWOT Analysis
11.6.6 Key Strategies
11.7 LG Royal DSM
11.7.1 Company Overview
11.7.2 Financial Updates
11.7.3 Form /Business Segment Overview
11.7.4 Key Developments
11.7.5 SWOT Analysis
11.7.6 Key Strategies
11.8 SABIC
11.8.1 Company Overview
11.8.2 Financial Updates
11.8.3 Form /Business Segment Overview
11.8.4 Key Developments
11.8.5 SWOT Analysis
11.8.6 Key Strategies
11.9 Chevron Corporation
11.9.1 Company Overview
11.9.2 Financial Updates
11.9.3 Form /Business Segment Overview
11.9.4 Key Developments
11.9.5 SWOT Analysis
11.9.6 Key Strategies
11.10 Jay Chemicals
11.10.1 Company Overview
11.10.2 Financial Updates
11.10.3 Form /Business Segment Overview
11.10.4 Key Developments
11.10.5 SWOT Analysis
11.10.6 Key Strategies
11.11 Himalaya Chemicals
11.11.1 Company Overview
11.11.2 Financial Updates
11.11.3 Form /Business Segment Overview
11.11.4 Key Developments
11.11.5 SWOT Analysis
11.11.6 Key Strategies
12. Conclusion
LIST OF TABLES
Table 1 Global Chemical Intermediate Market, by Region, 2020–2027
Table 2 North America: Chemical Intermediate Market, by Country, 2020–2027
Table 3 Europe: Chemical Intermediate Market, by Country, 2020–2027
Table 4 Asia-Pacific: Chemical Intermediate Market, by Country, 2020–2027
Table 5 Middle East & Africa: Chemical Intermediate Market, by Country, 2020–2027
Table 6 Latin America: Chemical Intermediate Market, by Country, 2020–2027
Table 7 Chemical Intermediate Form Market, by Region, 2020–2027
Table 8 North America: Chemical Intermediate Form Market, by Country, 2020–2027
Table 9 Europe: Chemical Intermediate Form Market, by Country, 2020–2027
Table 10 Asia-Pacific: Chemical Intermediate Form Market, by Country, 2020–2027
Table 11 Middle East & Africa: Chemical Intermediate Form Market, by Country, 2020–2027
Table 12 Latin America: Chemical Intermediate Form Market, by Country, 2020–2027
Table 11 Chemical Intermediate End Use Industry Market, by Region, 2020–2027
Table 14 North America: Chemical Intermediate End Use Industry Market, by Country, 2020–2027
Table 15 Europe: Chemical Intermediate End Use Industry Market, by Country, 2020–2027
Table 16 Asia-Pacific: Chemical Intermediate End Use Industry Market, by Country, 2020–2027
Table 17 Middle East & Africa: Chemical Intermediate End Use Industry Market, by Country, 2020–2027
Table 18 Latin America: Chemical Intermediate End Use Industry Market, by Country, 2020–2027
Table 19 Global Chemical Intermediate Form Market, by Region, 2020–2027
Table 20 Global Chemical Intermediate End Use Industry Market, by Region, 2020–2027
Table 21 North America: Chemical Intermediate Market, by Country, 2020–2027
Table 22 North America: Chemical Intermediate Market, by Form , 2020–2027
Table 23 North America: Chemical Intermediate Market, by End Use Industry, 2020–2027
Table 24 Europe Chemical Intermediate Market, by Country, 2020–2027
Table 25 Europe Chemical Intermediate Market, by Form , 2020–2027
Table 26 Europe Chemical Intermediate Market, by End Use Industry, 2020–2027
Table 27 Asia-Pacific Chemical Intermediate Market, by Country, 2020–2027
Table 28 Asia-Pacific Chemical Intermediate Market, by Form , 2020–2027
Table 29 Asia-Pacific Chemical Intermediate Market, by End Use Industry, 2020–2027
Table 30 Middle East & Africa: Chemical Intermediate Market, by Country, 2020–2027
Table 31 Middle East & Africa: Chemical Intermediate Market, by Form , 2020–2027
Table 32 Middle East & Africa: Chemical Intermediate Market, by End Use Industry, 2020–2027
Table 33 Latin America: Chemical Intermediate Market, by Country, 2020–2027
Table 34 Latin America: Chemical Intermediate Market, by Form , 2020–2027
Table 35 Latin America: Chemical Intermediate Market, by End Use Industry, 2020–2027
LIST OF FIGURES
FIGURE 1 Chemical Intermediate Market Segmentation
FIGURE 2 Forecast Methodology
FIGURE 3 Porter’s Five Forces Analysis of Chemical Intermediate Market
FIGURE 4 Supply Chain of Chemical Intermediate Market
FIGURE 5 Share of Chemical Intermediate Market, by Country, 2020 (%)
FIGURE 6 Global Chemical Intermediate Market, 2020–2027
FIGURE 7 Sub Segments of Form
FIGURE 9 Chemical Intermediate Market size, by Form, 2020 (%)
FIGURE 10 Share of Chemical Intermediate Market, by Form, 2020–2027
FIGURE 17 Sub Segments of End Use Industry
FIGURE 18 Chemical Intermediate Market size, by End Use Industry, 2020 (%)
FIGURE 19 Share of Chemical Intermediate Market, by End Use Industry, 2020–2027