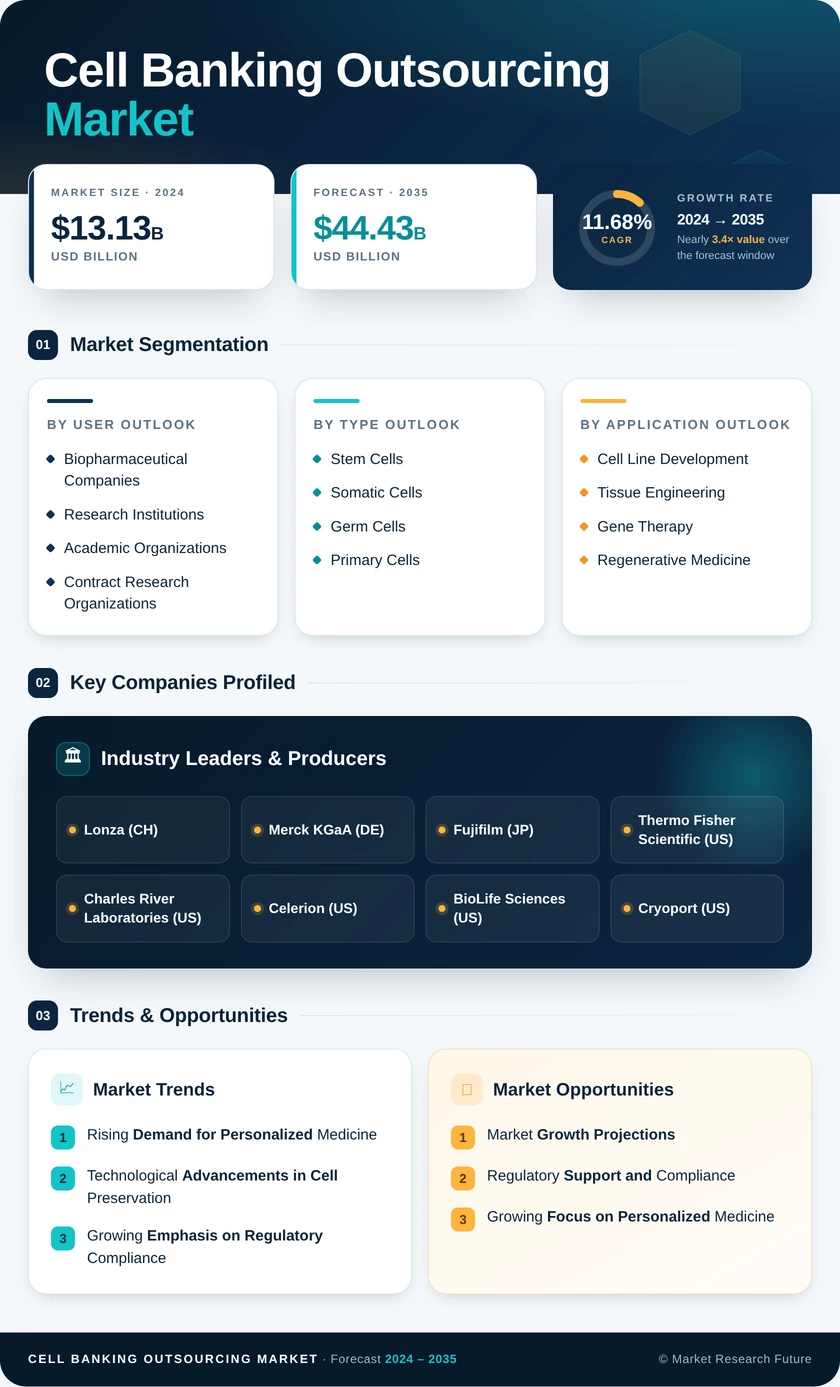
Cell Banking Outsourcing Market (2026 - 2035)

ID: MRFR/LS/7653-HCR 125 Pages Satyendra Maurya Last Updated: October 27, 2026
Cell Banking Outsourcing Market Research Report: Size, Share, Trend Analysis By Cell Type (Stem Cell Banking, Non-Stem Cell Banking), By Applications (Cell Bank Storage, Cell Bank Preparation, Bank Characterization & Testing), and Region (North America, Europe, Asia-Pacific, Rest of the World) - Growth Outlook & Industry Forecast Till 2035
Cell Banking Outsourcing Market
Market Size
Forecast Period2026-2035
CAGR (2026-2035)15.60%
2025 Market SizeUSD 15.72 Billion
2035 Market SizeUSD 67.61 Billion
Key Players
Charles River Laboratories
Lonza Group
Merck KGaA
Thermo Fisher Scientific
WuXi AppTec
SGS SA
Opportunities
  • HLA-Matched iPSC Master Banks for Allogeneic Therapy
  • Emerging-Market Capacity in India and the Gulf
  • Subscription Capacity and Data-Driven Service Models
  1. 1 Market Summary | |
  2. 2 Key Report Takeaways | |
    1. 2.1 By Bank Type | |
    2. 2.2 By Cell Type | |
    3. 2.3 By Outsourced Service | |
    4. 2.4 By End User | |
    5. 2.5 By Region | |
  3. 3 Market Size and Forecast (2021–2035) | |
    1. 3.1 Historical Market Size (2021–2025) | |
    2. 3.2 Forecast Market Size (2026–2035) | |
    3. 3.3 Year-over-Year Growth Analysis | |
  4. 4 Driver Impact Analysis | |
    1. 4.1 Expanding Cell and Gene Therapy Pipelines | |
    2. 4.2 Stricter GMP and Viral Safety Requirements | |
    3. 4.3 Sponsor Preference for Capital-Light Outsourcing | |
    4. 4.4 CDMO Capacity Investment and Consolidation | |
    5. 4.5 Stem-Cell and iPSC Program Growth in Asia-Pacific | |
    6. 4.6 Automation and AI-Enabled Quality Control | |
    7. 4.7 Biosimilar and Monoclonal Antibody Cell Line Demand | |
  5. 5 Restraints Impact Analysis | |
    1. 5.1 High Cost of GMP Banking and Characterization | |
    2. 5.2 Shortage of Skilled GMP and Cryogenic Staff | |
    3. 5.3 Geopolitical and Data-Sovereignty Constraints | |
    4. 5.4 Cryogenic Logistics and Liquid-Nitrogen Supply Risk | |
    5. 5.5 Regulatory Divergence Across Jurisdictions | |
  6. 6 Opportunities | |
    1. 6.1 HLA-Matched iPSC Master Banks for Allogeneic Therapy | |
    2. 6.2 Emerging-Market Capacity in India and the Gulf | |
    3. 6.3 Subscription Capacity and Data-Driven Service Models | |
    4. 6.4 Integrated Banking and Cold-Chain Delivery | |
    5. 6.5 Re-Characterization of Legacy Banks | |
  7. 7 Regional Market Share and Country-Level Analysis | |
    1. 7.1 North America | | |
      1. 7.1.1 US | | |
      2. 7.1.2 Canada | | |
      3. 7.1.3 Mexico | |
    2. 7.2 Europe | | |
      1. 7.2.1 Germany | | |
      2. 7.2.2 UK | | |
      3. 7.2.3 France | | |
      4. 7.2.4 Italy | | |
      5. 7.2.5 Spain | | |
      6. 7.2.6 Nordic Countries | | |
      7. 7.2.7 Russia | | |
      8. 7.2.8 Rest of Europe | |
    3. 7.3 Asia-Pacific | | |
      1. 7.3.1 China | | |
      2. 7.3.2 India | | |
      3. 7.3.3 Japan | | |
      4. 7.3.4 South Korea | | |
      5. 7.3.5 ASEAN | | |
      6. 7.3.6 Rest of Asia-Pacific | |
    4. 7.4 South America | | |
      1. 7.4.1 Brazil | | |
      2. 7.4.2 Argentina | | |
      3. 7.4.3 Rest of South America | |
    5. 7.5 Middle East & Africa | | |
      1. 7.5.1 Saudi Arabia | | |
      2. 7.5.2 UAE | | |
      3. 7.5.3 South Africa | | |
      4. 7.5.4 Egypt | | |
      5. 7.5.5 Rest of MEA | |
  8. 8 Future Outlook (2026–2035) | |
    1. 8.1 AI-Driven Quality Control and Autonomous Cryostorage | |
    2. 8.2 Platform Economics and Recurring Revenue | |
    3. 8.3 The Allogeneic Shift | |
    4. 8.4 Sustainability and Energy Efficiency in Cold Storage | |
  9. 9 Segmentation Analysis | |
    1. 9.1 By Bank Type | | |
      1. 9.1.1 Master Cell Banking | | |
      2. 9.1.2 Working Cell Banking | | |
      3. 9.1.3 Viral Cell Banking | | |
      4. 9.1.4 Others | | |
      5. 9.1.5 Research & Development Cell Bank | | |
      6. 9.1.6 End-of-Production Cell Bank | |
    2. 9.2 By Cell Type | | |
      1. 9.2.1 Stem Cell Banking | | |
      2. 9.2.2 Non-Stem Cell Banking | | |
      3. 9.2.3 Cord Blood & Tissue Stem Cells | | |
      4. 9.2.4 Embryonic Stem Cells | | |
      5. 9.2.5 Adult Stem Cells | | |
      6. 9.2.6 Dental Pulp Stem Cells | | |
      7. 9.2.7 Induced Pluripotent Stem Cells | | |
      8. 9.2.8 Microbial Cell Banking | | |
      9. 9.2.9 Mammalian Cell Banking | | |
      10. 9.2.10 Hybridoma Cell Banking | |
    3. 9.3 By Outsourced Service | | |
      1. 9.3.1 Cell Line Development | | |
      2. 9.3.2 Cell Bank Characterization & Testing | | |
      3. 9.3.3 Cell Bank Storage | | |
      4. 9.3.4 Logistics & Cold-Chain Management | | |
      5. 9.3.5 Others | | |
      6. 9.3.6 GMP Manufacturing & Expansion | |
    4. 9.4 By End User | | |
      1. 9.4.1 Biopharma & Biotech Companies | | |
      2. 9.4.2 Contract Research Organizations (CROs) | | |
      3. 9.4.3 Academic & Research Institutes | | |
      4. 9.4.4 Others | | |
      5. 9.4.5 Hospitals & Transplant Centers | |
  10. 10 Competitive Landscape | |
    1. 10.1 Market Concentration Analysis | |
    2. 10.2 Competitive Benchmarking Table | |
    3. 10.3 Company Profiles | | |
      1. 10.3.1 Charles River Laboratories | | |
      2. 10.3.2 Lonza Group | | |
      3. 10.3.3 Merck KGaA (MilliporeSigma / BioReliance) | | |
      4. 10.3.4 Thermo Fisher Scientific | | |
      5. 10.3.5 WuXi AppTec | | |
      6. 10.3.6 SGS SA | | |
      7. 10.3.7 Eurofins Scientific | | |
      8. 10.3.8 Sartorius (BioOutsource) | | |
      9. 10.3.9 Fujifilm Diosynth Biotechnologies | | |
      10. 10.3.10 Cryoport | | |
      11. 10.3.11 Texcell | |
  11. 11 Recent News & Developments | |
  12. 12 Report Scope and Methodology | |
  13. 13 Detailed Sources and Citations | |
  14. 14 Frequently Asked Questions (FAQs) | | LIST OF TABLES | |
  15. TABLE 1 Report Summary – Key Market Parameters, 2025–2035 | |
  16. TABLE 2 Global Market Size & Forecast, by Revenue (USD Billion), 2021–2035 | |
  17. TABLE 3 Driver Impact Analysis, 2026–2035 | |
  18. TABLE 4 Restraints Impact Analysis, 2026–2035 | |
  19. TABLE 5 Regional Summary, 2025 | |
  20. TABLE 6 North America – Country-Level Analysis, 2025 | |
  21. TABLE 7 Europe – Country-Level Analysis, 2025 | |
  22. TABLE 8 Asia-Pacific – Country-Level Analysis, 2025 | |
  23. TABLE 9 South America – Country-Level Analysis, 2025 | |
  24. TABLE 10 Middle East & Africa – Country-Level Analysis, 2025 | |
  25. TABLE 11 Market Segmentation, by Bank Type, 2025 | |
  26. TABLE 12 Market Segmentation, by Cell Type, 2025 | |
  27. TABLE 13 Market Segmentation, by Outsourced Service, 2025 | |
  28. TABLE 14 Market Segmentation, by End User, 2025 | |
  29. TABLE 15 Competitive Benchmarking Table, 2025 | |
  30. TABLE 16 Report Scope and Methodology | |
  31. TABLE 17 Detailed Sources and Citations | |
  32. TABLE 18 Segmentation Quick Reference | | LIST OF FIGURES | |
  33. FIGURE 1 Market Dynamics Overview – Drivers, Restraints and Opportunities | |
  34. FIGURE 2 Industry Value Chain Analysis | |
  35. FIGURE 3 Porter's Five Forces Analysis | |
  36. FIGURE 4 Global Market Size Trend (USD Billion), 2021–2035 | |
  37. FIGURE 5 Year-over-Year Growth Trend, 2022–2035 | |
  38. FIGURE 6 Market Share, by Bank Type, 2025 | |
  39. FIGURE 7 Market Share, by Cell Type, 2025 | |
  40. FIGURE 8 Market Share, by Outsourced Service, 2025 | |
  41. FIGURE 9 Market Share, by End User, 2025 | |
  42. FIGURE 10 Regional Market Share, 2025 | |
  43. FIGURE 11 Regional Growth Comparison (CAGR), 2026–2035 | |
  44. FIGURE 12 Competitive Landscape – Estimated Revenue Share Ranges, 2025 | |
  45. FIGURE 13 Recent Strategic Developments Timeline, 2023–2025

Segmentation Quick Reference

DimensionSub-SegmentsDominant SegmentFastest Growing Segment
By Bank TypeMaster Cell Banking; Working Cell Banking; Viral Cell Banking; OthersMaster Cell Banking (35.2%)Viral Cell Banking (16.4% CAGR)
By Cell TypeStem Cell Banking (Adult Stem Cells, Embryonic Stem Cells, Induced Pluripotent Stem Cells); Non-Stem Cell BankingStem Cell Banking (56.3%)Induced Pluripotent Stem Cells (17.5% CAGR)
By Outsourced ServiceCell Line Development; Cell Bank Characterization & Testing; Cell Bank Storage; Logistics & Cold-Chain Management; OthersCell Line Development (27.7%)Logistics & Cold-Chain Management (16.3% CAGR)
By End UserBiopharma & Biotech Companies; Contract Research Organizations (CROs); Academic & Research Institutes; OthersBiopharma & Biotech Companies (47.8%)Contract Research Organizations (CROs) (16.0% CAGR)
By RegionNorth America; Europe; Asia-Pacific; South America; Middle East & AfricaNorth America (42.3%)Asia-Pacific (16.3%)


Market Segmentation Overview

By Bank Type

Sub-SegmentKey Trend
Master Cell BankingRe-characterization of legacy banks under updated viral safety guidance
Working Cell BankingRecurring replenishment campaigns tied to commercial supply
Viral Cell BankingGrowth in BSL-2+ suites for CAR-T and oncolytic virus vectors
OthersEnd-of-production banks used for genetic stability confirmation


Master Cell Banking leads because it serves as the regulatory reference for a product's entire lifecycle, and ICH Q5A(R2) has pushed sponsors to update older banks. Viral Cell Banking grows fastest because vector-based therapies need high-titer banks produced under containment that most sponsors lack. Working Cell Banking provides steady volume, since each master bank supports repeated working bank campaigns.

By Cell Type

Sub-SegmentKey Trend
Stem Cell BankingCommercial validation of mesenchymal stromal and hematopoietic therapies
Non-Stem Cell BankingSteady CHO and HEK293 demand from biosimilar and antibody programs


Stem Cell Banking dominates, led by adult stem cells that now have commercial approvals behind them. Within it, Induced Pluripotent Stem Cells grow fastest because one HLA-typed iPSC master bank can supply many allogeneic products, supported by Japan's regenerative medicine pathway. Non-Stem Cell Banking grows more slowly but remains essential for production cell lines in biosimilar pipelines.

By Outsourced Service

Sub-SegmentKey Trend
Cell Line DevelopmentRising number of new candidates requiring stable, high-yield lines
Cell Bank Characterization & TestingAdoption of sequencing-based viral safety methods
Cell Bank StorageSplit-site storage mandates and lifecycle retention
Logistics & Cold-Chain ManagementReal-time telemetry and qualified shipping lanes
OthersRegulatory documentation support for global filings


Cell Line Development holds the largest share because every candidate needs a stable line before any bank can be produced. Logistics & Cold-Chain Management grows fastest, since living therapies cannot tolerate temperature excursions and regulators now review lane qualification data. Characterization and testing also benefit from stricter ICH expectations and the move to molecular assays.

By End User

Sub-SegmentKey Trend
Biopharma & Biotech CompaniesVenture-funded developers avoiding fixed GMP investment
Contract Research Organizations (CROs)Bundling of bank testing into Phase I–III packages
Academic & Research InstitutesInvestigator-led trials moving toward GMP banks
OthersHospitals, cord blood banks and government repositories


Biopharma & Biotech Companies lead because they own therapy pipelines and control outsourcing budgets. Contract Research Organizations grow fastest as sponsors consolidate characterization, stability, and release testing into bundled clinical contracts negotiated with CDMOs. Academic & Research Institutes remain a key early-stage source that feeds future commercial demand.




Download PDF ×

We do not share your information with anyone. However, we may send you emails based on your report interest from time to time. You may contact us at any time to opt-out.