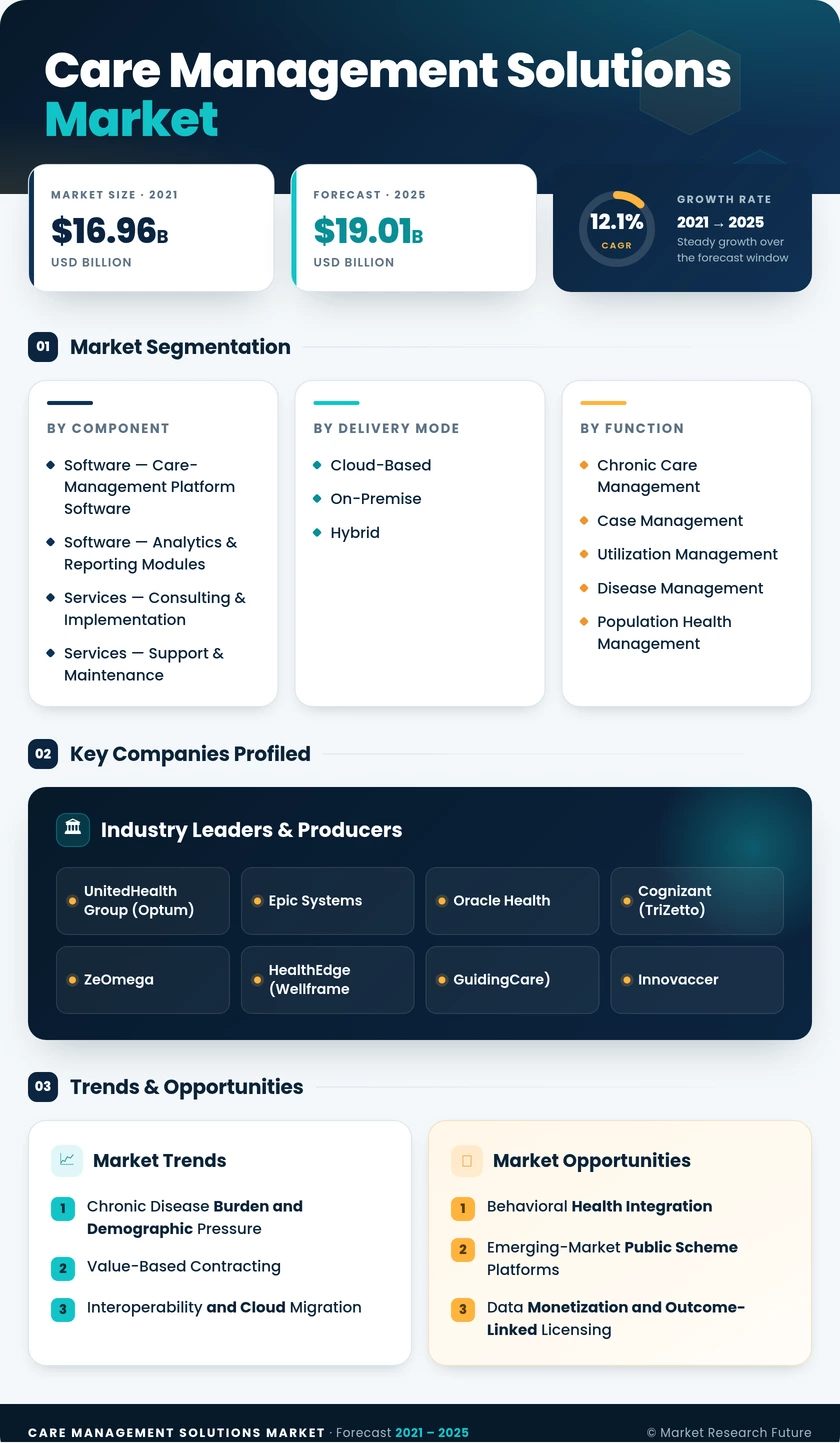
Care Management Solutions Market (2026 - 2035)

ID: MRFR/HC/5061-CR 200 Pages Rahul Gotadki Last Updated: September 15, 2026
Care Management Solutions Market Research Report: Size, Share, Trend Analysis By Solution Type (Software, Services, Consulting, Training), By Deployment Model (On-Premise, Cloud-Based, Hybrid), By End Users (Healthcare Providers, Payers, Government), By Applications (Chronic Disease Management, Care Coordination, Patient Engagement) and By Regional (North America, Europe, South America, Asia Pacific, Middle East and Africa) - Growth Outlook & Industry Forecast 2025 To 2035
Care Management Solutions Market
Market Size
Forecast Period2026-2035
CAGR (2026-2035)12.1%
Key Players
UnitedHealth Group
Epic Systems
Oracle Health
Cognizant
ZeOmega
HealthEdge (Wellframe
Opportunities
  • Behavioral Health Integration
  • Emerging-Market Public Scheme Platforms
  • Data Monetization and Outcome-Linked Licensing
  1. 1 Market Overview |
    1. 1.1 Study Assumptions & Market Definition |
    2. 1.2 Scope of the Study |
    3. 1.3 Research Methodology |
    4. 1.4 Market Summary
  2. 2 Key Report Takeaways |
    1. 2.1 By Component |
    2. 2.2 By Function |
    3. 2.3 By Region
  3. 3 Market Size & Forecast (2021–2035) |
    1. 3.1 Historical Market Size (2021–2024) |
    2. 3.2 Base Year Estimate (2025) |
    3. 3.3 Forecast Market Size (2026–2035) |
    4. 3.4 Year-over-Year Growth Analysis
  4. 4 Market Drivers Analysis |
    1. 4.1 Chronic Disease Burden and Demographic Pressure |
    2. 4.2 Value-Based Contracting |
    3. 4.3 Interoperability and Cloud Migration |
    4. 4.4 AI-Driven Risk Stratification
  5. 5 Market Restraints Analysis |
    1. 5.1 Integration Complexity |
    2. 5.2 Privacy and Compliance Overhead |
    3. 5.3 Attribution and ROI Ambiguity
  6. 6 Market Opportunity Analysis |
    1. 6.1 Behavioral Health Integration |
    2. 6.2 Emerging-Market Public Scheme Platforms |
    3. 6.3 Data Monetization and Outcome-Linked Licensing |
    4. 6.4 Employer Direct Contracting |
    5. 6.5 Home-Based and Post-Acute Coordination |
    6. 6.6 Industry Value Chain Analysis |
    7. 6.7 Porter's Five Forces Analysis
  7. 7 Regional Analysis |
    1. 7.1 North America | |
      1. 7.1.1 United States | |
      2. 7.1.2 Canada | |
      3. 7.1.3 Mexico |
    2. 7.2 Europe | |
      1. 7.2.1 Germany | |
      2. 7.2.2 United Kingdom | |
      3. 7.2.3 France | |
      4. 7.2.4 Italy | |
      5. 7.2.5 Spain | |
      6. 7.2.6 Nordic Countries | |
      7. 7.2.7 Russia | |
      8. 7.2.8 Rest of Europe |
    3. 7.3 Asia-Pacific | |
      1. 7.3.1 China | |
      2. 7.3.2 India | |
      3. 7.3.3 Japan | |
      4. 7.3.4 South Korea | |
      5. 7.3.5 ASEAN | |
      6. 7.3.6 Rest of Asia-Pacific |
    4. 7.4 South America | |
      1. 7.4.1 Brazil | |
      2. 7.4.2 Argentina | |
      3. 7.4.3 Rest of South America |
    5. 7.5 Middle East & Africa | |
      1. 7.5.1 Saudi Arabia | |
      2. 7.5.2 UAE | |
      3. 7.5.3 South Africa | |
      4. 7.5.4 Egypt | |
      5. 7.5.5 Rest of Middle East & Africa
  8. 8 Future Outlook (2026–2035) |
    1. 8.1 Autonomous Care Operations |
    2. 8.2 Platform Economics and Consolidation |
    3. 8.3 Social Determinants as Core Infrastructure |
    4. 8.4 Global Interoperability Convergence
  9. 9 Market Segmentation Analysis |
    1. 9.1 By Component | |
      1. 9.1.1 Software — Care-Management Platform Software | |
      2. 9.1.2 Software — Analytics & Reporting Modules | |
      3. 9.1.3 Services — Consulting & Implementation | |
      4. 9.1.4 Services — Support & Maintenance |
    2. 9.2 By Delivery Mode | |
      1. 9.2.1 Cloud-Based | |
      2. 9.2.2 On-Premise | |
      3. 9.2.3 Hybrid |
    3. 9.3 By Function | |
      1. 9.3.1 Chronic Care Management | |
      2. 9.3.2 Case Management | |
      3. 9.3.3 Utilization Management | |
      4. 9.3.4 Disease Management | |
      5. 9.3.5 Population Health Management |
    4. 9.4 By End User | |
      1. 9.4.1 Healthcare Payers — Commercial Insurers | |
      2. 9.4.2 Healthcare Payers — Public/Government Payers | |
      3. 9.4.3 Healthcare Providers | |
      4. 9.4.4 Employers & Government Bodies | |
      5. 9.4.5 Others (ACOs, TPAs)
  10. 10 Competitive Landscape |
    1. 10.1 Market Concentration Analysis (2026) |
    2. 10.2 Competitive Benchmarking Matrix |
    3. 10.3 Company Profiles | |
      1. 10.3.1 UnitedHealth Group (Optum) | |
      2. 10.3.2 Epic Systems | |
      3. 10.3.3 Oracle Health | |
      4. 10.3.4 Cognizant (TriZetto) | |
      5. 10.3.5 ZeOmega | |
      6. 10.3.6 HealthEdge | |
      7. 10.3.7 Innovaccer | |
      8. 10.3.8 Medecision | |
      9. 10.3.9 Veradigm | |
      10. 10.3.10 Koninklijke Philips | |
      11. 10.3.11 Pegasystems
  11. 11 Recent News & Developments
  12. 12 Report Scope & Methodology |
    1. 12.1 Study Period & Base Year |
    2. 12.2 Data Sources & Triangulation |
    3. 12.3 Abbreviations
  13. 13 Detailed Sources & Citations
  14. 14 Frequently Asked Questions
  15. 15 LIST OF TABLES |
  16. TABLE 1 Global Care Management Solutions Market Size & Forecast, by Revenue (USD Billion), 2021–2035 |
  17. TABLE 2 Global Care Management Solutions Market – Year-over-Year Growth Analysis, 2021–2035 |
  18. TABLE 3 Driver Impact Analysis Matrix, 2026–2035 |
  19. TABLE 4 Restraint Impact Analysis Matrix, 2026–2035 |
  20. TABLE 5 Global Market Size, by Region, 2021–2035 (USD Billion) |
  21. TABLE 6 North America Market Size, by Country, 2021–2035 (USD Billion) |
  22. TABLE 7 Europe Market Size, by Country, 2021–2035 (USD Billion) |
  23. TABLE 8 Asia-Pacific Market Size, by Country, 2021–2035 (USD Billion) |
  24. TABLE 9 South America Market Size, by Country, 2021–2035 (USD Billion) |
  25. TABLE 10 Middle East & Africa Market Size, by Country, 2021–2035 (USD Billion) |
  26. TABLE 11 Global Market Size, by Component, 2021–2035 (USD Billion) |
  27. TABLE 12 Global Market Size, by Delivery Mode, 2021–2035 (USD Billion) |
  28. TABLE 13 Global Market Size, by Function, 2021–2035 (USD Billion) |
  29. TABLE 14 Global Market Size, by End User, 2021–2035 (USD Billion) |
  30. TABLE 15 North America Market Size, by Component, 2021–2035 (USD Billion) |
  31. TABLE 16 North America Market Size, by Function, 2021–2035 (USD Billion) |
  32. TABLE 17 Europe Market Size, by Component, 2021–2035 (USD Billion) |
  33. TABLE 18 Europe Market Size, by End User, 2021–2035 (USD Billion) |
  34. TABLE 19 Asia-Pacific Market Size, by Delivery Mode, 2021–2035 (USD Billion) |
  35. TABLE 20 Asia-Pacific Market Size, by Function, 2021–2035 (USD Billion) |
  36. TABLE 21 South America Market Size, by End User, 2021–2035 (USD Billion) |
  37. TABLE 22 Middle East & Africa Market Size, by Component, 2021–2035 (USD Billion) |
  38. TABLE 23 Competitive Benchmarking Matrix, 2026 |
  39. TABLE 24 Company Profiles – Key Players |
  40. TABLE 25 Recent Developments & Strategic Announcements, 2023–2025 |
  41. TABLE 26 Report Scope & Methodology Summary |
  42. TABLE 27 Detailed Sources & Citations Index
  43. 16 LIST OF FIGURES |
  44. FIGURE 1 Market Dynamics – Drivers, Restraints, Opportunities and Challenges |
  45. FIGURE 2 Industry Value Chain Analysis |
  46. FIGURE 3 Porter's Five Forces Analysis |
  47. FIGURE 4 Global Market Size Trend, 2021–2035 (USD Billion) |
  48. FIGURE 5 Year-over-Year Growth Trajectory, 2022–2035 (%) |
  49. FIGURE 6 Market Share by Component, 2025 vs 2035 (%) |
  50. FIGURE 7 Market Share by Delivery Mode, 2025 vs 2035 (%) |
  51. FIGURE 8 Market Share by Function, 2025 (%) |
  52. FIGURE 9 Market Share by End User, 2025 (%) |
  53. FIGURE 10 Regional Revenue Share Distribution, 2025 (%) |
  54. FIGURE 11 Regional CAGR Comparison, 2026–2035 (%) |
  55. FIGURE 12 Country-Level Growth Heat Map, 2026–2035 |
  56. FIGURE 13 Competitive Positioning Quadrant, 2026 |
  57. FIGURE 14 Vendor Revenue Share Ranges, 2025 (%) |
  58. FIGURE 15 Technology Adoption Curve – Cloud vs On-Premise, 2021–2035

Segmentation Quick Reference

DimensionSub-SegmentsDominant SegmentFastest Growing Segment
By ComponentSoftware (Care-Management Platform Software, Analytics & Reporting Modules); Services (Consulting & Implementation, Support & Maintenance)Care-Management Platform SoftwareConsulting & Implementation
By Delivery ModeCloud-Based, On-Premise, HybridCloud-BasedHybrid
By FunctionChronic Care Management, Case Management, Utilization Management, Disease Management, Population Health ManagementChronic Care ManagementUtilization Management
By End UserHealthcare Payers (Commercial Insurers, Public/Government Payers), Healthcare Providers, Employers & Government Bodies, Others (ACOs, TPAs)Healthcare Payers — Commercial InsurersEmployers & Government Bodies
By RegionNorth America, Europe, Asia-Pacific, South America, Middle East & AfricaNorth AmericaAsia-Pacific


Market Segmentation Overview

By Component

Sub-SegmentKey Trend
Software — Care-Management Platform SoftwareSuite consolidation replacing point modules
Software — Analytics & Reporting ModulesEmbedded predictive scoring becomes table stakes.
Services — Consulting & ImplementationLegacy migration work outpaces new licensing.
Services — Support & MaintenanceShift toward managed-service and co-sourced models.


Component mix is tilting toward software as cloud delivery reduces the customization burden that once inflated services ratios. Services still grow faster in the near term because a decade-old installed base is turning over all at once.

By Delivery Mode

Sub-SegmentKey Trend
Cloud-BasedDefault architecture for new procurement decisions
On-PremisePersists where data residency law or legacy integration requires it
HybridBridge model for multi-year phased migrations


Cloud has already won on new deals; the interesting question is how quickly the on-premise base converts. Hybrid deployments grow fastest precisely because large payers cannot cut over in a single release cycle.

By Function

Sub-SegmentKey Trend
Chronic Care ManagementReimbursement codes underpin sustained demand
Case ManagementComplex-population caseloads drive licensed-seat growth.
Utilization ManagementPrior-authorization automation rules force platform refresh
Disease ManagementCondition-specific quality measures shape module design
Population Health ManagementRisk-contract reporting requirements broaden adoption.


Functional demand concentrates where reimbursement is explicit. Utilization management is the outlier — its growth is regulatory rather than clinical, driven by decision-timeline mandates that carry compliance deadlines.

By End User

Sub-SegmentKey Trend
Healthcare Payers — Commercial InsurersMedical loss ratio discipline sustains investment
Healthcare Payers — Public/Government PayersManaged-care contract requirements mandate capability
Healthcare ProvidersRisk-bearing participation drives clinical workflow embedding.
Employers & Government BodiesDirect contracting creates a new, faster-moving buyer.
Others (ACOs, TPAs)Delegated coordination services expand addressable demand


Payers remain the anchor buyer, but the growth story is on the periphery. Employers and delegated entities buy differently — shorter cycles, lower price points, and far less tolerance for multi-year implementations.

By Region

Sub-SegmentKey Trend
North AmericaRisk-based payment models sustain the largest revenue pool
EuropeRegulatory harmonization under EHDS reshapes procurement.
Asia-PacificPublic scheme digitization creates volume-led expansion.
South AmericaPrivate operator margin pressure drives selective adoption.
Middle East & AfricaNational transformation programs seed greenfield demand


Geographic performance follows payment reform, not spending levels. Regions that transfer financial risk to care organizations adopt fastest, regardless of per-capita health expenditure.




Download PDF ×

We do not share your information with anyone. However, we may send you emails based on your report interest from time to time. You may contact us at any time to opt-out.