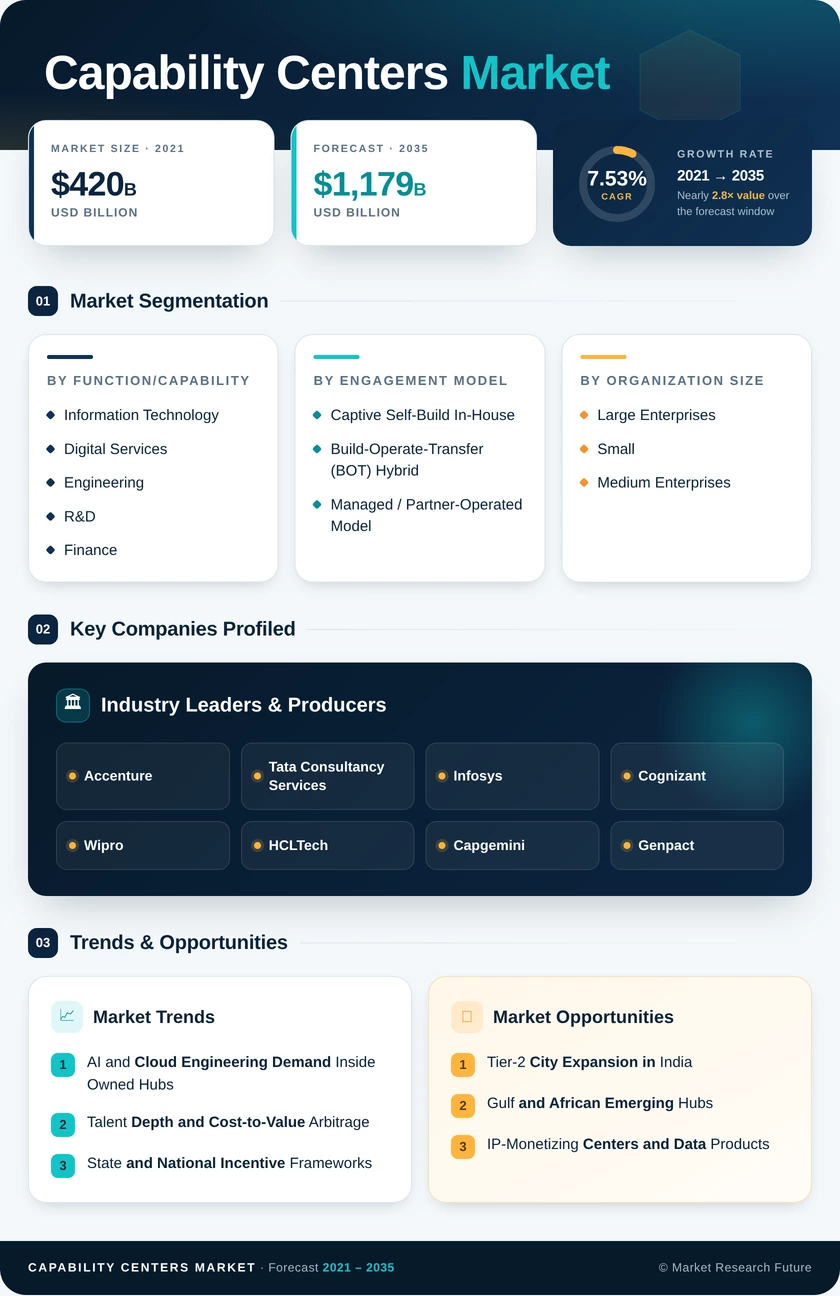
Capability Centers Market (2026 – 2035)

ID: MRFR/ICT/66525-HCR 110 Pages Nirmit Biswas Last Updated: September 24, 2026
Capability Centers Market By Capability (Operational Support, Transaction Processing, Knowledge Process Outsourcing, High-Value Engineering Services, Research & Innovation, and others), By Service Type (Shared Services, Captive Centers, Hybrid Delivery Models, Global In-House Centers, Centers of Excellence), By Organization Size (Large Enterprises, Mid-Sized Enterprises),By Delivery Model (Off-shore, Near-shore, On-shore),By End-use/Industry vertical (BFSI, IT & Telecommunications, Healthcare, Manufacturing, Retail),By Application (IT & Software Development, Infrastructure Management, Cybersecurity Operations, Artificial Intelligence & Machine Learning, and Others)
Capability Centers Market
Market Size
Forecast Period2026-2035
CAGR (2026-2035)7.53%
2025 Market SizeUSD 570.3 Billion
2035 Market SizeUSD 1,179.0 Billion
Key Players
Accenture
Tata Consultancy Services
Infosys
Cognizant
Wipro
HCLTech
Opportunities
  • Tier-2 City Expansion in India
  • Gulf and African Emerging Hubs
  • IP-Monetizing Centers and Data Products
  1. 1 Market Summary | |
  2. 2 Key Report Takeaways | |
    1. 2.1 By Function/Capability | |
    2. 2.2 By Engagement Model | |
    3. 2.3 By Organization Size | |
    4. 2.4 By Industry Vertical | |
    5. 2.5 By Region | |
  3. 3 Market Size and Forecast (2021–2035) | |
  4. 4 Driver Impact Analysis | |
    1. 4.1 AI and Cloud Engineering Demand Inside Owned Hubs | |
    2. 4.2 Talent Depth and Cost-to-Value Arbitrage | |
    3. 4.3 State and National Incentive Frameworks | |
    4. 4.4 BOT Partners and Cloud Enablers Lowering Entry Cost | |
    5. 4.5 U.S. Onshore Visa Cost Escalation | |
    6. 4.6 Nearshoring and Geographic Risk Diversification | |
  5. 5 Restraints Impact Analysis | |
    1. 5.1 Wage Inflation and Attrition in Tier-1 Hubs | |
    2. 5.2 Data Sovereignty and AI Regulation | |
    3. 5.3 U.S. Tax Treatment of Foreign R&D | |
    4. 5.4 Political Backlash and Proposed Outsourcing Taxes | |
    5. 5.5 Governance Complexity and Ramp-Up Cost | |
  6. 6 Opportunities | |
    1. 6.1 Tier-2 City Expansion in India | |
    2. 6.2 Gulf and African Emerging Hubs | |
    3. 6.3 IP-Monetizing Centers and Data Products | |
    4. 6.4 Subscription-Based Centers for Mid-Market Firms | |
    5. 6.5 Sustainability Reporting and Compliance Hubs | |
  7. 7 Regional Market Share and Country-Level Analysis | |
    1. 7.1 North America | | |
      1. 7.1.1 US | | |
      2. 7.1.2 Canada | | |
      3. 7.1.3 Mexico | |
    2. 7.2 Europe | | |
      1. 7.2.1 Germany | | |
      2. 7.2.2 UK | | |
      3. 7.2.3 France | | |
      4. 7.2.4 Italy | | |
      5. 7.2.5 Spain | | |
      6. 7.2.6 Nordic Countries | | |
      7. 7.2.7 Russia | | |
      8. 7.2.8 Rest of Europe | |
    3. 7.3 Asia-Pacific | | |
      1. 7.3.1 China | | |
      2. 7.3.2 India | | |
      3. 7.3.3 Japan | | |
      4. 7.3.4 South Korea | | |
      5. 7.3.5 ASEAN | | |
      6. 7.3.6 Rest of Asia-Pacific | |
    4. 7.4 South America | | |
      1. 7.4.1 Brazil | | |
      2. 7.4.2 Argentina | | |
      3. 7.4.3 Rest of South America | |
    5. 7.5 Middle East & Africa | | |
      1. 7.5.1 Saudi Arabia | | |
      2. 7.5.2 UAE | | |
      3. 7.5.3 South Africa | | |
      4. 7.5.4 Egypt | | |
      5. 7.5.5 Rest of MEA | |
  8. 8 Future Outlook (2026–2035) | |
    1. 8.1 Agentic AI and Workforce Redesign | |
    2. 8.2 Hub-and-Spoke Multi-Country Networks | |
    3. 8.3 From Cost Center to IP Owner | |
    4. 8.4 Sustainability and Regulatory Reporting Operations | |
  9. 9 Segmentation Analysis | |
    1. 9.1 By Function/Capability | | |
      1. 9.1.1 Information Technology and Digital Services | | |
      2. 9.1.2 Engineering and R&D | | |
      3. 9.1.3 Finance and Accounting | | |
      4. 9.1.4 Customer Experience and Support | | |
      5. 9.1.5 Other Functions | |
    2. 9.2 By Engagement Model | | |
      1. 9.2.1 Captive Self-Build In-House | | |
      2. 9.2.2 Build-Operate-Transfer (BOT) Hybrid | | |
      3. 9.2.3 Managed / Partner-Operated Model | |
    3. 9.3 By Organization Size | | |
      1. 9.3.1 Large Enterprises | | |
      2. 9.3.2 Small and Medium Enterprises | |
    4. 9.4 By Industry Vertical | | |
      1. 9.4.1 Telecom and IT | | |
      2. 9.4.2 Banking, Financial Services, and Insurance (BFSI) | | |
      3. 9.4.3 Healthcare and Life Sciences | | |
      4. 9.4.4 Automotive and Industrial | | |
      5. 9.4.5 Retail and Consumer Goods | | |
      6. 9.4.6 Other Industry Verticals | |
  10. 10 Competitive Landscape | |
  11. 11 Recent News & Developments | |
  12. 12 Report Scope and Methodology | |
  13. 13 Detailed Sources and Citations | |
  14. 14 Frequently Asked Questions (FAQs) | | LIST OF TABLES | |
  15. TABLE 1 Report Summary, 2025 and 2035 | |
  16. TABLE 2 Global Market Size & Forecast, by Revenue (USD Billion), 2021–2035 | |
  17. TABLE 3 Driver Impact Analysis, 2026–2035 | |
  18. TABLE 4 Restraints Impact Analysis, 2026–2035 | |
  19. TABLE 5 Regional Summary, 2025 | |
  20. TABLE 6 North America Market, by Country, 2025–2035 | |
  21. TABLE 7 Europe Market, by Country, 2025–2035 | |
  22. TABLE 8 Asia-Pacific Market, by Country, 2025–2035 | |
  23. TABLE 9 South America Market, by Country, 2025–2035 | |
  24. TABLE 10 Middle East & Africa Market, by Country, 2025–2035 | |
  25. TABLE 11 Market Size, by Function/Capability, 2025–2035 | |
  26. TABLE 12 Market Size, by Engagement Model, 2025–2035 | |
  27. TABLE 13 Market Size, by Organization Size, 2025–2035 | |
  28. TABLE 14 Market Size, by Industry Vertical, 2025–2035 | |
  29. TABLE 15 Competitive Benchmarking Matrix, 2025 | |
  30. TABLE 16 Report Scope and Methodology | |
  31. TABLE 17 Detailed Sources and Citations | |
  32. TABLE 18 Segmentation Quick Reference | |
  33. TABLE 19 Function/Capability Sub-Segment Trends | |
  34. TABLE 20 Engagement Model Sub-Segment Trends | |
  35. TABLE 21 Organization Size Sub-Segment Trends | |
  36. TABLE 22 Industry Vertical Sub-Segment Trends | | LIST OF FIGURES | |
  37. FIGURE 1 Market Dynamics Overview (Drivers, Restraints, Opportunities) | |
  38. FIGURE 2 Industry Value Chain Analysis | |
  39. FIGURE 3 Porter's Five Forces Analysis | |
  40. FIGURE 4 Global Market Size Trend, 2021–2035 (USD Billion) | |
  41. FIGURE 5 Year-over-Year Growth Rate, 2022–2035 | |
  42. FIGURE 6 Market Share, by Function/Capability, 2025 | |
  43. FIGURE 7 Market Share, by Engagement Model, 2025 | |
  44. FIGURE 8 Market Share, by Organization Size, 2025 | |
  45. FIGURE 9 Market Share, by Industry Vertical, 2025 | |
  46. FIGURE 10 Regional Market Share, 2025 | |
  47. FIGURE 11 Regional Growth Comparison, 2026–2035 | |
  48. FIGURE 12 Competitive Positioning Matrix, 2025 | |
  49. FIGURE 13 Estimated Revenue Share Ranges of Key Players, 2025

Segmentation Quick Reference

Dimension Sub-Segments Dominant Segment Fastest Growing Segment
By Function/Capability Information Technology and Digital Services; Engineering and R&D; Finance and Accounting; Customer Experience and Support; Other Functions Information Technology and Digital Services (51.3%) Engineering and R&D (8.9% CAGR)
By Engagement Model Captive Self-Build In-House; Build-Operate-Transfer (BOT) Hybrid; Managed / Partner-Operated Model Captive Self-Build In-House (54.6%) Build-Operate-Transfer (BOT) Hybrid (8.6% CAGR)
By Organization Size Large Enterprises; Small and Medium Enterprises Large Enterprises (80.9%) Small and Medium Enterprises (9.4% CAGR)
By Industry Vertical Telecom and IT; Banking, Financial Services, and Insurance (BFSI); Healthcare and Life Sciences; Automotive and Industrial; Retail and Consumer Goods; Other Industry Verticals Telecom and IT (33.9%) Banking, Financial Services, and Insurance (BFSI) (8.5% CAGR)
By Region North America; Europe; Asia-Pacific; South America; Middle East & Africa Asia-Pacific (44.8%) Middle East & Africa (10.6% CAGR)


Market Segmentation Overview

By Function/Capability

Sub-Segment Key Trend
Information Technology and Digital Services Shift from application maintenance to cloud-native platform and AI product ownership
Engineering and R&D Co-location with semiconductor, automotive software, and biotech programs
Finance and Accounting Continuous close, automated reconciliation, and regulatory reporting
Customer Experience and Support AI-assisted agents replacing first-line human contact
Other Functions Consolidation of HR, procurement, and legal work into multi-function hubs


Information Technology and Digital Services leads this dimension with a 51.3% share because parent firms now route cloud architecture and AI model development through owned hubs rather than vendors. Engineering and R&D grows fastest at an 8.9% CAGR, as chip design, vehicle software, and drug discovery teams require proprietary IP control that only captive or BOT structures provide. Customer Experience and Support faces the heaviest automation exposure, limiting its headcount growth.

By Engagement Model

Sub-Segment Key Trend
Captive Self-Build In-House Mature enterprises expanding existing sites into multi-function campuses
Build-Operate-Transfer (BOT) Hybrid Partner-led ramp-ups with transfer rights after two to four years
Managed / Partner-Operated Model Variable-cost capacity for pilots and volatile demand


Captive Self-Build In-House remains dominant at 54.6% because enterprises with established offshore experience prefer full control over talent, security, and IP. Build-Operate-Transfer (BOT) Hybrid grows fastest at an 8.6% CAGR, as first-time entrants and firms entering regulated markets such as Saudi Arabia use partners to handle entity setup and compliance before taking ownership. The Managed / Partner-Operated Model serves buyers testing a location before committing capital.

By Organization Size

Sub-Segment Key Trend
Large Enterprises Multi-country hub-and-spoke networks with centralized governance
Small and Medium Enterprises Subscription-based center launches using standardized cloud and compliance stacks


Large Enterprises hold 80.9% of value, running portfolios of centers that benefit from global procurement leverage and multi-tower governance. Small and Medium Enterprises grow fastest at a 9.4% CAGR because per-seat subscription models and turnkey BOT offerings remove the upfront capital and legal complexity that once kept mid-market firms out. This buyer shift expands the number of centers faster than it expands average center size.

By Industry Vertical

Sub-Segment Key Trend
Telecom and IT 5G software, network automation, and platform engineering
Banking, Financial Services, and Insurance (BFSI) Open-banking APIs, fraud analytics, and core modernization
Healthcare and Life Sciences Clinical trial data platforms and AI-enabled pharmacovigilance
Automotive and Industrial Software-defined vehicle code and predictive maintenance
Retail and Consumer Goods Omnichannel inventory and personalization engines
Other Industry Verticals Energy transition analytics and public-sector digital services


Telecom and IT leads with a 33.9% share, sustained by recurring network upgrade cycles and 5G software development. Banking, Financial Services, and Insurance (BFSI) grows fastest at an 8.5% CAGR as banks move fraud detection, digital wallet features, and regulatory stress-testing into owned centers where data controls are tighter. Healthcare and Life Sciences and Automotive and Industrial add diversified demand that cushions the market against single-sector downturns.




Download PDF ×

We do not share your information with anyone. However, we may send you emails based on your report interest from time to time. You may contact us at any time to opt-out.