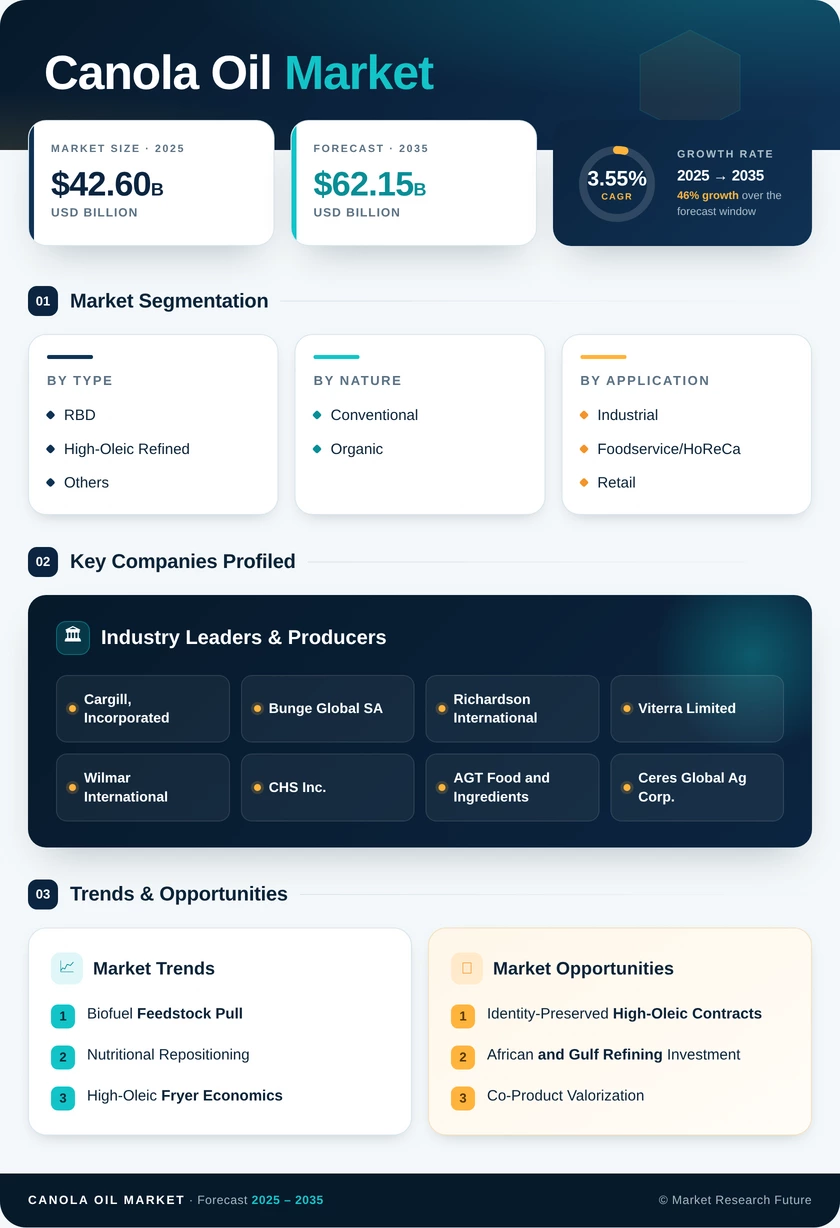
Canola Oil Market (2026 - 2035)

Canola Oil Market Size, Share, Industry Trend & Analysis Research Report Information By Product Type (RBD, High-Oleic Refined, Others), By Nature (Organic, Conventional), By End User (Industrial, Foodservice/HoReCa, Retail), By Region (North America, South America, Europe, Asia-Pacific, Middle East and Africa) – Forecast Till 2035

Forecast Period
2026-2035
CAGR
3.55%
2025 Market Size
USD 42.60 Billion
2035 Market Size
USD 62.15 Billion
Food, Beverages & Nutrition ● Updated August 24, 2026 Report ID: MRFR/FnB/2036-HCR | Pages: 110 | Author: Harshita Gorde
  1. 1 Market Summary |
    1. 1.1 Study Assumptions & Market Definition |
    2. 1.2 Scope of the Study |
    3. 1.3 Research Methodology
  2. 2 Key Report Takeaways |
    1. 2.1 By Product Type |
    2. 2.2 By Nature |
    3. 2.3 By End User |
    4. 2.4 By Region
  3. 3 Market Size & Forecast (2021–2035) |
    1. 3.1 Historical Market Size (2021–2024) |
    2. 3.2 Base Year Assessment (2025) |
    3. 3.3 Forecast Market Size (2026–2035) |
    4. 3.4 Year-over-Year Growth Analysis
  4. 4 Driver Impact Analysis |
    1. 4.1 Biofuel Feedstock Pull |
    2. 4.2 Nutritional Repositioning |
    3. 4.3 High-Oleic Fryer Economics |
    4. 4.4 Asian Consumption Growth
  5. 5 Restraints Impact Analysis |
    1. 5.1 Trade Exposure |
    2. 5.2 Agronomic Volatility |
    3. 5.3 Regulatory and Perception Barriers
  6. 6 Opportunities |
    1. 6.1 Identity-Preserved High-Oleic Contracts |
    2. 6.2 African and Gulf Refining Investment |
    3. 6.3 Co-Product Valorization |
    4. 6.4 Digital Traceability as a Revenue Line |
    5. 6.5 Cold-Pressed Premium Retail
  7. 7 Regional Market Share & Country-Level Analysis |
    1. 7.1 North America | |
      1. 7.1.1 US | |
      2. 7.1.2 Canada | |
      3. 7.1.3 Mexico |
    2. 7.2 Europe | |
      1. 7.2.1 Germany | |
      2. 7.2.2 UK | |
      3. 7.2.3 France | |
      4. 7.2.4 Italy | |
      5. 7.2.5 Spain | |
      6. 7.2.6 Nordic Countries | |
      7. 7.2.7 Russia | |
      8. 7.2.8 Rest of Europe |
    3. 7.3 Asia-Pacific | |
      1. 7.3.1 China | |
      2. 7.3.2 India | |
      3. 7.3.3 Japan | |
      4. 7.3.4 South Korea | |
      5. 7.3.5 ASEAN | |
      6. 7.3.6 Rest of Asia-Pacific |
    4. 7.4 South America | |
      1. 7.4.1 Brazil | |
      2. 7.4.2 Argentina | |
      3. 7.4.3 Rest of South America |
    5. 7.5 Middle East & Africa | |
      1. 7.5.1 Saudi Arabia | |
      2. 7.5.2 UAE | |
      3. 7.5.3 South Africa | |
      4. 7.5.4 Egypt | |
      5. 7.5.5 Rest of Middle East & Africa
  8. 8 Future Outlook (2026–2035) |
    1. 8.1 Feedstock Carbon Accounting |
    2. 8.2 Crush Capacity Overbuild Risk |
    3. 8.3 Protein Extraction Economics |
    4. 8.4 Climate-Adapted Genetics
  9. 9 Market Segmentation Analysis |
    1. 9.1 By Product Type | |
      1. 9.1.1 RBD | |
      2. 9.1.2 High-Oleic Refined | |
      3. 9.1.3 Others |
    2. 9.2 By Nature | |
      1. 9.2.1 Organic | |
      2. 9.2.2 Conventional |
    3. 9.3 By End User | |
      1. 9.3.1 Industrial | |
      2. 9.3.2 Foodservice/HoReCa | |
      3. 9.3.3 Retail
  10. 10 Competitive Landscape |
    1. 10.1 Market Concentration Analysis (2026) |
    2. 10.2 Competitive Benchmarking Matrix |
    3. 10.3 Company Profiles | |
      1. 10.3.1 Cargill, Incorporated | |
      2. 10.3.2 Archer-Daniels-Midland Company | |
      3. 10.3.3 Bunge Global SA | |
      4. 10.3.4 Louis Dreyfus Company | |
      5. 10.3.5 Richardson International | |
      6. 10.3.6 Viterra Limited | |
      7. 10.3.7 Wilmar International | |
      8. 10.3.8 CHS Inc. | |
      9. 10.3.9 AGT Food and Ingredients | |
      10. 10.3.10 Ceres Global Ag Corp.
  11. 11 Recent News & Developments
  12. 12 Report Scope & Methodology |
    1. 12.1 Study Period & Base Year |
    2. 12.2 Valuation Currency & Units |
    3. 12.3 Abbreviations
  13. 13 Detailed Sources & Citations
  14. 14 Frequently Asked Questions
  15. 15 LIST OF TABLES |
  16. TABLE 1 Global Canola Oil Market Size & Forecast, by Revenue (USD Billion), 2021–2035 |
  17. TABLE 2 Global Canola Oil Market – Year-over-Year Growth Analysis, 2021–2035 |
  18. TABLE 3 Driver Impact Analysis – Canola Oil Market, 2026–2035 |
  19. TABLE 4 Restraint Impact Analysis – Canola Oil Market, 2026–2035 |
  20. TABLE 5 Global Canola Oil Market Size, by Product Type, 2021–2035 (USD Billion) |
  21. TABLE 6 Global Canola Oil Market Size, by Nature, 2021–2035 (USD Billion) |
  22. TABLE 7 Global Canola Oil Market Size, by End User, 2021–2035 (USD Billion) |
  23. TABLE 8 Global Canola Oil Market Size, by Region, 2021–2035 (USD Billion) |
  24. TABLE 9 North America Canola Oil Market Size, by Country, 2021–2035 (USD Billion) |
  25. TABLE 10 Europe Canola Oil Market Size, by Country, 2021–2035 (USD Billion) |
  26. TABLE 11 Asia-Pacific Canola Oil Market Size, by Country, 2021–2035 (USD Billion) |
  27. TABLE 12 South America Canola Oil Market Size, by Country, 2021–2035 (USD Billion) |
  28. TABLE 13 Middle East & Africa Canola Oil Market Size, by Country, 2021–2035 (USD Billion) |
  29. TABLE 14 North America Canola Oil Market Size, by Product Type, 2021–2035 (USD Billion) |
  30. TABLE 15 North America Canola Oil Market Size, by Nature, 2021–2035 (USD Billion) |
  31. TABLE 16 North America Canola Oil Market Size, by End User, 2021–2035 (USD Billion) |
  32. TABLE 17 Europe Canola Oil Market Size, by Product Type, 2021–2035 (USD Billion) |
  33. TABLE 18 Europe Canola Oil Market Size, by Nature, 2021–2035 (USD Billion) |
  34. TABLE 19 Europe Canola Oil Market Size, by End User, 2021–2035 (USD Billion) |
  35. TABLE 20 Asia-Pacific Canola Oil Market Size, by Product Type, 2021–2035 (USD Billion) |
  36. TABLE 21 Asia-Pacific Canola Oil Market Size, by Nature, 2021–2035 (USD Billion) |
  37. TABLE 22 Asia-Pacific Canola Oil Market Size, by End User, 2021–2035 (USD Billion) |
  38. TABLE 23 South America Canola Oil Market Size, by Product Type, 2021–2035 (USD Billion) |
  39. TABLE 24 South America Canola Oil Market Size, by End User, 2021–2035 (USD Billion) |
  40. TABLE 25 Middle East & Africa Canola Oil Market Size, by Product Type, 2021–2035 (USD Billion) |
  41. TABLE 26 Middle East & Africa Canola Oil Market Size, by End User, 2021–2035 (USD Billion) |
  42. TABLE 27 US Canola Oil Market Size, by Product Type, 2021–2035 (USD Billion) |
  43. TABLE 28 Canada Canola Oil Market Size, by Product Type, 2021–2035 (USD Billion) |
  44. TABLE 29 China Canola Oil Market Size, by End User, 2021–2035 (USD Billion) |
  45. TABLE 30 India Canola Oil Market Size, by End User, 2021–2035 (USD Billion) |
  46. TABLE 31 Competitive Benchmarking Matrix – Global Canola Oil Market, 2026 |
  47. TABLE 32 Company Profiles – Key Players, Global Canola Oil Market |
  48. TABLE 33 Recent Developments & Strategic Announcements, 2023–2025 |
  49. TABLE 34 Report Scope & Methodology Summary |
  50. TABLE 35 Detailed Sources & Citations Index
  51. 16 LIST OF FIGURES |
  52. FIGURE 1 Global Canola Oil Market – Market Dynamics Overview (Drivers, Restraints, Opportunities) |
  53. FIGURE 2 Global Canola Oil Market – Industry Value Chain Analysis |
  54. FIGURE 3 Global Canola Oil Market – Porter's Five Forces Analysis |
  55. FIGURE 4 Global Canola Oil Market Size Trend, 2021–2035 (USD Billion) |
  56. FIGURE 5 Global Canola Oil Market – Year-over-Year Growth Trend, 2021–2035 |
  57. FIGURE 6 Market Share by Product Type, 2025 vs 2035 (%) |
  58. FIGURE 7 Market Share by Nature, 2025 vs 2035 (%) |
  59. FIGURE 8 Market Share by End User, 2025 vs 2035 (%) |
  60. FIGURE 9 Regional Market Share Distribution, 2025 (%) |
  61. FIGURE 10 Regional Market Share Distribution, 2035 (%) |
  62. FIGURE 11 Regional CAGR Comparison, 2026–2035 (%) |
  63. FIGURE 12 North America Country-Level Share Breakdown, 2025 (%) |
  64. FIGURE 13 Asia-Pacific Country-Level Share Breakdown, 2025 (%) |
  65. FIGURE 14 Europe Country-Level Share Breakdown, 2025 (%) |
  66. FIGURE 15 Competitive Landscape – Estimated Revenue Share Ranges, 2026 |
  67. FIGURE 16 Competitive Positioning Matrix – Scale vs Specialization |
  68. FIGURE 17 Crush Capacity vs Demand Growth Outlook, 2026–2035

Segmentation Quick Reference

DimensionSub-SegmentsDominant SegmentFastest Growing Segment
By Product TypeRBD; High-Oleic Refined; OthersRBDHigh-Oleic Refined
By NatureOrganic; ConventionalConventionalOrganic
By End UserIndustrial; Foodservice/HoReCa; RetailIndustrialFoodservice/HoReCa
By RegionNorth America; South America; Europe; Asia-Pacific; Middle East and AfricaAsia-PacificMiddle East and Africa


Market Segmentation Overview

By Product Type

Sub-SegmentKey Trend
RBDBulk refining scale keeps unit costs lowest; remains default for private-label bottling and industrial formulation
High-Oleic RefinedFryer-life economics and reduced disposal costs drive quick-service adoption; grower contracting expands in the Prairies
OthersCold-pressed, unrefined and blended specialty grades gain shelf presence in Northern Europe and Japan


Product-type dynamics turn on total cost of ownership rather than headline price. RBD holds volume because industrial recipes are cost-indexed, but high-oleic grades keep winning conversions wherever operators calculate oil replacement cycles honestly.

By Nature

Sub-SegmentKey Trend
ConventionalHerbicide-tolerant varietals underpin yield and cost efficiency across all major producing regions
OrganicCertified acreage remains scarce; weed management difficulty sustains 30–45% price premiums and chronic undersupply


Nature-based segmentation is really a supply story. Organic demand consistently outruns certified acreage, so growth is capped by agronomy rather than by consumer appetite.

By End User

Sub-SegmentKey Trend
IndustrialBakery, snack, sauce and biofuel processors contract in volume and set the reference price signal
Foodservice/HoReCaRestaurant expansion across Asia and the Gulf drives conversion to stable frying grades
RetailBrand and health positioning support premium formats; least price-elastic at the top of the shelf


End-user behavior diverges sharply on contracting horizon. Industrial buyers lock specifications years ahead, foodservice reformulates fast but buys through distributors, and retail responds to label claims more than to commodity pricing.

By Region

Sub-SegmentKey Trend
North AmericaCrush expansion collides with renewable diesel feedstock demand, tightening food-grade availability
South AmericaSoybean oil dominance confines canola to premium and health-positioned niches
EuropeBiofuel mandates sustain crush volume while non-GMO requirements cap food-side penetration
Asia-PacificDomestic crush policy and edible oil import diversification anchor the largest regional pool
Middle East and AfricaLocal refining and bottling investment captures margin previously earned offshore


Geographic performance depends on whether a region crushes, refines, or simply consumes. The fastest value creation over the next decade sits with markets moving up the processing chain rather than those merely importing finished oil.




Download PDF ×

We do not share your information with anyone. However, we may send you emails based on your report interest from time to time. You may contact us at any time to opt-out.