Canada Canada Self Healing Networks Market Segmentation
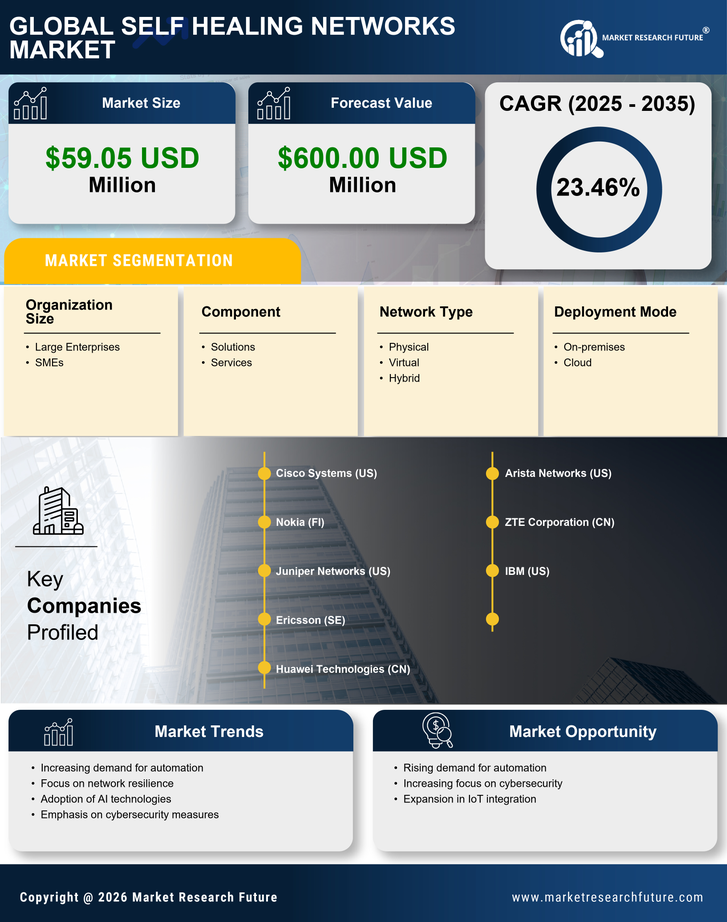
Canada Self Healing Networks Market By Component (USD Million, 2025-2035)
- Solutions
- Services
Canada Self Healing Networks Market By Network Type (USD Million, 2025-2035)
- Physical
- Virtual
- Hybrid
Canada Self Healing Networks Market By Organization Size (USD Million, 2025-2035)
- Large Enterprises
- SMEs
Canada Self Healing Networks Market By Deployment Mode (USD Million, 2025-2035)
- On-premises
- Cloud
Canada Self Healing Networks Market By Application (USD Million, 2025-2035)
- Network Provisioning
- Network Bandwidth Monitoring
- Policy Management
- Security Compliance Management
- Root Cause Analysis
- Network Traffic Management
- Network Access Control
- Other Applications
Canada Self Healing Networks Market By Verticals (USD Million, 2025-2035)
- IT and ITES
- BFSI
- Media and Entertainment
- Healthcare and Life Sciences
- Telecom
- Retail and Consumer Goods
- Education
- Other Verticals