Canada Route Optimization Software Market

ID: MRFR/ICT/60016-HCR
200 Pages
Nirmit Biswas
Last Updated: February 06, 2026
Canada Route Optimization Software Market Size, Share and Research Report: By Deployment Type (Cloud-Based, On-Premise, Hybrid), By End User (Transportation and Logistics, Retail, Healthcare, Government), By Features (Real-Time Tracking, Traffic Analysis, Multi-Stop Routing, Route Analytics, Mobile Compatibility) and By Application (Fleet Management, Last-Mile Delivery, Field Service Management)-Forecast to 2035
Download PDF ×

We do not share your information with anyone. However, we may send you emails based on your report interest from time to time. You may contact us at any time to opt-out.

Canada Route Optimization Software Market

Market Size

Forecast Period2025 - 2035
CAGR (2025 - 2035)7.27%
2024 Market Size$ 524.18 Million
2025 Market Size$ 562.29 Million
2035 Market Size$ 1,134.8 Million

Key Players

Trimble
HERE Technologies
Oracle
SAP
Verizon Connect
TomTom
Opportunities
  • Increasing Demand for Efficient Logistics
  • Advancements in Technology and Data Analytics
  • Rising Fuel Prices and Environmental Concerns
  1. 1 SECTION I: EXECUTIVE SUMMARY AND KEY HIGHLIGHTS
    1. 1.1 EXECUTIVE SUMMARY
      1. 1.1.1 Market Overview
      2. 1.1.2 Key Findings
      3. 1.1.3 Market Segmentation
      4. 1.1.4 Competitive Landscape
      5. 1.1.5 Challenges and Opportunities
      6. 1.1.6 Future Outlook
  2. 2 SECTION II: SCOPING, METHODOLOGY AND MARKET STRUCTURE
    1. 2.1 MARKET INTRODUCTION
      1. 2.1.1 Definition
      2. 2.1.2 Scope of the study
        1. 2.1.2.1 Research Objective
        2. 2.1.2.2 Assumption
        3. 2.1.2.3 Limitations
    2. 2.2 RESEARCH METHODOLOGY
      1. 2.2.1 Overview
      2. 2.2.2 Data Mining
      3. 2.2.3 Secondary Research
      4. 2.2.4 Primary Research
        1. 2.2.4.1 Primary Interviews and Information Gathering Process
        2. 2.2.4.2 Breakdown of Primary Respondents
      5. 2.2.5 Forecasting Model
      6. 2.2.6 Market Size Estimation
        1. 2.2.6.1 Bottom-Up Approach
        2. 2.2.6.2 Top-Down Approach
      7. 2.2.7 Data Triangulation
      8. 2.2.8 Validation
  3. 3 SECTION III: QUALITATIVE ANALYSIS
    1. 3.1 MARKET DYNAMICS
      1. 3.1.1 Overview
      2. 3.1.2 Drivers
      3. 3.1.3 Restraints
      4. 3.1.4 Opportunities
    2. 3.2 MARKET FACTOR ANALYSIS
      1. 3.2.1 Value chain Analysis
      2. 3.2.2 Porter's Five Forces Analysis
        1. 3.2.2.1 Bargaining Power of Suppliers
        2. 3.2.2.2 Bargaining Power of Buyers
        3. 3.2.2.3 Threat of New Entrants
        4. 3.2.2.4 Threat of Substitutes
        5. 3.2.2.5 Intensity of Rivalry
      3. 3.2.3 COVID-19 Impact Analysis
        1. 3.2.3.1 Market Impact Analysis
        2. 3.2.3.2 Regional Impact
        3. 3.2.3.3 Opportunity and Threat Analysis
  4. 4 SECTION IV: QUANTITATIVE ANALYSIS
    1. 4.1 Information and Communications Technology, BY Deployment Type (USD Million)
      1. 4.1.1 Cloud-Based
      2. 4.1.2 On-Premise
      3. 4.1.3 Hybrid
    2. 4.2 Information and Communications Technology, BY End User (USD Million)
      1. 4.2.1 Transportation and Logistics
      2. 4.2.2 Retail
      3. 4.2.3 Healthcare
      4. 4.2.4 Government
    3. 4.3 Information and Communications Technology, BY Features (USD Million)
      1. 4.3.1 Real-Time Tracking
      2. 4.3.2 Traffic Analysis
      3. 4.3.3 Multi-Stop Routing
      4. 4.3.4 Route Analytics
      5. 4.3.5 Mobile Compatibility
    4. 4.4 Information and Communications Technology, BY Application (USD Million)
      1. 4.4.1 Fleet Management
      2. 4.4.2 Last-Mile Delivery
      3. 4.4.3 Field Service Management
  5. 5 SECTION V: COMPETITIVE ANALYSIS
    1. 5.1 Competitive Landscape
      1. 5.1.1 Overview
      2. 5.1.2 Competitive Analysis
      3. 5.1.3 Market share Analysis
      4. 5.1.4 Major Growth Strategy in the Information and Communications Technology
      5. 5.1.5 Competitive Benchmarking
      6. 5.1.6 Leading Players in Terms of Number of Developments in the Information and Communications Technology
      7. 5.1.7 Key developments and growth strategies
        1. 5.1.7.1 New Product Launch/Service Deployment
        2. 5.1.7.2 Merger & Acquisitions
        3. 5.1.7.3 Joint Ventures
      8. 5.1.8 Major Players Financial Matrix
        1. 5.1.8.1 Sales and Operating Income
        2. 5.1.8.2 Major Players R&D Expenditure. 2023
    2. 5.2 Company Profiles
      1. 5.2.1 Trimble (US)
        1. 5.2.1.1 Financial Overview
        2. 5.2.1.2 Products Offered
        3. 5.2.1.3 Key Developments
        4. 5.2.1.4 SWOT Analysis
        5. 5.2.1.5 Key Strategies
      2. 5.2.2 HERE Technologies (NL)
        1. 5.2.2.1 Financial Overview
        2. 5.2.2.2 Products Offered
        3. 5.2.2.3 Key Developments
        4. 5.2.2.4 SWOT Analysis
        5. 5.2.2.5 Key Strategies
      3. 5.2.3 Oracle (US)
        1. 5.2.3.1 Financial Overview
        2. 5.2.3.2 Products Offered
        3. 5.2.3.3 Key Developments
        4. 5.2.3.4 SWOT Analysis
        5. 5.2.3.5 Key Strategies
      4. 5.2.4 SAP (DE)
        1. 5.2.4.1 Financial Overview
        2. 5.2.4.2 Products Offered
        3. 5.2.4.3 Key Developments
        4. 5.2.4.4 SWOT Analysis
        5. 5.2.4.5 Key Strategies
      5. 5.2.5 Verizon Connect (US)
        1. 5.2.5.1 Financial Overview
        2. 5.2.5.2 Products Offered
        3. 5.2.5.3 Key Developments
        4. 5.2.5.4 SWOT Analysis
        5. 5.2.5.5 Key Strategies
      6. 5.2.6 TomTom (NL)
        1. 5.2.6.1 Financial Overview
        2. 5.2.6.2 Products Offered
        3. 5.2.6.3 Key Developments
        4. 5.2.6.4 SWOT Analysis
        5. 5.2.6.5 Key Strategies
      7. 5.2.7 Samsara (US)
        1. 5.2.7.1 Financial Overview
        2. 5.2.7.2 Products Offered
        3. 5.2.7.3 Key Developments
        4. 5.2.7.4 SWOT Analysis
        5. 5.2.7.5 Key Strategies
      8. 5.2.8 Fleet Complete (CA)
        1. 5.2.8.1 Financial Overview
        2. 5.2.8.2 Products Offered
        3. 5.2.8.3 Key Developments
        4. 5.2.8.4 SWOT Analysis
        5. 5.2.8.5 Key Strategies
      9. 5.2.9 MapQuest (US)
        1. 5.2.9.1 Financial Overview
        2. 5.2.9.2 Products Offered
        3. 5.2.9.3 Key Developments
        4. 5.2.9.4 SWOT Analysis
        5. 5.2.9.5 Key Strategies
    3. 5.3 Appendix
      1. 5.3.1 References
      2. 5.3.2 Related Reports
  6. 6 LIST OF FIGURES
    1. 6.1 MARKET SYNOPSIS
    2. 6.2 CANADA MARKET ANALYSIS BY DEPLOYMENT TYPE
    3. 6.3 CANADA MARKET ANALYSIS BY END USER
    4. 6.4 CANADA MARKET ANALYSIS BY FEATURES
    5. 6.5 CANADA MARKET ANALYSIS BY APPLICATION
    6. 6.6 KEY BUYING CRITERIA OF INFORMATION AND COMMUNICATIONS TECHNOLOGY
    7. 6.7 RESEARCH PROCESS OF MRFR
    8. 6.8 DRO ANALYSIS OF INFORMATION AND COMMUNICATIONS TECHNOLOGY
    9. 6.9 DRIVERS IMPACT ANALYSIS: INFORMATION AND COMMUNICATIONS TECHNOLOGY
    10. 6.10 RESTRAINTS IMPACT ANALYSIS: INFORMATION AND COMMUNICATIONS TECHNOLOGY
    11. 6.11 SUPPLY / VALUE CHAIN: INFORMATION AND COMMUNICATIONS TECHNOLOGY
    12. 6.12 INFORMATION AND COMMUNICATIONS TECHNOLOGY, BY DEPLOYMENT TYPE, 2024 (% SHARE)
    13. 6.13 INFORMATION AND COMMUNICATIONS TECHNOLOGY, BY DEPLOYMENT TYPE, 2024 TO 2035 (USD Million)
    14. 6.14 INFORMATION AND COMMUNICATIONS TECHNOLOGY, BY END USER, 2024 (% SHARE)
    15. 6.15 INFORMATION AND COMMUNICATIONS TECHNOLOGY, BY END USER, 2024 TO 2035 (USD Million)
    16. 6.16 INFORMATION AND COMMUNICATIONS TECHNOLOGY, BY FEATURES, 2024 (% SHARE)
    17. 6.17 INFORMATION AND COMMUNICATIONS TECHNOLOGY, BY FEATURES, 2024 TO 2035 (USD Million)
    18. 6.18 INFORMATION AND COMMUNICATIONS TECHNOLOGY, BY APPLICATION, 2024 (% SHARE)
    19. 6.19 INFORMATION AND COMMUNICATIONS TECHNOLOGY, BY APPLICATION, 2024 TO 2035 (USD Million)
    20. 6.20 BENCHMARKING OF MAJOR COMPETITORS
  7. 7 LIST OF TABLES
    1. 7.1 LIST OF ASSUMPTIONS
  8. 7.1.1
    1. 7.2 Canada MARKET SIZE ESTIMATES; FORECAST
      1. 7.2.1 BY DEPLOYMENT TYPE, 2025-2035 (USD Million)
      2. 7.2.2 BY END USER, 2025-2035 (USD Million)
      3. 7.2.3 BY FEATURES, 2025-2035 (USD Million)
      4. 7.2.4 BY APPLICATION, 2025-2035 (USD Million)
    2. 7.3 PRODUCT LAUNCH/PRODUCT DEVELOPMENT/APPROVAL
  9. 7.3.1
    1. 7.4 ACQUISITION/PARTNERSHIP
  10. 7.4.1

Canada Canada Route Optimization Software Market Segmentation

Canada Route Optimization Software Market By Deployment Type (USD Million, 2025-2035)
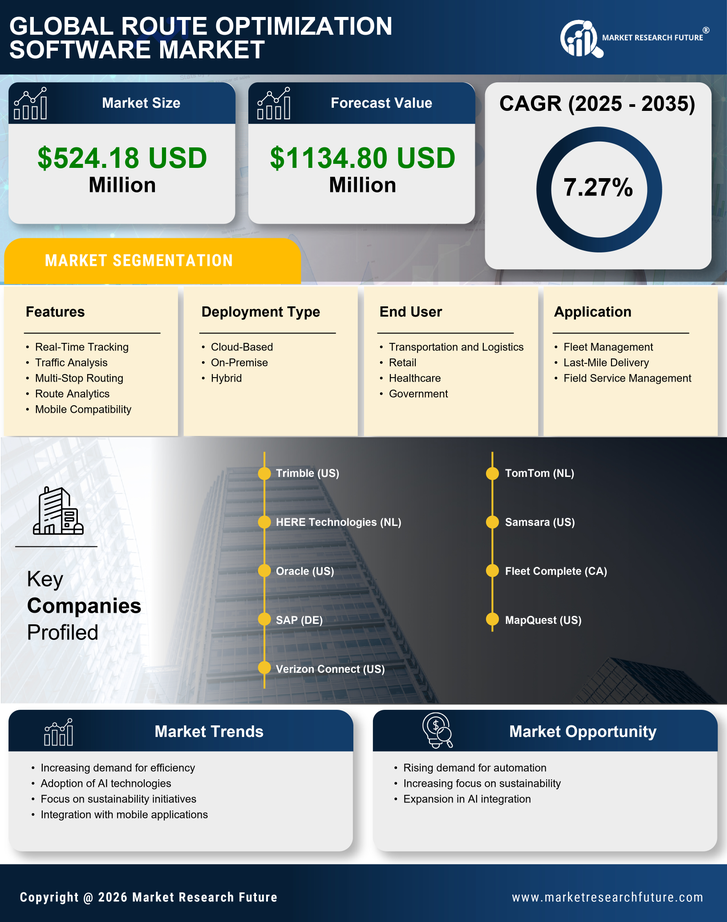
  • Cloud-Based
  • On-Premise
  • Hybrid

Canada Route Optimization Software Market By End User (USD Million, 2025-2035)

  • Transportation and Logistics
  • Retail
  • Healthcare
  • Government

Canada Route Optimization Software Market By Features (USD Million, 2025-2035)

  • Real-Time Tracking
  • Traffic Analysis
  • Multi-Stop Routing
  • Route Analytics
  • Mobile Compatibility

Canada Route Optimization Software Market By Application (USD Million, 2025-2035)

  • Fleet Management
  • Last-Mile Delivery
  • Field Service Management