Request Free Sample ×

Kindly complete the form below to receive a free sample of this Report

* Please use a valid business email

Leading companies partner with us for data-driven Insights

clients tt-cursor
Hero Background

Canada Functional Beverages Market

ID: MRFR/FnB/44726-HCR
200 Pages
Snehal Singh
Last Updated: April 06, 2026

Canada Functional Beverages Market Size, Share, Industry Trend & Analysis Research Report: By Type (Energy Drinks, Sports Beverages), By Function (HealthWellness, Weight Management) and By Distribution Channel (Store, Non-store)- Forecast to 2035

Share:
Download PDF ×

We do not share your information with anyone. However, we may send you emails based on your report interest from time to time. You may contact us at any time to opt-out.

Canada Functional Beverages Market Infographic
Purchase Options
  1. 1 SECTION I: EXECUTIVE SUMMARY AND KEY HIGHLIGHTS
  2.   1.1 EXECUTIVE SUMMARY
  3.     1.1.1 Market Overview
  4.     1.1.2 Key Findings
  5.     1.1.3 Market Segmentation
  6.     1.1.4 Competitive Landscape
  7.     1.1.5 Challenges and Opportunities
  8.     1.1.6 Future Outlook
  9. 2 SECTION II: SCOPING, METHODOLOGY AND MARKET STRUCTURE
  10.   2.1 MARKET INTRODUCTION
  11.     2.1.1 Definition
  12.     2.1.2 Scope of the study
  13.       2.1.2.1 Research Objective
  14.       2.1.2.2 Assumption
  15.       2.1.2.3 Limitations
  16.   2.2 RESEARCH METHODOLOGY
  17.     2.2.1 Overview
  18.     2.2.2 Data Mining
  19.     2.2.3 Secondary Research
  20.     2.2.4 Primary Research
  21.       2.2.4.1 Primary Interviews and Information Gathering Process
  22.       2.2.4.2 Breakdown of Primary Respondents
  23.     2.2.5 Forecasting Model
  24.     2.2.6 Market Size Estimation
  25.       2.2.6.1 Bottom-Up Approach
  26.       2.2.6.2 Top-Down Approach
  27.     2.2.7 Data Triangulation
  28.     2.2.8 Validation
  29. 3 SECTION III: QUALITATIVE ANALYSIS
  30.   3.1 MARKET DYNAMICS
  31.     3.1.1 Overview
  32.     3.1.2 Drivers
  33.     3.1.3 Restraints
  34.     3.1.4 Opportunities
  35.   3.2 MARKET FACTOR ANALYSIS
  36.     3.2.1 Value chain Analysis
  37.     3.2.2 Porter's Five Forces Analysis
  38.       3.2.2.1 Bargaining Power of Suppliers
  39.       3.2.2.2 Bargaining Power of Buyers
  40.       3.2.2.3 Threat of New Entrants
  41.       3.2.2.4 Threat of Substitutes
  42.       3.2.2.5 Intensity of Rivalry
  43.     3.2.3 COVID-19 Impact Analysis
  44.       3.2.3.1 Market Impact Analysis
  45.       3.2.3.2 Regional Impact
  46.       3.2.3.3 Opportunity and Threat Analysis
  47. 4 SECTION IV: QUANTITATIVE ANALYSIS
  48.   4.1 Construction, BY Type (USD Billion)
  49.     4.1.1 Energy Drinks
  50.     4.1.2 Sports Drinks
  51.     4.1.3 Nutraceutical Drinks
  52.     4.1.4 Functional Water
  53.     4.1.5 Tea-based Beverages
  54.   4.2 Construction, BY Target Audience (USD Billion)
  55.     4.2.1 Athletes
  56.     4.2.2 Health-conscious Consumers
  57.     4.2.3 Fitness Enthusiasts
  58.     4.2.4 Busy Professionals
  59.     4.2.5 Elderly
  60.   4.3 Construction, BY Distribution Channel (USD Billion)
  61.     4.3.1 Supermarkets and Hypermarkets
  62.     4.3.2 Convenience Stores
  63.     4.3.3 Online Retail
  64.     4.3.4 Health and Wellness Stores
  65.     4.3.5 Specialty Stores
  66.   4.4 Construction, BY Ingredient Type (USD Billion)
  67.     4.4.1 Vitamins
  68.     4.4.2 Herbal Extracts
  69.     4.4.3 Amino Acids
  70.     4.4.4 Probiotics
  71.     4.4.5 Electrolytes
  72. 5 SECTION V: COMPETITIVE ANALYSIS
  73.   5.1 Competitive Landscape
  74.     5.1.1 Overview
  75.     5.1.2 Competitive Analysis
  76.     5.1.3 Market share Analysis
  77.     5.1.4 Major Growth Strategy in the Construction
  78.     5.1.5 Competitive Benchmarking
  79.     5.1.6 Leading Players in Terms of Number of Developments in the Construction
  80.     5.1.7 Key developments and growth strategies
  81.       5.1.7.1 New Product Launch/Service Deployment
  82.       5.1.7.2 Merger & Acquisitions
  83.       5.1.7.3 Joint Ventures
  84.     5.1.8 Major Players Financial Matrix
  85.       5.1.8.1 Sales and Operating Income
  86.       5.1.8.2 Major Players R&D Expenditure. 2023
  87.   5.2 Company Profiles
  88.     5.2.1 PepsiCo (US)
  89.       5.2.1.1 Financial Overview
  90.       5.2.1.2 Products Offered
  91.       5.2.1.3 Key Developments
  92.       5.2.1.4 SWOT Analysis
  93.       5.2.1.5 Key Strategies
  94.     5.2.2 Coca-Cola (US)
  95.       5.2.2.1 Financial Overview
  96.       5.2.2.2 Products Offered
  97.       5.2.2.3 Key Developments
  98.       5.2.2.4 SWOT Analysis
  99.       5.2.2.5 Key Strategies
  100.     5.2.3 Nestle (CH)
  101.       5.2.3.1 Financial Overview
  102.       5.2.3.2 Products Offered
  103.       5.2.3.3 Key Developments
  104.       5.2.3.4 SWOT Analysis
  105.       5.2.3.5 Key Strategies
  106.     5.2.4 Monster Beverage (US)
  107.       5.2.4.1 Financial Overview
  108.       5.2.4.2 Products Offered
  109.       5.2.4.3 Key Developments
  110.       5.2.4.4 SWOT Analysis
  111.       5.2.4.5 Key Strategies
  112.     5.2.5 Red Bull (AT)
  113.       5.2.5.1 Financial Overview
  114.       5.2.5.2 Products Offered
  115.       5.2.5.3 Key Developments
  116.       5.2.5.4 SWOT Analysis
  117.       5.2.5.5 Key Strategies
  118.     5.2.6 Danone (FR)
  119.       5.2.6.1 Financial Overview
  120.       5.2.6.2 Products Offered
  121.       5.2.6.3 Key Developments
  122.       5.2.6.4 SWOT Analysis
  123.       5.2.6.5 Key Strategies
  124.     5.2.7 Kraft Heinz (US)
  125.       5.2.7.1 Financial Overview
  126.       5.2.7.2 Products Offered
  127.       5.2.7.3 Key Developments
  128.       5.2.7.4 SWOT Analysis
  129.       5.2.7.5 Key Strategies
  130.     5.2.8 Unilever (GB)
  131.       5.2.8.1 Financial Overview
  132.       5.2.8.2 Products Offered
  133.       5.2.8.3 Key Developments
  134.       5.2.8.4 SWOT Analysis
  135.       5.2.8.5 Key Strategies
  136.     5.2.9 Reed's (US)
  137.       5.2.9.1 Financial Overview
  138.       5.2.9.2 Products Offered
  139.       5.2.9.3 Key Developments
  140.       5.2.9.4 SWOT Analysis
  141.       5.2.9.5 Key Strategies
  142.   5.3 Appendix
  143.     5.3.1 References
  144.     5.3.2 Related Reports
  145. 6 LIST OF FIGURES
  146.   6.1 MARKET SYNOPSIS
  147.   6.2 CANADA MARKET ANALYSIS BY TYPE
  148.   6.3 CANADA MARKET ANALYSIS BY TARGET AUDIENCE
  149.   6.4 CANADA MARKET ANALYSIS BY DISTRIBUTION CHANNEL
  150.   6.5 CANADA MARKET ANALYSIS BY INGREDIENT TYPE
  151.   6.6 KEY BUYING CRITERIA OF CONSTRUCTION
  152.   6.7 RESEARCH PROCESS OF MRFR
  153.   6.8 DRO ANALYSIS OF CONSTRUCTION
  154.   6.9 DRIVERS IMPACT ANALYSIS: CONSTRUCTION
  155.   6.10 RESTRAINTS IMPACT ANALYSIS: CONSTRUCTION
  156.   6.11 SUPPLY / VALUE CHAIN: CONSTRUCTION
  157.   6.12 CONSTRUCTION, BY TYPE, 2024 (% SHARE)
  158.   6.13 CONSTRUCTION, BY TYPE, 2024 TO 2035 (USD Billion)
  159.   6.14 CONSTRUCTION, BY TARGET AUDIENCE, 2024 (% SHARE)
  160.   6.15 CONSTRUCTION, BY TARGET AUDIENCE, 2024 TO 2035 (USD Billion)
  161.   6.16 CONSTRUCTION, BY DISTRIBUTION CHANNEL, 2024 (% SHARE)
  162.   6.17 CONSTRUCTION, BY DISTRIBUTION CHANNEL, 2024 TO 2035 (USD Billion)
  163.   6.18 CONSTRUCTION, BY INGREDIENT TYPE, 2024 (% SHARE)
  164.   6.19 CONSTRUCTION, BY INGREDIENT TYPE, 2024 TO 2035 (USD Billion)
  165.   6.20 BENCHMARKING OF MAJOR COMPETITORS
  166. 7 LIST OF TABLES
  167.   7.1 LIST OF ASSUMPTIONS
  168.     7.1.1
  169.   7.2 Canada MARKET SIZE ESTIMATES; FORECAST
  170.     7.2.1 BY TYPE, 2025-2035 (USD Billion)
  171.     7.2.2 BY TARGET AUDIENCE, 2025-2035 (USD Billion)
  172.     7.2.3 BY DISTRIBUTION CHANNEL, 2025-2035 (USD Billion)
  173.     7.2.4 BY INGREDIENT TYPE, 2025-2035 (USD Billion)
  174.   7.3 PRODUCT LAUNCH/PRODUCT DEVELOPMENT/APPROVAL
  175.     7.3.1
  176.   7.4 ACQUISITION/PARTNERSHIP
  177.     7.4.1

Canada Construction Market Segmentation

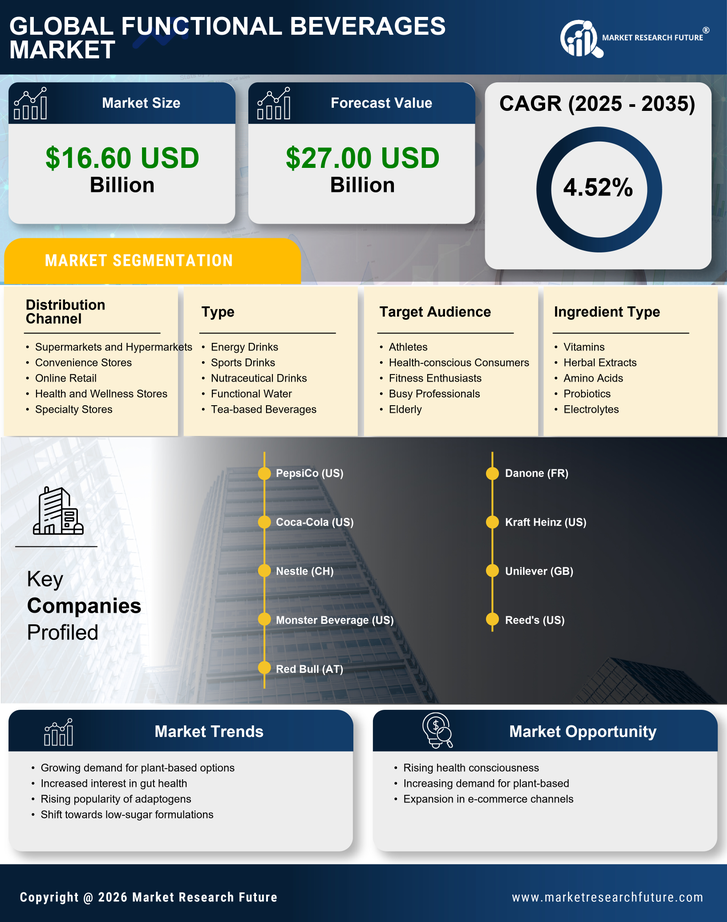
Construction By Type (USD Billion, 2025-2035)

  • Energy Drinks
  • Sports Drinks
  • Nutraceutical Drinks
  • Functional Water
  • Tea-based Beverages

Construction By Target Audience (USD Billion, 2025-2035)

  • Athletes
  • Health-conscious Consumers
  • Fitness Enthusiasts
  • Busy Professionals
  • Elderly

Construction By Distribution Channel (USD Billion, 2025-2035)

  • Supermarkets and Hypermarkets
  • Convenience Stores
  • Online Retail
  • Health and Wellness Stores
  • Specialty Stores

Construction By Ingredient Type (USD Billion, 2025-2035)

  • Vitamins
  • Herbal Extracts
  • Amino Acids
  • Probiotics
  • Electrolytes

Compare Licence

×
Features License Type
Single User Multiuser License Enterprise User
Price $4,950 $5,950 $7,250
Maximum User Access Limit 1 User Upto 10 Users Unrestricted Access Throughout the Organization
Free Customization
Direct Access to Analyst
Deliverable Format
Platform Access
Discount on Next Purchase 10% 15% 15%
Printable Versions