ID: MRFR/Pharma/0908-HCR | February 2021 | Region: Global | 85 Pages
Table of Contents
1. REPORT PROLOGUE
2. MARKET INTRODUCTION
2.1. Definition
2.2. Scope of the Study
2.2.1. Research Objective
2.2.2. Assumptions
2.2.3. Limitations
3. RESEARCH METHODOLOGY
3.1. Overview
3.2. Primary Research
3.3. Secondary Research
3.4. Market Size Estimation
4. MARKET DYNAMICS
4.1. Overview
4.2. Drivers
4.3. Restraints
4.4. Opportunities
5. MARKET FACTOR ANALYSIS
5.1. Porter’s Five Forces Analysis
5.1.1. Bargaining Power of Suppliers
5.1.2. Bargaining Power of Buyers
5.1.3. Threat of New Entrants
5.1.4. Threat of Substitutes
5.1.5. Intensity of Rivalry
5.2. Value Chain Analysis
 
6. GLOBAL BULIMIA NERVOSA MARKET, BY DISORDER TYPE
6.1. Overview
6.2. Purging
Market Estimates & Forecast, by Region, 2020-2027
Market Estimates & Forecast, by Country, 2020-2027
6.3. Non-Purging
Market Estimates & Forecast, by Region, 2020-2027
Market Estimates & Forecast, by Country, 2020-2027
7. GLOBAL BULIMIA NERVOSA MARKET, BY DRUG TYPE
7.1. Overview
7.2. Antidepressants
Market Estimates & Forecast, by Region, 2020-2027
Market Estimates & Forecast, by Country, 2020-2027
7.3. Antipsychotics
Market Estimates & Forecast, by Region, 2020-2027
Market Estimates & Forecast, by Country, 2020-2027
7.4. Others
Market Estimates & Forecast, by Region, 2020-2027
Market Estimates & Forecast, by Country, 2020-2027
8. GLOBAL BULIMIA NERVOSA MARKET, BY ROUTE OF ADMINISTRATION
8.1. Overview
8.2. Oral
Market Estimates & Forecast, by Region, 2020-2027
Market Estimates & Forecast, by Country, 2020-2027
8.3. Intravenous
Market Estimates & Forecast, by Region, 2020-2027
Market Estimates & Forecast, by Country, 2020-2027
8.4. Others
Market Estimates & Forecast, by Region, 2020-2027
Market Estimates & Forecast, by Country, 2020-2027
9. GLOBAL BULIMIA NERVOSA MARKET, BY END USER
9.1. Overview
9.2. Hospitals & Clinics
Market Estimates & Forecast, by Region, 2020-2027
Market Estimates & Forecast, by Country, 2020-2027
9.3. Homecare Settings
Market Estimates & Forecast, by Region, 2020-2027
Market Estimates & Forecast, by Country, 2020-2027
9.4. Specialty Centers
Market Estimates & Forecast, by Region, 2020-2027
Market Estimates & Forecast, by Country, 2020-2027
9.5. Others
Market Estimates & Forecast, by Region, 2020-2027
Market Estimates & Forecast, by Country, 2020-2027
10. GLOBAL BULIMIA NERVOSA MARKET, BY REGION
10.1. Overview
10.2. Americas
10.2.1. North America
10.2.1.1. US
10.2.1.2. Canada
10.2.2. Latin America
10.3. Europe
10.3.1. Western Europe
10.3.1.1. Germany
10.3.1.2. France
10.3.1.3. Italy
10.3.1.4. Spain
10.3.1.5. UK
10.3.1.6. Rest of Western Europe
10.3.2. Eastern Europe
10.4. Asia-Pacific
10.4.1. Japan
10.4.2. China
10.4.3. India
10.4.4. Australia
10.4.5. South Korea
10.4.6. Rest of Asia-Pacific
10.5. Middle East & Africa
10.5.1. Middle East
10.5.2. Africa
11. COMPANY LANDSCAPE
11.1. Overview
11.2. Competitive Analysis
11.3. Market Share Analysis
11.4. Major Growth Strategies in the Global Bulimia Nervosa Market
11.5. Competitive Benchmarking
11.6. Leading Players in Terms of Number of Developments in the Global Bulimia Nervosa Market
11.7. Key Developments and Growth Strategies
11.7.1. Product Launch/Service Deployment
11.7.2. Mergers and Acquisitions
11.7.3. Joint Ventures
11.8. Major Players Financial Matrix & Market Ratio
11.8.1. Sales & Operating Income 2020
11.8.2. Major Players R&D Expenditure 2020
11.9. Major Players Capital Market Ratio
12. COMPANY PROFILES
12.1. Allergan, Inc.
12.1.1. Company Overview
12.1.2. Product Overview
12.1.3. Financial Overview
12.1.4. Key Developments
12.1.5. SWOT Analysis
12.1.6. Key Strategies
12.2. Eli Lilly and Company
12.2.1. Company Overview
12.2.2. Product Overview
12.2.3. Financial Overview
12.2.4. Key Developments
12.2.5. SWOT Analysis
12.2.6. Key Strategies
12.3. AstraZeneca
12.3.1. Company Overview
12.3.2. Product Overview
12.3.3. Financial Overview
12.3.4. Key Developments
12.3.5. SWOT Analysis
12.3.6. Key Strategies
12.4. Bristol-Myers Squibb Company
12.4.1. Company Overview
12.4.2. Product Overview
12.4.3. Financial Overview
12.4.4. Key Developments
12.4.5. SWOT Analysis
12.4.6. Key Strategies
12.5. GlaxoSmithKline plc
12.5.1. Company Overview
12.5.2. Product Overview
12.5.3. Financial Overview
12.5.4. Key Developments
12.5.5. SWOT Analysis
12.5.6. Key Strategies
12.6. Pfizer Inc.
12.6.1. Company Overview
12.6.2. Product Overview
12.6.3. Financial Overview
12.6.4. Key Developments
12.6.5. SWOT Analysis
12.6.6. Key Strategies
12.7. Johnson & Johnson Services, Inc.
12.7.1. Company Overview
12.7.2. Product Overview
12.7.3. Financial Overview
12.7.4. Key Developments
12.7.5. SWOT Analysis
12.7.6. Key Strategies
12.8. Dr. Reddy’s Laboratories Limited
12.8.1. Company Overview
12.8.2. Product Overview
12.8.3. Financial Overview
12.8.4. Key Developments
12.8.5. SWOT Analysis
12.8.6. Key Strategies
12.9. Lupin Pharmaceuticals, Inc.
12.9.1. Company Overview
12.9.2. Product Overview
12.9.3. Financial Overview
12.9.4. Key Developments
12.9.5. SWOT Analysis
12.9.6. Key Strategies
12.10. Aurobindo Pharma
12.10.1. Company Overview
12.10.2. Product Overview
12.10.3. Financial Overview
12.10.4. Key Developments
12.10.5. SWOT Analysis
12.10.6. Key Strategies
12.11. Zydus Cadila
12.11.1. Company Overview
12.11.2. Product Overview
12.11.3. Financial Overview
12.11.4. Key Developments
12.11.5. SWOT Analysis
12.11.6. Key Strategies
12.12. Apotex Inc.
12.12.1. Company Overview
12.12.2. Product Overview
12.12.3. Financial Overview
12.12.4. Key Developments
12.12.5. SWOT Analysis
12.12.6. Key Strategies
12.13. Teva Pharmaceutical Industries Ltd
12.13.1. Company Overview
12.13.2. Product Overview
12.13.3. Financial Overview
12.13.4. Key Developments
12.13.5. SWOT Analysis
12.13.6. Key Strategies
12.14. Sun Pharmaceutical Industries Ltd
12.14.1. Company Overview
12.14.2. Product Overview
12.14.3. Financial Overview
12.14.4. Key Developments
12.14.5. SWOT Analysis
12.14.6. Key Strategies
12.15. Others
13. APPENDIX
13.1. References
13.2. Related Reports
 
LIST OF TABLES
TABLE 1 GLOBAL BULIMIA NERVOSA MARKET SYNOPSIS, 2020-2027
TABLE 2 GLOBAL BULIMIA NERVOSA MARKET ESTIMATES & FORECAST, 2020-2027 (USD MILLION)
TABLE 3 GLOBAL BULIMIA NERVOSA MARKET, BY DISORDER TYPE, 2020-2027 (USD MILLION)
TABLE 4 GLOBAL BULIMIA NERVOSA MARKET, BY DRUG TYPE, 2020-2027 (USD MILLION)
TABLE 5 GLOBAL BULIMIA NERVOSA MARKET, BY ROUTE OF ADMINISTRATION, 2020-2027 (USD MILLION)
TABLE 6 GLOBAL BULIMIA NERVOSA MARKET, BY END USER, 2020-2027 (USD MILLION)
TABLE 7 GLOBAL BULIMIA NERVOSA MARKET, BY REGION, 2020-2027 (USD MILLION)
TABLE 8 NORTH AMERICA: BULIMIA NERVOSA MARKET, BY DISORDER TYPE, 2020-2027 (USD MILLION)
TABLE 9 NORTH AMERICA: BULIMIA NERVOSA MARKET, BY DRUG TYPE, 2020-2027 (USD MILLION)
TABLE 10 NORTH AMERICA: BULIMIA NERVOSA MARKET, BY ROUTE OF ADMINISTRATION, 2020-2027 (USD MILLION)
TABLE 11 NORTH AMERICA: BULIMIA NERVOSA MARKET, BY END USER, 2020-2027 (USD MILLION)
TABLE 12 US: BULIMIA NERVOSA MARKET, BY DISORDER TYPE, 2020-2027 (USD MILLION)
TABLE 13 US: BULIMIA NERVOSA MARKET, BY DRUG TYPE, 2020-2027 (USD MILLION)
TABLE 14 US: BULIMIA NERVOSA MARKET, BY ROUTE OF ADMINISTRATION, 2020-2027 (USD MILLION)
TABLE 15 US: BULIMIA NERVOSA MARKET, BY END USER, 2020-2027 (USD MILLION)
TABLE 16 CANADA: BULIMIA NERVOSA MARKET, BY DISORDER TYPE, 2020-2027 (USD MILLION)
TABLE 17 CANADA: BULIMIA NERVOSA MARKET, BY DRUG TYPE, 2020-2027 (USD MILLION)
TABLE 18 CANADA: BULIMIA NERVOSA MARKET, BY ROUTE OF ADMINISTRATION, 2020-2027 (USD MILLION)
TABLE 19 CANADA: BULIMIA NERVOSA MARKET, BY END USER, 2020-2027 (USD MILLION)
TABLE 20 LATIN AMERICA: BULIMIA NERVOSA MARKET, BY DISORDER TYPE, 2020-2027 (USD MILLION)
TABLE 21 LATIN AMERICA: BULIMIA NERVOSA MARKET, BY DRUG TYPE, 2020-2027 (USD MILLION)
TABLE 22 LATIN AMERICA: BULIMIA NERVOSA MARKET, BY ROUTE OF ADMINISTRATION, 2020-2027 (USD MILLION)
TABLE 23 LATIN AMERICA: BULIMIA NERVOSA MARKET, BY END USER, 2020-2027 (USD MILLION)
TABLE 24 EUROPE: BULIMIA NERVOSA MARKET, BY DISORDER TYPE, 2020-2027 (USD MILLION)
TABLE 25 EUROPE: BULIMIA NERVOSA MARKET, BY DRUG TYPE, 2020-2027 (USD MILLION)
TABLE 26 EUROPE: BULIMIA NERVOSA MARKET, BY ROUTE OF ADMINISTRATION, 2020-2027 (USD MILLION)
TABLE 27 EUROPE: BULIMIA NERVOSA MARKET, BY END USER, 2020-2027 (USD MILLION)
TABLE 28 WESTERN EUROPE: BULIMIA NERVOSA MARKET, BY DISORDER TYPE, 2020-2027 (USD MILLION)
TABLE 29 WESTERN EUROPE: BULIMIA NERVOSA MARKET, BY DRUG TYPE, 2020-2027 (USD MILLION)
TABLE 30 WESTERN EUROPE: BULIMIA NERVOSA MARKET, BY ROUTE OF ADMINISTRATION, 2020-2027 (USD MILLION)
TABLE 31 WESTERN EUROPE: BULIMIA NERVOSA MARKET, BY END USER, 2020-2027 (USD MILLION)
TABLE 32 EASTERN EUROPE: BULIMIA NERVOSA MARKET, BY DISORDER TYPE, 2020-2027 (USD MILLION)
TABLE 33 EASTERN EUROPE: BULIMIA NERVOSA MARKET, BY DRUG TYPE, 2020-2027 (USD MILLION)
TABLE 34 EASTERN EUROPE: BULIMIA NERVOSA MARKET, BY ROUTE OF ADMINISTRATION, 2020-2027 (USD MILLION)
TABLE 35 EASTERN EUROPE: BULIMIA NERVOSA MARKET, BY END USER, 2020-2027 (USD MILLION)
TABLE 36 ASIA-PACIFIC: BULIMIA NERVOSA MARKET, BY DISORDER TYPE, 2020-2027 (USD MILLION)
TABLE 37 ASIA-PACIFIC: BULIMIA NERVOSA MARKET, BY DRUG TYPE, 2020-2027 (USD MILLION)
TABLE 38 ASIA-PACIFIC: BULIMIA NERVOSA MARKET, BY ROUTE OF ADMINISTRATION, 2020-2027 (USD MILLION)
TABLE 39 ASIA-PACIFIC: BULIMIA NERVOSA MARKET, BY END USER, 2020-2027 (USD MILLION)
TABLE 40 MIDDLE EAST & AFRICA: BULIMIA NERVOSA MARKET, BY DISORDER TYPE, 2020-2027 (USD MILLION)
TABLE 41 MIDDLE EAST & AFRICA: BULIMIA NERVOSA MARKET, BY DRUG TYPE, 2020-2027 (USD MILLION)
TABLE 42 MIDDLE EAST & AFRICA: BULIMIA NERVOSA MARKET, BY ROUTE OF ADMINISTRATION, 2020-2027 (USD MILLION)
TABLE 43 MIDDLE EAST & AFRICA: BULIMIA NERVOSA MARKET, BY END USER, 2020-2027 (USD MILLION)
 
LIST OF FIGURES
FIGURE 1 RESEARCH PROCESS
FIGURE 2 MARKET STRUCTURE OF THE GLOBAL BULIMIA NERVOSA MARKET
FIGURE 3 MARKET DYNAMICS OF THE GLOBAL BULIMIA NERVOSA MARKET
FIGURE 4 GLOBAL BULIMIA NERVOSA MARKET SHARE, BY DISORDER TYPE, 2020 (%)
FIGURE 5 GLOBAL BULIMIA NERVOSA MARKET SHARE, BY DRUG TYPE, 2020 (%)
FIGURE 6 GLOBAL BULIMIA NERVOSA MARKET SHARE, BY ROUTE OF ADMINISTRATION, 2020 (%)
FIGURE 7 GLOBAL BULIMIA NERVOSA MARKET SHARE, BY END USER, 2020 (%)
FIGURE 8 GLOBAL BULIMIA NERVOSA MARKET SHARE, BY REGION, 2020 (%)
FIGURE 7 AMERICAS: BULIMIA NERVOSA MARKET SHARE BY REGION, 2020 (%)
FIGURE 9 NORTH AMERICA: BULIMIA NERVOSA MARKET SHARE, BY COUNTRY, 2020 (%)
FIGURE 10 EUROPE: BULIMIA NERVOSA MARKET SHARE, BY REGION, 2020 (%)
FIGURE 11 WESTERN EUROPE: BULIMIA NERVOSA MARKET SHARE, BY COUNTRY, 2020 (%)
FIGURE 12 ASIA-PACIFIC: BULIMIA NERVOSA MARKET SHARE, BY COUNTRY, 2020 (%)
FIGURE 13 MIDDLE EAST & AFRICA: BULIMIA NERVOSA MARKET SHARE, BY COUNTRY, 2020 (%)
FIGURE 14 GLOBAL BULIMIA NERVOSA MARKET: COMPANY SHARE ANALYSIS, 2020 (%)
FIGURE 15 ALLERGAN, INC..: KEY FINANCIALS
FIGURE 16 ALLERGAN, INC.: SEGMENTAL REVENUE
FIGURE 17 ALLERGAN, INC.: REGIONAL REVENUE
FIGURE 18 ELI LILLY AND COMPANY: KEY FINANCIALS
FIGURE 19 ELI LILLY AND COMPANY: SEGMENTAL REVENUE
FIGURE 20 ELI LILLY AND COMPANY: REGIONAL REVENUE
FIGURE 21 ASTRAZENECA: KEY FINANCIALS
FIGURE 22 ASTRAZENECA: SEGMENTAL REVENUE
FIGURE 23 ASTRAZENECA: REGIONAL REVENUE
FIGURE 24 BRISTOL-MYERS SQUIBB COMPANY: KEY FINANCIALS
FIGURE 25 BRISTOL-MYERS SQUIBB COMPANY: SEGMENTAL REVENUE
FIGURE 26 BRISTOL-MYERS SQUIBB COMPANY: REGIONAL REVENUE
FIGURE 27 GLAXOSMITHKLINE PLC: KEY FINANCIALS
FIGURE 28 GLAXOSMITHKLINE PLC: SEGMENTAL REVENUE
FIGURE 29 GLAXOSMITHKLINE PLC: REGIONAL REVENUE
FIGURE 30 PFIZER INC.: KEY FINANCIALS
FIGURE 31 PFIZER INC.: SEGMENTAL REVENUE
FIGURE 32 PFIZER INC.: REGIONAL REVENUE
FIGURE 33 JOHNSON & JOHNSON SERVICES, INC.: KEY FINANCIALS
FIGURE 34 JOHNSON & JOHNSON SERVICES, INC.: SEGMENTAL REVENUE
FIGURE 35 JOHNSON & JOHNSON SERVICES, INC.: REGIONAL REVENUE
FIGURE 36 DR. REDDY’S LABORATORIES LIMITED: KEY FINANCIALS
FIGURE 37 DR. REDDY’S LABORATORIES LIMITED: SEGMENTAL REVENUE
FIGURE 38 DR. REDDY’S LABORATORIES LIMITED: REGIONAL REVENUE
FIGURE 39 LUPIN PHARMACEUTICALS, INC.: KEY FINANCIALS
FIGURE 40 LUPIN PHARMACEUTICALS, INC.: SEGMENTAL REVENUE
FIGURE 41 LUPIN PHARMACEUTICALS, INC.: REGIONAL REVENUE
FIGURE 42 AUROBINDO PHARMA: KEY FINANCIALS
FIGURE 43 AUROBINDO PHARMA: SEGMENTAL REVENUE
FIGURE 44 AUROBINDO PHARMA: REGIONAL REVENUE
FIGURE 45 ZYDUS CADILA: KEY FINANCIALS
FIGURE 46 ZYDUS CADILA: SEGMENTAL REVENUE
FIGURE 47 ZYDUS CADILA: REGIONAL REVENUE
FIGURE 48 APOTEX INC.: KEY FINANCIALS
FIGURE 49 APOTEX INC.: SEGMENTAL REVENUE
FIGURE 50 APOTEX INC.: REGIONAL REVENUE
FIGURE 51 TEVA PHARMACEUTICAL INDUSTRIES LTD: KEY FINANCIALS
FIGURE 52 TEVA PHARMACEUTICAL INDUSTRIES LTD: SEGMENTAL REVENUE
FIGURE 53 TEVA PHARMACEUTICAL INDUSTRIES LTD: REGIONAL REVENUE
FIGURE 54 SUN PHARMACEUTICAL INDUSTRIES LTD: KEY FINANCIALS
FIGURE 55 SUN PHARMACEUTICAL INDUSTRIES LTD: SEGMENTAL REVENUE
FIGURE 56 SUN PHARMACEUTICAL INDUSTRIES LTD: REGIONAL REVENUE
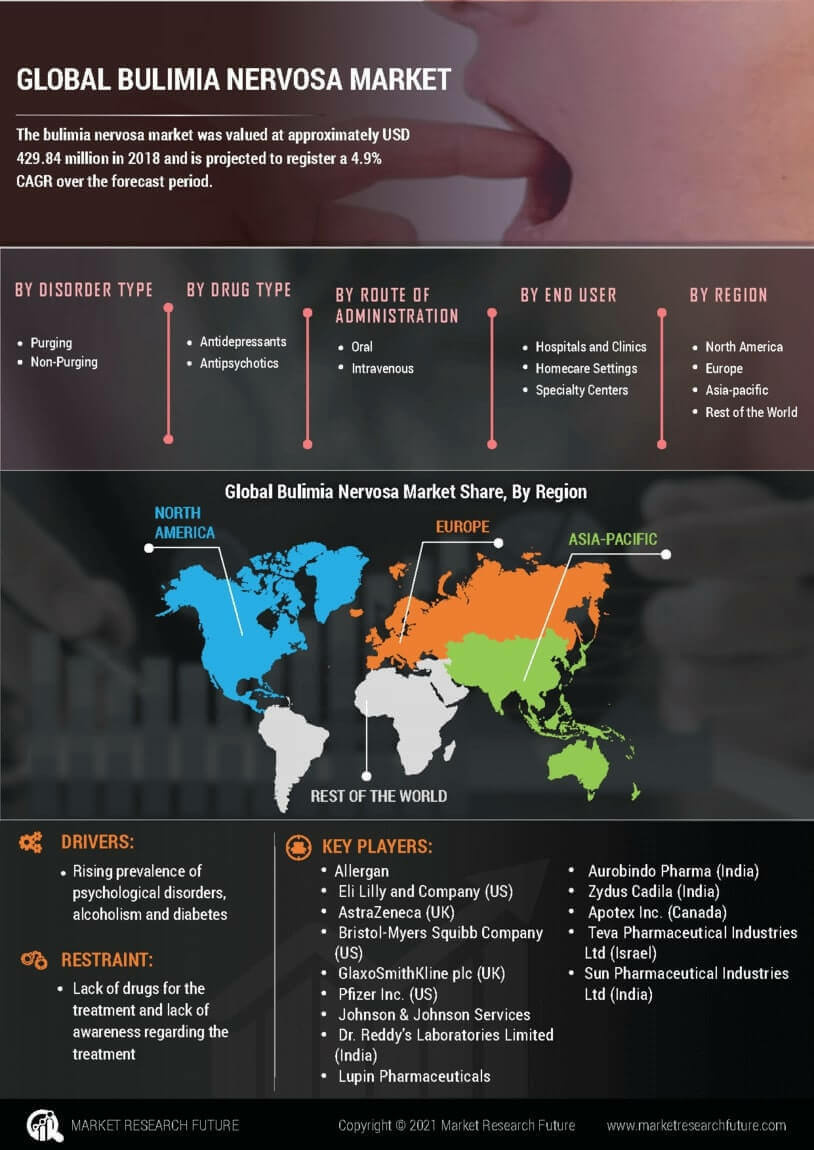
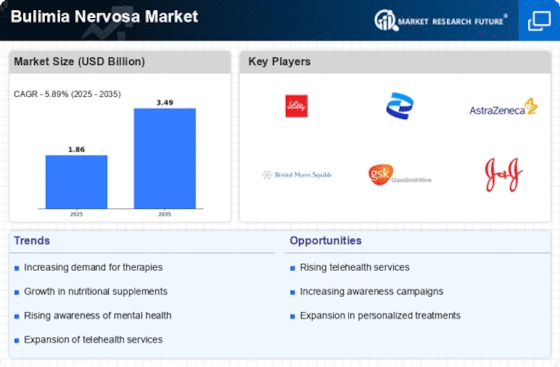
The bulimia nervosa market is expected to exhibit significant growth over the forecast period. The market was valued at approximately USD 429.84 million in 2018 and is projected to register a 4.9% CAGR over the forecast period. Bulimia nervosa is an eating disorder that is characterized by eating a large amount of food (binge eating) in a short period. The disorder is also known as bulimia. Bulimia nervosa may cause various life-threatening and serious complications, such as heart problems, tooth & gum decay, anxiety, self-injury, dehydration, and digestive problems. Factors such as the rising prevalence of psychological disorders, alcoholism, and diabetes are expected to drive market growth. According to an article published by the National Alliance on Mental Illness (NAMI), 19.1% adults in the US experienced mental illness in 2018. Moreover, drastically changing lifestyle is also expected to boost market growth. However, factors such as the lack of drugs specifically for the treatment of bulimia nervosa and lack of awareness regarding the treatment options are expected to hamper the market growth.
Segmentation
The bulimia nervosa market has been segmented into disorder type, drug type, route of administration, end user, and region. Based on disorder type, the bulimia nervosa market has been divided into purging and non-purging. The bulimia nervosa market, by drug type, has been segmented into antidepressants, antipsychotics, and others. Based on route of administration, the bulimia nervosa market is segmented into oral, intravenous, and others. The bulimia nervosa market, by end user, has been segmented into hospitals & clinics, home care settings, specialty centers, and others. The market has been segmented, by region, into the Americas, Europe, Asia-Pacific, and the Middle East & Africa. The bulimia nervosa market in the Americas has further been segmented into North America and Latin America, with the North American market divided into the US and Canada. The European bulimia nervosa market has been segmented into Western Europe and Eastern Europe. The market in Western Europe has further been classified as France, Germany, Spain, the UK, Italy, and the rest of Western Europe. The bulimia nervosa market in Asia-Pacific has been segmented into Japan, China, India, South Korea, Australia, and the rest of Asia-Pacific. The Middle East & Africa bulimia nervosa market is segmented into the Middle East and Africa.
Key Players
Allergan, Inc. (Ireland), Eli Lilly and Company (US), AstraZeneca (UK), Bristol-Myers Squibb Company (US), GlaxoSmithKline plc (UK), Pfizer Inc. (US), Johnson & Johnson Services, Inc. (US), Dr. Reddy’s Laboratories Limited (India), Lupin Pharmaceuticals, Inc. (India), Aurobindo Pharma (India), Zydus Cadila (India), Apotex Inc. (Canada), Teva Pharmaceutical Industries Ltd (Israel) and Sun Pharmaceutical Industries Ltd (India) are some of the key players operating in the market.
Regional Market Summary
Bulimia Nervosa Market Share (%), by Region, 2018
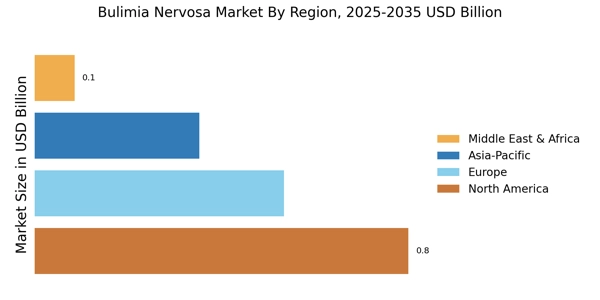
Geographically, the market has been segmented into the Americas, Europe, Asia-Pacific, and the Middle East & Africa. The Americas is anticipated to dominate the bulimia nervosa market owing to the rising prevalence of bulimia nervosa. According to data published by the National Institute of Mental Health (NIMH) in November 2017, 43.2% people suffering from bulimia nervosa sought treatment for their disorder in the US. Europe is expected to hold the second-largest share of the bulimia nervosa market owing to the presence of major market players such as AstraZeneca and GlaxoSmithKline plc. Asia-Pacific is expected to be the fastest-growing regional market owing to the rising awareness regarding mental disorders and high incidence rate of bulimia nervosa. The bulimia nervosa market in the Middle East & Africa is expected to hold the least share during the forecast period.
Market for Bulimia Nervosa, by Disorder Type
Market for Bulimia Nervosa, by Drug Type
Market for Bulimia Nervosa, by Route of Administration
Market for Bulimia Nervosa, by End User
Market for Bulimia Nervosa, by Region
Intended Audience
Report Attribute/Metric | Details |
---|---|
Market Size |
|
CAGR | 4.9% (2019-2025) |
Base Year | 2019 |
Forecast Period | 2020-2027 |
Historical Data | 2018 |
Forecast Units | Value (USD Million) |
Report Coverage | Revenue Forecast, Competitive Landscape, Growth Factors, and Trends |
Segments Covered | Disorder Type, Drug Type, Route of Administration and End User |
Geographies Covered | North America, Europe, Asia-Pacific, and Rest of the World (RoW) |
Key Vendors | Allergan, Inc. (Ireland), Eli Lilly and Company (US), AstraZeneca (UK), Bristol-Myers Squibb Company (US), GlaxoSmithKline plc (UK), Pfizer Inc. (US), Johnson & Johnson Services, Inc. (US), Dr. Reddy’s Laboratories Limited (India), Lupin Pharmaceuticals, Inc. (India), Aurobindo Pharma (India), Zydus Cadila (India), Apotex Inc. (Canada), Teva Pharmaceutical Industries Ltd (Israel) and Sun Pharmaceutical Industries Ltd (India) |
Key Market Opportunities | drastically changing lifestyle |
Key Market Drivers |
|