Brain Aneurysm Treatment Market Research Report- Global Forecast till 2030

Brain Aneurysm Treatment Market Research Report Information: By Type (Surgery (Surgical Clipping, 
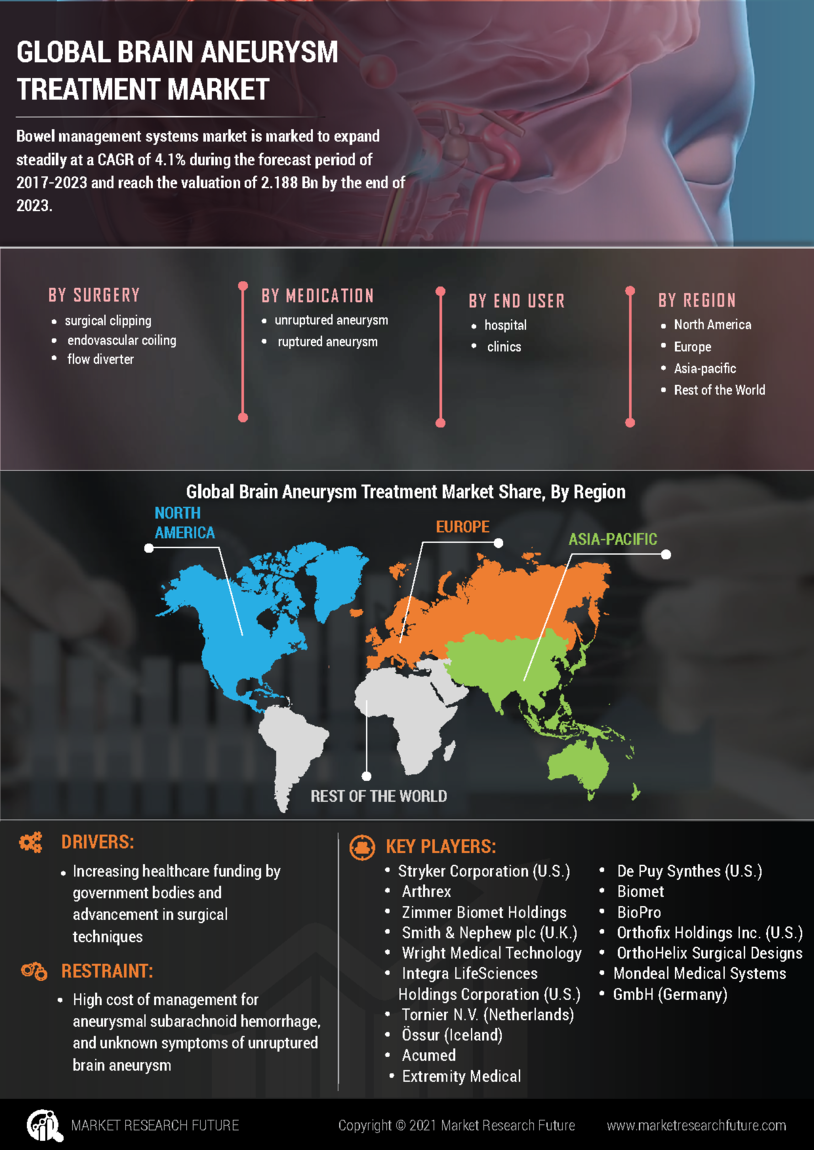
Endovascular Coiling), Medication (Antacid, Stool Softener)), Condition (Unruptured Aneurysm, Ruptured Aneurysm), End User (Hospitals, Clinics) - Global Forecast till 2030

ID: MRFR/Pharma/3142-HCR | 85 Pages | Author: Rahul Gotadki | March 2024         

BRIEF TOC

Chapter 1. Report Prologue

Chapter 2. Market Introduction

2.1 Definition

2.2 Scope of the Study

2.2.1 Research Objective

2.2.2 Assumptions

2.2.3 Limitations

Chapter 3. Research Methodology

3.1 Introduction

3.2 Primary Research

3.3 Secondary research

3.4 Market Size Estimation

Chapter 4. Market Dynamics

4.1 Drivers

4.2 Restrains

4.3 Opportunities

4.4 Challenges

4.5 Macroeconomic Indicators

4.6 Technology Trends & Assessment

Chapter 5. Market Factor Analysis

5.1 Porters Five Forces Analysis

5.1.1 Bargaining Power of Suppliers

5.1.2 Bargaining Power of Buyers

5.1.3 Threat of New Entrants

5.1.4 Threat of Substitutes

5.1.5 Intensity of Rivalry

5.2 Value Chain Analysis

5.3 Investment Feasibility Analysis

5.4 Pricing Analysis

Chapter 6. Global Brain Aneurysm Treatment Market, by Type

6.1 Introduction

6.2 Surgery

6.2.1 Market Estimates & Forecast, 2020 – 2027

6.3 Medication

6.3.1 Market Estimates & Forecast, 2020 – 2027

Chapter 7. Global Brain Aneurysm Treatment Market, by Condition

7.1 Introduction

7.2 Unruptured Aneurysm

7.2.1 Market Estimates & Forecast, 2020 – 2027

7.3 Ruptured Aneurysm

7.3.1 Market Estimates & Forecast, 2020 – 2027

Chapter 8. Global Brain Aneurysm Treatment Market, by End User

8.1 Introduction

8.2 Hospitals

8.2.1 Market Estimates & Forecast, 2020 – 2027

8.3 Clinics

8.2.2 Market Estimates & Forecast, 2020 – 2027

8.3 Others

Chapter 9. Global Brain Aneurysm Treatment Market, by Region

9.1 Introduction

9.2 Americas

9.2.1 North America

9.2.1.1 US

9.2.1.1 Canada

9.2.2 South America

9.3 Europe

9.3.1 Western Europe

9.3.1.1 Germany

9.3.1.2 France

9.3.1.3 Italy

9.3.1.4 Spain

9.3.1.5 UK

9.3.1.6 Rest of Western Europe

9.3.2 Eastern Europe

9.4 Asia Pacific

9.4.1 Japan

9.4.2 China

9.4.3 India

9.4.4 Australia

9.4.5 Republic of Korea

9.4.6 Rest of Asia Pacific

9.5 The Middle East & Africa

9.5.1 United Arab Emirates

9.5.2 Saudi Arabia

9.5.3 Oman

9.5.4 Kuwait

9.5.5 Qatar

9.5.6 Rest of the Middle East & Africa

Chapter 10 Company Landscape

10.1 Introduction

10.2 Market Share Analysis

10.3 Key Development & Strategies

10.3.1 Key Developments

Chapter 11 Company Profiles

11.1 Medtronic Plc.

11.1.1 Company Overview

11.1.2 Types Overview

11.1.3 Financials

11.1.4 SWOT Analysis

11.2 Codman & Shurtleff, Inc.

11.2.1 Company Overview

11.2.2 Types Overview

11.2.3 Financial Overview

11.2.4 Key Developments

11.2.5 SWOT Analysis

11.3 Raumedic AG

11.3.1 Company Overview

11.3.2 Types Overview

11.3.3 Financial Overview

11.3.4 Key Development

11.3.5 SWOT Analysis

11.4 Stryker

11.4.1 Company Overview

11.4.2 Types/Business Segment Overview

11.4.3 Financial Overview

11.4.4 Key Development

11.4.5 SWOT Analysis

11.5 MicroPort Scientific Corporation

11.5.1 Company Overview

11.5.2 Types Overview

11.5.3 Financial overview

11.5.4 Key Developments

11.6 Spiegelberg GmbH

11.6.1 Company Overview

11.6.2 Types Overview

11.6.3 Financial Overview

11.6.4 Key Developments

11.7 Johnson & Johnson

11.7.1 Overview

11.7.2 Types Overview

11.7.3 Financials

11.7.4 Key Developments

11.7.5 SWOT Analysis

11.8 Others

Chapter 12 MRFR Conclusion

12.1 Key Findings

12.1.1 From CEO’s View Point

12.1.2 Unmet Needs of the Market

12.2 Key Companies to Watch

12.3 Prediction of Brain Aneurysm Treatment industry

Chapter 13 Appendix

LIST OF TABLES

Table 1 Brain Aneurysm Treatment Industry Synopsis, 2020 – 2027

Table 2 Brain Aneurysm Treatment Market Estimates and Forecast, 2020 – 2027, (USD Million)

Table 3 Brain Aneurysm Treatment Market by Region, 2020 – 2027, (USD Million)

Table 4 Brain Aneurysm Treatment Market by Types, 2020 – 2027, (USD Million)

Table 5 Brain Aneurysm Treatment Market by Condition, 2020 – 2027, (USD Million)

Table 6 Brain Aneurysm Treatment Market by End Users, 2020 – 2027, (USD Million)

Table 7 North America Brain Aneurysm Treatment Market by Types, 2020 – 2027, (USD Million)

Table 8 North America Brain Aneurysm Treatment Market by Condition, 2020 – 2027, (USD Million)

Table 9 North America Brain Aneurysm Treatment Market by End Users, 2020 – 2027, (USD Million)

Table 10 US Brain Aneurysm Treatment Market by Types, 2020 – 2027, (USD Million)

Table 11 US Brain Aneurysm Treatment Market by Condition, 2020 – 2027, (USD Million)

Table 12 US Brain Aneurysm Treatment Market by End Users, 2020 – 2027, (USD Million)

Table 13 Canada Brain Aneurysm Treatment Market by Types, 2020 – 2027, (USD Million)

Table 14 Canada Brain Aneurysm Treatment market by Condition, 2020 – 2027, (USD Million)

Table 15 Canada Brain Aneurysm Treatment market by End Users, 2020 – 2027, (USD Million)

Table 16 South America Brain Aneurysm Treatment Market by Types, 2020 – 2027, (USD Million)

Table 17 South America Brain Aneurysm Treatment Market by Condition, 2020 – 2027, (USD Million)

Table 18 South America Brain Aneurysm Treatment Market by End Users, 2020 – 2027, (USD Million)

Table 19 Europe Brain Aneurysm Treatment Market by Types, 2020 – 2027, (USD Million)

Table 20 Europe Brain Aneurysm Treatment Market by Condition, 2020 – 2027, (USD Million)

Table 21 Europe Brain Aneurysm Treatment Market by End Users, 2020 – 2027, (USD Million)

Table 22 Western Europe Brain Aneurysm Treatment Market by Types, 2020 – 2027, (USD Million)

Table 23 Western Europe Brain Aneurysm Treatment Market by Condition, 2020 – 2027, (USD Million)

Table 24 Western Europe Brain Aneurysm Treatment Market by End Users, 2020 – 2027, (USD Million)

Table 25 Eastern Europe Brain Aneurysm Treatment Market by Types, 2020 – 2027, (USD Million)

Table 26 Eastern Europe Brain Aneurysm Treatment market by Condition, 2020 – 2027, (USD Million)

Table 27 Eastern Europe Brain Aneurysm Treatment Market by End Users, 2020 – 2027, (USD Million)

Table 28 Asia Pacific Brain Aneurysm Treatment Market by Types, 2020 – 2027, (USD Million)

Table 29 Asia Pacific Brain Aneurysm Treatment Market by Condition, 2020 – 2027, (USD Million)

Table 30 Asia Pacific Brain Aneurysm Treatment market by End Users, 2020 – 2027, (USD Million)

Table 31 Middle East & Africa Brain Aneurysm Treatment Market by Types, 2020 – 2027, (USD Million)

Table 32 Middle East & Africa Brain Aneurysm Treatment Market by Condition, 2020 – 2027, (USD Million)

Table 33 Middle East & Africa Brain Aneurysm Treatment market by End Users, 2020 – 2027, (USD Million)

LIST OF FIGURES

Figure 1 Research Process

Figure 2 Segmentation for Brain Aneurysm Treatment Market

Figure 3 Segmentation Market Dynamics for Brain Aneurysm Treatment Market

Figure 4 Global Brain Aneurysm Treatment market Share, by Types 2020

Figure 5 Global Brain Aneurysm Treatment market Share, by Condition 2020

Figure 6 Global Brain Aneurysm Treatment market Share, by End Users, 2020

Figure 7 Global Brain Aneurysm Treatment market Share, by Region, 2020

Figure 8 North America Brain Aneurysm Treatment market Share, by Country, 2020

Figure 9 Europe Brain Aneurysm Treatment market Share, by Country, 2020

Figure 10 Asia Pacific Brain Aneurysm Treatment market Share, by Country, 2020

Figure 11 Middle East & Africa Brain Aneurysm Treatment market Share, by Country, 2020

Figure 12 Global Brain Aneurysm Treatment market: Company Share Analysis, 2020 (%)

Figure 13 Medtronic Plc: Key Financials

Figure 14 Medtronic Plc: Segmental Revenue

Figure 15 Medtronic Plc: Geographical Revenue

Figure 16 Codman & Shurtleff, Inc.: Key Financials

Figure 17 Codman & Shurtleff, Inc.: Segmental Revenue

Figure 18 Codman & Shurtleff, Inc.: Geographical Revenue

Figure 19 Raumedic AG: Key Financials

Figure 20 Raumedic AG: Segmental Revenue

Figure 21 Raumedic AG: Geographical Revenue

Figure 22 Stryker: Key Financials

Figure 23 Stryker: Segmental Revenue

Figure 24 Stryker: Geographical Revenue

Figure 25 Johnson & Johnson: Key Financials

Figure 26 Johnson & Johnson: Segmental Revenue

Figure 27 Johnson & Johnson: Geographical Revenue

Figure 28 Spiegelberg GmbH: Key Financials

Figure 29 Spiegelberg GmbH: Segmental Revenue

Figure 30 Spiegelberg GmbH: Geographical Revenue

Figure 31 MicroPort Scientific Corporation: Key Financials

Figure 32 MicroPort Scientific Corporation: Segmental Revenue

Figure 33 MicroPort Scientific Corporation: Geographical Revenue

Leading companies partner with us for data-driven Insights.
Report List icon Report List icon Report List icon Report List icon Report List icon Report List icon Report List icon Report List icon Report List icon Report List icon Report List icon

Kindly complete the form below to receive a free sample of this Report

Please fill in Business Email for Quick Response
Invalid