Botnet Detection Market (2026 – 2035)

ID: MRFR/ICT/5015-HCR 100 Pages Nirmit Biswas Last Updated: September 15, 2026
Botnet Detection Market Size, Share and Research Report By Component (Solution, Service), By Deployment Type (On-Premise, Cloud), By Organization Size (SMEs, Large Enterprises), By End-User Vertical (Retail, BFSI, Travel & Hospitality, IT & Telecom, Media & Entertainment, Others) and By Region (North America, Europe, Asia-Pacific, South America, Middle East & Africa) – Industry Forecast to 2035
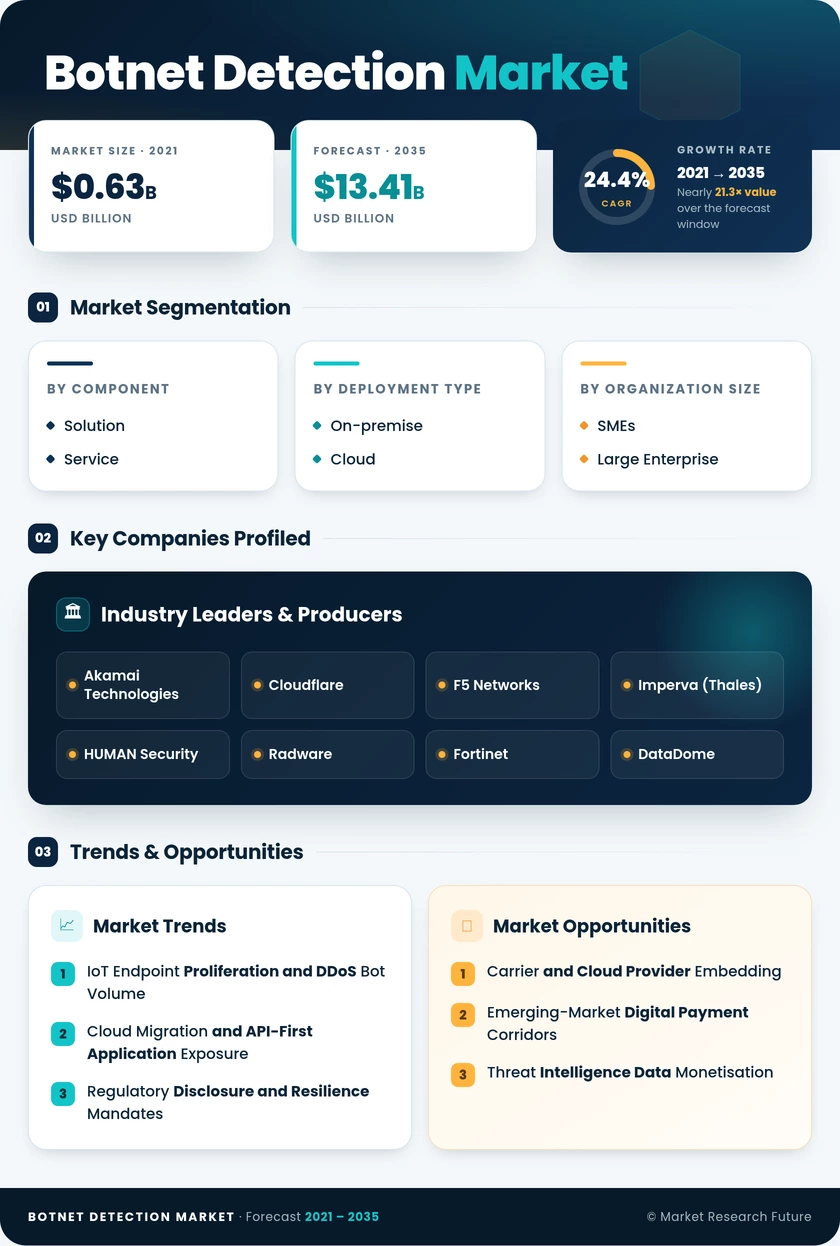
Botnet Detection Market
Market Size
Forecast Period2026-2035
CAGR (2026-2035)24.4%
2025 Market SizeUSD 1.51 Billion
2035 Market SizeUSD 13.41 Billion
Key Players
Akamai Technologies
Cloudflare
F5 Networks
Imperva
HUMAN Security
Radware
Opportunities
  • Carrier and Cloud Provider Embedding
  • Emerging-Market Digital Payment Corridors
  • Threat Intelligence Data Monetisation
  1. 1 Market Summary | |
    1. 1.1 Study Assumptions & Market Definition | |
    2. 1.2 Scope of the Study | |
    3. 1.3 Research Methodology | |
  2. 2 Key Report Takeaways | |
    1. 2.1 By Component | |
    2. 2.2 By Deployment Type | |
    3. 2.3 By Organization Size | |
    4. 2.4 By End-user Vertical | |
    5. 2.5 By Region | |
  3. 3 Market Size and Forecast (2021–2035) | |
    1. 3.1 Historical Market Size (2021–2024) | |
    2. 3.2 Base Year Estimate (2025) | |
    3. 3.3 Forecast Market Size (2026–2035) | |
    4. 3.4 Year-over-Year Growth Analysis | |
  4. 4 Driver Impact Analysis | |
    1. 4.1 IoT Endpoint Proliferation and DDoS Bot Volume | |
    2. 4.2 Cloud Migration and API-First Application Exposure | |
    3. 4.3 Regulatory Disclosure and Resilience Mandates | |
    4. 4.4 Automated Fraud Losses in BFSI and Retail | |
    5. 4.5 Machine-Learning Behavioural Classification | |
    6. 4.6 Managed Security Service Adoption by SMEs | |
    7. 4.7 5G and Edge Network Build-Out | |
  5. 5 Restraints Impact Analysis | |
    1. 5.1 Cybersecurity Skills Shortage | |
    2. 5.2 False Positives and Conversion Friction | |
    3. 5.3 Encrypted Traffic and Privacy Limits on Inspection | |
    4. 5.4 Budget Constraints Among Smaller Organisations | |
    5. 5.5 Tool Sprawl and Integration Complexity | |
  6. 6 Opportunities | |
    1. 6.1 Carrier and Cloud Provider Embedding | |
    2. 6.2 Emerging-Market Digital Payment Corridors | |
    3. 6.3 Threat Intelligence Data Monetisation | |
    4. 6.4 Agentic AI Traffic Classification | |
    5. 6.5 Vertical-Specific Packaging for Travel and Ticketing | |
  7. 7 Regional Market Share and Country-Level Analysis | |
    1. 7.1 North America | | |
      1. 7.1.1 United States | | |
      2. 7.1.2 Canada | |
    2. 7.2 Europe | | |
      1. 7.2.1 United Kingdom | | |
      2. 7.2.2 Germany | | |
      3. 7.2.3 France | | |
      4. 7.2.4 Rest of Europe | |
    3. 7.3 Asia-Pacific | | |
      1. 7.3.1 China | | |
      2. 7.3.2 India | | |
      3. 7.3.3 Japan | | |
      4. 7.3.4 Australia and New Zealand | | |
      5. 7.3.5 Rest of Asia-Pacific | |
    4. 7.4 South America | | |
      1. 7.4.1 Brazil | | |
      2. 7.4.2 Argentina | | |
      3. 7.4.3 Rest of South America | |
    5. 7.5 Middle East & Africa | | |
      1. 7.5.1 Saudi Arabia | | |
      2. 7.5.2 United Arab Emirates | | |
      3. 7.5.3 South Africa | | |
      4. 7.5.4 Rest of Middle East and Africa | |
  8. 8 Future Outlook (2026–2035) | |
    1. 8.1 Adversarial Automation and Model-Versus-Model Defence | |
    2. 8.2 Consolidation into Application Delivery Platforms | |
    3. 8.3 Identity-Anchored Traffic Classification | |
    4. 8.4 Insurance-Linked Security Economics | |
  9. 9 Segmentation Analysis | |
    1. 9.1 By Component | | |
      1. 9.1.1 Solution | | |
      2. 9.1.2 Service | |
    2. 9.2 By Deployment Type | | |
      1. 9.2.1 On-premise | | |
      2. 9.2.2 Cloud | |
    3. 9.3 By Organization Size | | |
      1. 9.3.1 SMEs | | |
      2. 9.3.2 Large Enterprise | |
    4. 9.4 By End-user Vertical | | |
      1. 9.4.1 Retail | | |
      2. 9.4.2 BFSI | | |
      3. 9.4.3 Travel and Hospitality | | |
      4. 9.4.4 IT and Telecom | | |
      5. 9.4.5 Media and Entertainment | | |
      6. 9.4.6 Other End-user Verticals (Education, Healthcare, and Real Estate) | |
  10. 10 Competitive Landscape | |
    1. 10.1 Market Concentration Analysis | |
    2. 10.2 Competitive Benchmarking Matrix | |
    3. 10.3 Company Profiles | |
  11. 11 Recent News and Developments | |
  12. 12 Report Scope and Methodology | |
  13. 13 Detailed Sources and Citations | |
  14. 14 Frequently Asked Questions | | LIST OF TABLES | |
  15. TABLE 1 Global Botnet Detection Market Size & Forecast, by Revenue (USD Billion), 2021–2035 | |
  16. TABLE 2 Global Botnet Detection Market — Year-over-Year Growth Analysis, 2021–2035 | |
  17. TABLE 3 Driver Impact Analysis — Botnet Detection Market, 2026–2035 | |
  18. TABLE 4 Restraint Impact Analysis — Botnet Detection Market, 2026–2035 | |
  19. TABLE 5 Global Botnet Detection Market Size, by Region, 2021–2035 (USD Billion) | |
  20. TABLE 6 North America Botnet Detection Market Size, by Country, 2021–2035 (USD Billion) | |
  21. TABLE 7 Europe Botnet Detection Market Size, by Country, 2021–2035 (USD Billion) | |
  22. TABLE 8 Asia-Pacific Botnet Detection Market Size, by Country, 2021–2035 (USD Billion) | |
  23. TABLE 9 South America Botnet Detection Market Size, by Country, 2021–2035 (USD Billion) | |
  24. TABLE 10 Middle East & Africa Botnet Detection Market Size, by Country, 2021–2035 (USD Billion) | |
  25. TABLE 11 Global Botnet Detection Market Size, by Component, 2021–2035 (USD Billion) | |
  26. TABLE 12 Global Botnet Detection Market Size, by Deployment Type, 2021–2035 (USD Billion) | |
  27. TABLE 13 Global Botnet Detection Market Size, by Organization Size, 2021–2035 (USD Billion) | |
  28. TABLE 14 Global Botnet Detection Market Size, by End-user Vertical, 2021–2035 (USD Billion) | |
  29. TABLE 15 Competitive Benchmarking Matrix — Botnet Detection Market, 2026 | |
  30. TABLE 16 Company Profiles — Key Players, Botnet Detection Market | |
  31. TABLE 17 Recent Developments & Strategic Announcements, 2023–2025 | |
  32. TABLE 18 Report Scope & Methodology Summary | |
  33. TABLE 19 Detailed Sources and Citations Index | |
  34. TABLE 20 Segmentation Quick Reference — Dominant and Fastest-Growing Segments | | LIST OF FIGURES | |
  35. FIGURE 1 Botnet Detection Market Dynamics — Drivers, Restraints and Opportunities | |
  36. FIGURE 2 Industry Value Chain Analysis — Botnet Detection Market | |
  37. FIGURE 3 Porter's Five Forces Analysis — Botnet Detection Market | |
  38. FIGURE 4 Global Market Size Trend and Forecast, 2021–2035 (USD Billion) | |
  39. FIGURE 5 Year-over-Year Growth Curve, 2022–2035 (%) | |
  40. FIGURE 6 Market Share by Component, 2025 vs 2035 (%) | |
  41. FIGURE 7 Market Share by Deployment Type, 2025 vs 2035 (%) | |
  42. FIGURE 8 Market Share by Organization Size, 2025 vs 2035 (%) | |
  43. FIGURE 9 Market Share by End-user Vertical, 2025 (%) | |
  44. FIGURE 10 Regional Revenue Share Distribution, 2025 (%) | |
  45. FIGURE 11 Regional CAGR Comparison, 2026–2035 (%) | |
  46. FIGURE 12 Country-Level Revenue Contribution — Top 10 Markets, 2025 | |
  47. FIGURE 13 Competitive Landscape — Estimated Revenue Share Bands, 2026 | |
  48. FIGURE 14 Vendor Positioning Matrix — Capability vs Market Presence | |
  49. FIGURE 15 Future Outlook Themes and Adoption Timeline, 2026–2035

Segmentation Quick Reference

DimensionSub-SegmentsDominant SegmentFastest Growing Segment
By ComponentSolution; ServiceSolution (66.2% share, 2025)Service (26.4% CAGR, 2026–2035)
By Deployment TypeOn-premise; CloudCloud (26.2% CAGR, 2026–2035)Cloud (26.2% CAGR, 2026–2035)
By Organization SizeSMEs; Large EnterpriseLarge Enterprise (USD 1.01 Billion, 2025)SMEs (26.8% CAGR, 2026–2035)
By End-user VerticalRetail; BFSI; Travel and Hospitality; IT and Telecom; Media and Entertainment; Other End-user Verticals (Education, Healthcare, and Real Estate)BFSI (26.2% share, 2025)Retail (26.9% CAGR, 2026–2035)


Market Segmentation Overview

By Component

Sub-SegmentKey Trend
SolutionConsolidation of classification, enforcement and analytics into single licensed platforms
ServiceGrowth of managed tuning, false-positive review and model validation retainers


Solution holds 66.2% of 2025 revenue because buyers license the classification engine and enforcement capacity as one commitment rather than assembling components. Service grows fastest at a 26.4% CAGR for a reason specific to this category: detection quality degrades without continuous tuning, and most organisations cannot staff that work internally. Managed contracts now routinely include quarterly model validation and rule maintenance, which converts an unfilled headcount requirement into a recurring subscription line.

By Deployment Type

Sub-SegmentKey Trend
On-premiseRetained by regulated entities with strict traffic egress and data residency restrictions
CloudEdge-delivered classification with elastic absorption of volumetric attack traffic


Cloud leads this dimension and expands at a 26.2% CAGR, outpacing On-premise on both counts. Volumetric absorption is a capacity problem no individual enterprise can economically provision, and edge scoring places the classification decision at the request origin, eliminating the latency penalty that historically discouraged enforcement. On-premise remains durable only where regulation forbids traffic leaving the jurisdiction — central banks, defence suppliers and certain sovereign public sector estates.

By Organization Size

Sub-SegmentKey Trend
SMEsChannel-delivered subscription packages with tuning included as standard
Large EnterpriseMulti-property, multi-endpoint agreements priced on aggregate request volume


Large Enterprise generated USD 1.01 billion in 2025, reflecting estates that span hundreds of domains and public API endpoints under a single negotiated agreement with regulatory reporting attached. SMEs grow fastest at a 26.8% CAGR because bundled managed subscriptions strip out both the capital cost and the security operations prerequisite that previously excluded them. Partner-originated deals dominate SME volume, trading vendor margin for installed-base reach.

By End-user Vertical

Sub-SegmentKey Trend
RetailScalping, card testing and inventory hoarding against limited-release inventory
BFSIAccount takeover prevention under operational resilience supervision
Travel and HospitalityLook-to-book ratio inflation from aggregator and metasearch scraping.
IT and TelecomSubscriber portal abuse and carrier-side infrastructure defence
Media and EntertainmentContent scraping controls and credential-sharing enforcement
Other End-user Verticals (Education, Healthcare, and Real Estate)Portal enumeration and listing data extraction defence


BFSI leads at 26.2% of 2025 revenue because automated account takeover produces direct monetary loss alongside supervisory consequences, and resilience regulation attaches explicit monitoring obligations to regulated entities. Retail is the fastest-growing vertical at a 26.9% CAGR, where card-testing campaigns impose measurable interchange penalties and scalping bots strip margin from limited-release inventory. Travel and Hospitality remains under-penetrated relative to its exposure, since look-to-book inflation degrades pricing economics without producing the visible fraud event that typically triggers budget release.




Download PDF ×

We do not share your information with anyone. However, we may send you emails based on your report interest from time to time. You may contact us at any time to opt-out.