Pharmaceutical Market Segmentation
Pharmaceutical By Application (USD Billion, 2025-2035)
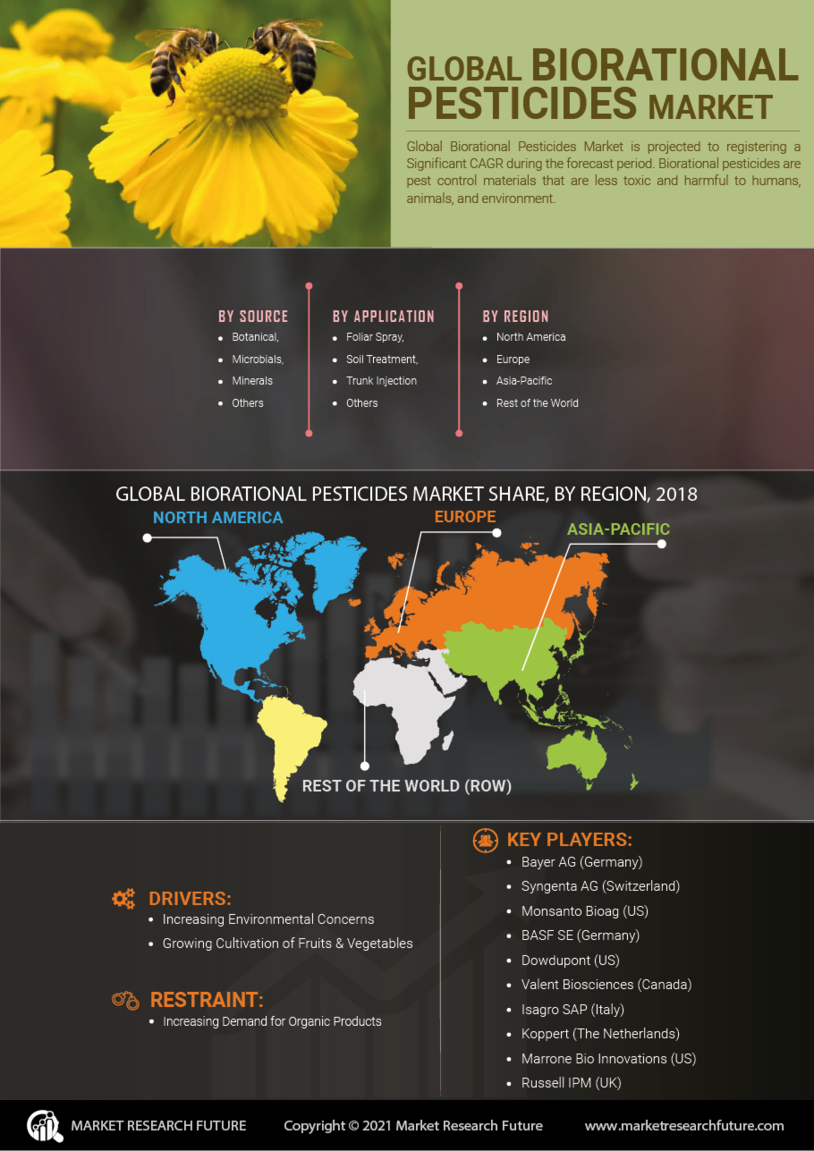
- Biorational Pesticides Market
- Horticulture
- Forestry
- Aquaculture
Pharmaceutical By Formulation Type (USD Billion, 2025-2035)
- Liquid
- Granular
- Wettable Powder
- Emulsifiable Concentrate
Pharmaceutical By Active Ingredient (USD Billion, 2025-2035)
- Microbial
- Botanical
- Biochemical
- Mineral
Pharmaceutical By Mode of Action (USD Billion, 2025-2035)
- Contact
- Systemic
- Repellent
- Insect Growth Regulator
Pharmaceutical By End Use (USD Billion, 2025-2035)
- Crop Protection
- Public Health
- Soil Health
- Post-Harvest Management