ID: MRFR/CnM/1432-HCR | February 2021 | Region: Global | 140 Pages
Table of Contents
1 Executive Summary
2 Market Introduction
2.1 Market Definition
2.2 Scope of the Study
2.3 List of Assumptions
2.4 Markets Structure
3 Market Research Methodology
3.1 Research Process
3.2 Primary Research
3.3 Secondary Research
3.4 Market Size Estimation
3.5 Forecast Model
4 Market Dynamics of Global Bioplastics Market
4.1 Introduction
4.2 Drivers
4.3 Restraints
4.4 Opportunities
4.5 Challenges
4.6 Trends/Technology
5 Market Factor Analysis of Global Bioplastics Market
5.1 Supply Chain Analysis
5.1.1 Raw Material Suppliers
5.1.2 Manufacturers/Producers
5.1.3 Distributors/Retailers/Wholesalers/E-Commerce
5.1.4 End User
5.2 Porterβs Five Forces Analysis
5.2.1 Threat of New Entrants
5.2.2 Bargaining Power of Buyers
5.2.3 Bargaining Power of Suppliers
5.2.4 Threat of Substitutes
5.2.5 Intensity of Competitive Rivalry
6. Global Bioplastics Market, by Type
6.1 Introduction
6.2 Biodegradable
6.2.1 Market Estimates & Forecast, 2019β2027
6.2.2 Market Estimates & Forecast, by Region, 2019β2027
6.3 non-biodegradable
6.3.1 Market Estimates & Forecast, 2019β2027
6.3.2 Market Estimates & Forecast, by Region, 2019β2027
7. Global Bioplastics Market, by Application
7.1 Introduction
7.2 Rigid Packaging
7.2.1 Market Estimates & Forecast, 2019β2027
7.2.2 Market Estimates & Forecast, by Region, 2019β2027
7.3 Flexible Packaging
7.3.1 Market Estimates & Forecast, 2019β2027
7.3.2 Market Estimates & Forecast, by Region, 2019β2027
7.4 Textile
7.4.1 Market Estimates & Forecast, 2019β2027
7.4.2 Market Estimates & Forecast, by Region, 2019β2027
7.5 Agriculture and Horticulture
7.5.1 Market Estimates & Forecast, 2019β2027
7.5.2 Market Estimates & Forecast, by Region, 2019β2027
7.6 Consumer Goods
7.6.1 Market Estimates & Forecast, 2019β2027
7.6.2 Market Estimates & Forecast, by Region, 2019β2027
7.7 Automotive
7.7.1 Market Estimates & Forecast, 2019β2027
7.7.2 Market Estimates & Forecast, by Region, 2019β2027
7.8 Electronics
7.8.1 Market Estimates & Forecast, 2019β2027
7.8.2 Market Estimates & Forecast, by Region, 2019β2027
7.9 Building and Construction
7.9.1 Market Estimates & Forecast, 2019β2027
7.9.2 Market Estimates & Forecast, by Region, 2019β2027
7.10 Others
7.10.1 Market Estimates & Forecast, 2019β2027
7.10.2 Market Estimates & Forecast, by Region, 2019β2027
8. Global Bioplastics Market, by Region
8.1 Introduction
8.2 North America
8.2.1 Market Estimates & Forecast, 2019β2027
8.2.2 Market Estimates & Forecast, by Type, 2019β2027
8.2.3 Market Estimates & Forecast, by Application, 2019β2027
8.2.4 US
8.2.4.1 Market Estimates & Forecast, 2019β2027
8.2.4.2 Market Estimates & Forecast, by Type, 2019β2027
8.2.4.3 Market Estimates & Forecast, by Application, 2019β2027
8.2.5 Canada
8.2.5.1 Market Estimates & Forecast, 2019β2027
8.2.5.2 Market Estimates & Forecast, by Type, 2019β2027
8.2.5.3 Market Estimates & Forecast, by Application, 2019β2027
8.3 Europe
8.3.1 Market Estimates & Forecast, 2019β2027
8.3.2 Market Estimates & Forecast, by Type, 2019β2027
8.3.3 Market Estimates & Forecast, by Application, 2019β2027
8.3.4 Germany
8.3.4.1 Market Estimates & Forecast, 2019β2027
8.3.4.2 Market Estimates & Forecast, by Type, 2019β2027
8.3.4.3 Market Estimates & Forecast, by Application, 2019β2027
8.3.5 France
8.3.5.1 Market Estimates & Forecast, 2019β2027
8.3.5.2 Market Estimates & Forecast, by Type, 2019β2027
8.3.5.3 Market Estimates & Forecast, by Application, 2019β2027
8.3.6 Italy
8.3.6.1 Market Estimates & Forecast, 2019β2027
8.3.6.2 Market Estimates & Forecast, by Type, 2019β2027
8.3.6.3 Market Estimates & Forecast, by Application, 2019β2027
8.3.7 Spain
8.3.7.1 Market Estimates & Forecast, 2019β2027
8.3.7.2 Market Estimates & Forecast, by Type,2019β2027
8.3.7.3 Market Estimates & Forecast, by Application, 2019β2027
8.3.8 UK
8.3.8.1 Market Estimates & Forecast, 2019β2027
8.3.8.2 Market Estimates & Forecast, by Type,2019β2027
8.3.8.3 Market Estimates & Forecast, by Application, 2019β2027
8.3.9 Russia
8.3.9.1 Market Estimates & Forecast, 2019β2027
8.3.9.2 Market Estimates & Forecast, by Type,2019β2027
8.3.9.3 Market Estimates & Forecast, by Application, 2019β2027
8.3.10 Poland
8.3.10.1 Market Estimates & Forecast, 2019β2027
8.3.10.2 Market Estimates & Forecast, by Type, 2019β2027
8.3.10.3 Market Estimates & Forecast, by Application, 2019β2027
8.3.11 Rest of Europe
8.3.11.1 Market Estimates & Forecast, 2019β2027
8.3.11.2 Market Estimates & Forecast, by Type, 2019β2027
8.3.11.3 Market Estimates & Forecast, by Application, 2019β2027
8.4 Asia-Pacific
8.4.1 Market Estimates & Forecast, 2019β2027
8.4.2 Market Estimates & Forecast, by Type, 2019β2027
8.4.3 Market Estimates & Forecast, by Application, 2019β2027
8.4.4 China
8.4.4.1 Market Estimates & Forecast, 2019β2027
8.4.4.2 Market Estimates & Forecast, by Type, 2019β2027
8.4.4.3 Market Estimates & Forecast, by Application, 2019β2027
8.4.5 India
8.4.5.1 Market Estimates & Forecast, 2019β2027
8.4.5.2 Market Estimates & Forecast, by Type, 2019β2027
8.4.5.3 Market Estimates & Forecast, by Application, 2019β2027
8.4.6 Japan
8.4.6.1 Market Estimates & Forecast, 2019β2027
8.4.6.2 Market Estimates & Forecast, by Type, 2019β2027
8.4.6.3 Market Estimates & Forecast, by Application, 2019β2027
8.4.7 Australia & New Zealand
8.4.7.1 Market Estimates & Forecast, 2019β2027
8.4.7.2 Market Estimates & Forecast, by Type, 2019β2027
8.4.7.3 Market Estimates & Forecast, by Application, 2019β2027
8.4.8 Rest of Asia-Pacific
8.4.8.1 Market Estimates & Forecast, 2019β2027
8.4.8.2 Market Estimates & Forecast, by Type, 2019β2027
8.4.8.3 Market Estimates & Forecast, by Application, 2019β2027
8.5 Middle East & Africa
8.5.1 Market Estimates & Forecast, 2019β2027
8.5.2 Market Estimates & Forecast, by Type, 2019β2027
8.5.3 Market Estimates & Forecast, by Application, 2019β2027
8.5.4 GCC
8.5.4.1 Market Estimates & Forecast, 2019β2027
8.5.4.2 Market Estimates & Forecast, by Type, 2019β2027
8.5.4.3 Market Estimates & Forecast, by Application, 2019β2027
8.5.5 Israel
8.5.5.1 Market Estimates & Forecast, 2019β2027
8.5.5.2 Market Estimates & Forecast, by Type, 2019β2027
8.5.5.3 Market Estimates & Forecast, by Application, 2019β2027
8.5.6 North Africa
8.5.6.1 Market Estimates & Forecast, 2019β2027
8.5.6.2 Market Estimates & Forecast, by Type, 2019β2027
8.5.6.3 Market Estimates & Forecast, by Application, 2019β2027
8.5.7 Turkey
8.5.7.1 Market Estimates & Forecast, 2019β2027
8.5.7.2 Market Estimates & Forecast, by Type, 2019β2027
8.5.7.3 Market Estimates & Forecast, by Application, 2019β2027
8.5.8 Rest of Middle East & Africa
8.5.8.1 Market Estimates & Forecast, 2019β2027
8.5.8.2 Market Estimates & Forecast, by Type, 2019β2027
8.5.8.3 Market Estimates & Forecast, by Application, 2019β2027
8.6 Latin America
8.6.1 Market Estimates & Forecast, 2019β2027
8.6.2 Market Estimates & Forecast, by Type, 2019β2027
8.6.3 Market Estimates & Forecast, by Application, 2019β2027
8.6.4 Brazil
8.6.4.1 Market Estimates & Forecast, 2019β2027
8.6.4.2 Market Estimates & Forecast, by Type, 2019β2027
8.6.4.3 Market Estimates & Forecast, by Application, 2019β2027
8.6.5 Argentina
8.6.5.1 Market Estimates & Forecast, 2019β2027
8.6.5.2 Market Estimates & Forecast, by Type, 2019β2027
8.6.5.3 Market Estimates & Forecast, by Application, 2019β2027
8.6.6 Mexico
8.6.6.1 Market Estimates & Forecast, 2019β2027
8.6.6.2 Market Estimates & Forecast, by Type, 2019β2027
8.6.6.3 Market Estimates & Forecast, by Application, 2019β2027
8.6.7 Rest of Latin America
8.6.7.1 Market Estimates & Forecast, 2019β2027
8.6.7.2 Market Estimates & Forecast, by Type, 2019β2027
8.6.7.3 Market Estimates & Forecast, by Application, 2019β2027
9. Company Landscape
9.1 Introduction
9.2 Market Strategy
9.3 Key Development Analysis (Expansion/Merger & Acquisitions/Joint Venture/New Product Development/Agreement/Investment)
10. Company Profiles
10.1 Braskem
10.1.1 Company Overview
10.1.2 Financial Updates
10.1.3 Product/Business Segment Overview
10.1.4 Strategy
10.1.5 Key Developments
10.1.6 SWOT Analysis
10.2 Total Corbion PLA
10.2.1 Company Overview
10.2.2 Financial Updates
10.2.3 Product/Business Segment Overview
10.2.4 Strategy
10.2.5 Key Developments
10.2.6 SWOT Analysis
10.3 NatureWorks
10.3.1 Company Overview
10.3.2 Financial Updates
10.3.3 Product/Business Segment Overview
10.3.4 Strategy
10.3.5 Key Developments
10.3.6 SWOT Analysis
10.4 Bio-On
10.4.1 Company Overview
10.4.2 Financial Updates
10.4.3 Product/Business Segment Overview
10.4.4 Strategy
10.4.5 Key Developments
10.4.6 SWOT Analysis
10.5 Novamont
10.5.1 Company Overview
10.5.2 Financial Updates
10.5.3 Product/Business Segment Overview
10.5.4 Strategy
10.5.5 Key Developments
10.5.6 SWOT Analysis
10.6 Toray Industries
10.6.1 Company Overview
10.6.2 Financial Updates
10.6.3 Product/Business Segment Overview
10.6.4 Strategy
10.6.5 Key Developments
10.6.6 SWOT Analysis
10.7 Plantic Technologies
10.7.1 Company Overview
10.7.2 Financial Updates
10.7.3 Product/Business Segment Overview
10.7.4 Strategy
10.7.5 Key Developments
10.7.6 SWOT Analysis
10.8 BASF SE
10.8.1 Company Overview
10.8.2 Financial Updates
10.8.3 Product/Business Segment Overview
10.8.4 Strategy
10.8.5 Key Developments
10.8.6 SWOT Analysis
10.9 Biome Bioplastics
10.9.1 Company Overview
10.9.2 Financial Updates
10.9.3 Product/Business Segment Overview
10.9.4 Strategy
10.9.5 Key Developments
10.9.6 SWOT Analysis
10.10 Mitsubishi Chemical Corporation
10.10.1 Company Overview
10.10.2 Financial Updates
10.10.3 Product/Business Segment Overview
10.10.4 Strategy
10.10.5 Key Developments
10.10.6 SWOT Analysis
11. Conclusion
LIST OF TABLES
Table 1 Global Bioplastics Market: by Region, 2019β2027
Table 2 North America: Bioplastics Market, by Country, 2019β2027
Table 3 Europe: Bioplastics Market, by Country, 2019β2027
Table 4 Asia-Pacific: Bioplastics Market. by Country, 2019β2027
Table 5 Middle East & Africa: Bioplastics Market, by Country, 2019β2027
Table 6 Latin America: Bioplastics Market, by Country, 2019β2027
Table 7 Global Bioplastics Type Market, by Regions, 2019β2027
Table 8 North America: Bioplastics Type Market, by Country, 2019β2027
Table 9 Europe: Bioplastics Type Market, by Country, 2019β2027
Table10 Asia-Pacific: Bioplastics Type Market, by Country, 2019β2027
Table11 Middle East & Africa: Bioplastics Type Market, by Country, 2019β2027
Table12 Latin America: Bioplastics Type Market, by Country, 2019β2027
Table 13 Global Bioplastics Application Market, by Regions, 2019β2027
Table14 North America: Bioplastics Application Market, by Country, 2019β2027
Table15 Europe: Bioplastics Application Market, by Country, 2019β2027
Table16 Asia-Pacific: Bioplastics Application Market, by Country, 2019β2027
Table17 Middle East & Africa: Bioplastics Application Market, by Country, 2019β2027
Table18 Latin America: Bioplastics by Application Market, by Country, 2019-2027
Table19 Global Type Market, by Region, 2019β2027
Table20 Global Application Market, by Region, 2019β2027
Table21 North America: Bioplastics Market, by Country, 2019β2027
Table22 North America: Bioplastics Market, by Type, 2019β2027
Table23 North America: Bioplastics Market, by Application, 2019β2027
Table24 Europe: Bioplastics Market, by Country, 2019β2027
Table25 Europe: Bioplastics Market, by Type, 2019β2027
Table26 Europe: Bioplastics Market, by Application, 2019β2027
Table27 Asia-Pacific: Bioplastics Market, by Country, 2019β2027
Table28 Asia-Pacific: Bioplastics Market, by Type, 2019β2027
Table29 Asia-Pacific: Bioplastics Market, by Application, 2019β2027
Table30 Middle East & Africa: Bioplastics Market, by Country, 2019β2027
Table31 Middle East & Africa: Bioplastics Market, by Type, 2019β2027
Table32 Middle East & Africa: Bioplastics Market, by Application, 2019β2027
Table33 Latin America: Bioplastics Market, by Country, 2019β2027
Table34 Latin America: Bioplastics Market, by Type, 2019β2027
Table35 Latin America: Bioplastics Market, by Application, 2019β2027
LIST OF FIGURES
FIGURE 1 Global Bioplastics Market Segmentation
FIGURE 2 Forecast Research Methodology
FIGURE 3 Five Forces Analysis of Global Bioplastics Market
FIGURE 4 Value Chain of Global Bioplastics Market
FIGURE 5 Share of Global Bioplastics Market in 2019, by Country
FIGURE 6 Global Bioplastics Market, 2019β2027,
FIGURE 7 Global Bioplastics Market Size, by Type, 2019
FIGURE 8 Share of Global Bioplastics Market, by Type, 2019β2027
FIGURE 9 Global Bioplastics Market Size, by Application, 2019
FIGURE10 Share of Global Bioplastics Market, by Application, 2019β2027
$6.48 Billion
10%
Europe
2021-2027
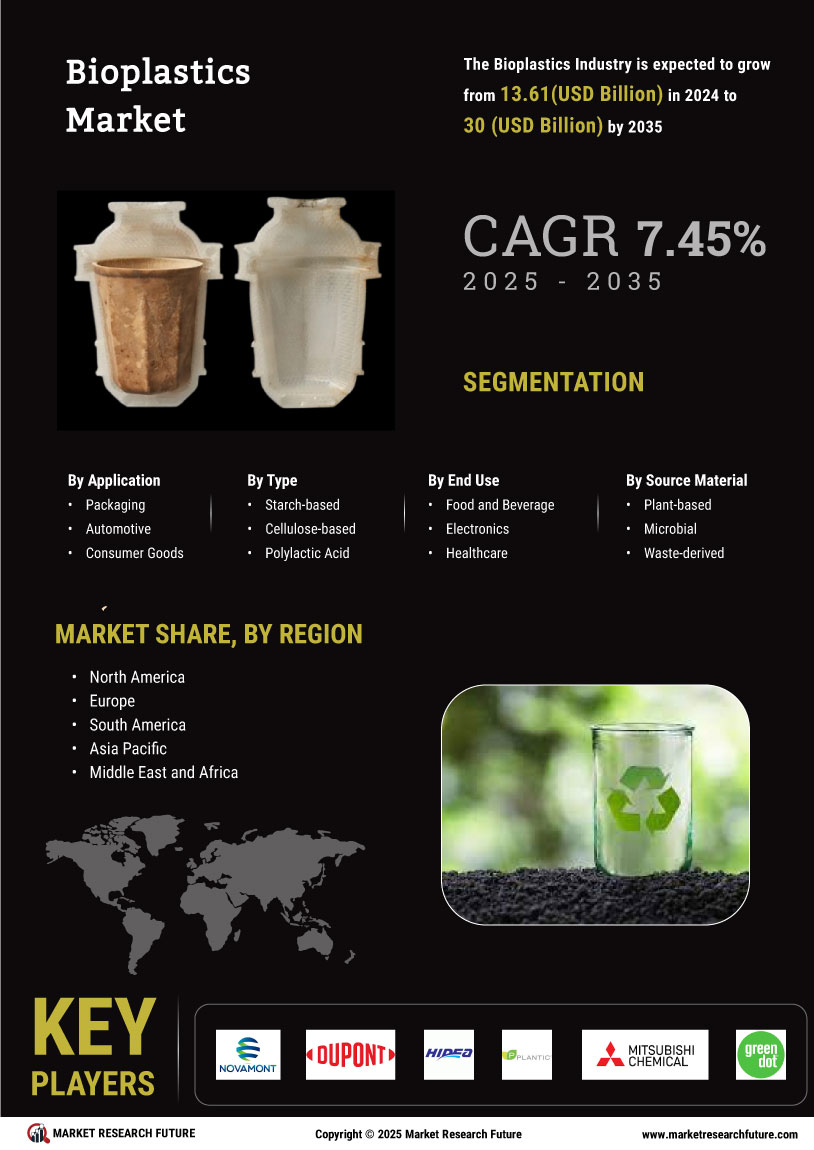
Bioplastics Market is expected to grow USD 6.48 billion at a 10% during the forecast period, says market research future (MRFR). Environmental issues encouraging a paradigm change and increased demand for bioplastics in flexible packaging are two major factors driving the market examined. One of the primary drivers for the bioplastic industry is the environmental issue posed by excessive levels of greenhouse gas emissions in the atmosphere, as bioplastics serve to reduce reliance on fossil resources, reduce greenhouse gas (GHG) emissions, and boost resource efficiency. During the projected period, the flexible packaging application is expected to lead the global market in terms of volume. Alternatives to petroleum-based plastics and government regulations on existing plastics are anticipated to present future opportunities.
COVID-19 has a short history in the world but it has changed the course of world history and destiny far more than any other pandemic preceding it did. The virus is dangerous and somewhat contagious. It killed more than a few people, left many people seriously ill, and caused long-term health complications in those who recovered.
Governments realized this early on that’s why they imposed lockdowns and quarantines in an attempt to stop the spread of the virus. They were temporary because they weren’t very effective. In any case, most companies in a variety of industries suffered because they were either forced to halt production at least temporarily or dramatically scale back their operations.
The companies in the bio-plastics industry were no exception. The demand for all types of plastics products declined dramatically because people were staying in more often. They didn’t want to be exposed to COVID-19. This disrupted the supply chain operations for most bio-plastics companies and it’s taking them a long time to recover from this.
The bioplastics industry is highly competitive and somewhat fragmented. The reasons for this are:
Companies are finding that they can remain profitable only if they create a sustainable competitive advantage through intensive research and development. This allows them to develop and market newer and better products before the competition can. They can enter new markets and solidify their positions in existing markets. They can also create a name for themselves in new and old markets. Finally, they can justify charging higher prices for these bioplastics.
Companies are also responding by merging their production of raw materials and their distribution operations. The result is the introduction of better quality products on the market. Incidentally, these companies also expand their regional presence.
Teijin Limited is a Japanese company. It has managed to remain profitable in the super-competitive bioplastics industry by creating a sustainable competitive advantage. The company has done so by investing heavily in research and development. This allowed it to develop and market superior and unique products.
List of companies
Drivers
The world is preferring to use products from renewable and natural sources. Bio-plastics are no exception. Many companies in many industries and the general public prefer to use plastics that have the same qualities as traditional plastics but decompose easily and are don’t harm the environment when they do so.
Many companies prefer to use bio-plastics when they make plastic bags, packaging for various foodstuffs, disposable items, and general packaging. This is also a major bio-based chemicals market growth driver.
Opportunities
Many companies in the bio-plastics industry are seeing that the market is lucrative. They are investing heavily in research and development in the attempt to develop better quality bio-plastics that are friendlier for the environment.
Restraints
What’s holding back growth in the bioplastics industry is that bio-plastics tend to be more expensive. Therefore, a lot of companies in many industries can’t afford them.
Challenges
One of the biggest challenges that companies in the bioplastics industry face lies in continuing to make superior bioplastics products at lower price points that end users can afford. They also have to educate the general global public on the many benefits of bioplastics.
Cumulative growth analysis
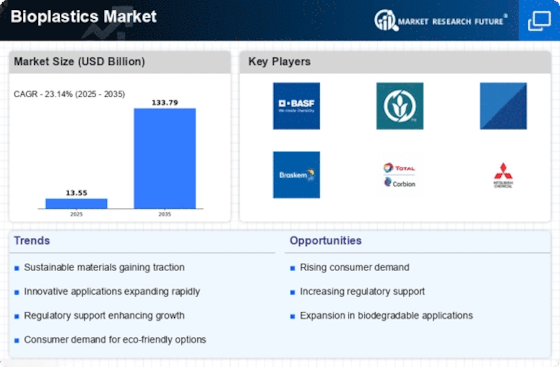
The CAGR for the global bioplastics industry is 10%. The overall bioplastics market value is projected to be USD 11.68 billion by 2027.
Technology analysis
Newer advancements in technology have made it possible for plastics manufacturers to make plastics out of natural and renewable crops like sugarcane, corn, and vegetable oil. This is making it possible for companies to make friendlier plastics that last longer and don’t release harsh and dangerous chemicals into the ground as they decompose. With the advent of newer technologies, the bioplastic market is expecting to see a huge growth in the upcoming years as per the mentioned forecasted data in the report.
By type
The global bioplastics industry can be grouped into the following sub-segments based on type:
Partially degradable plastics are popular because they are made from natural ingredients. Therefore, they decompose safely into the ground. Many companies in the film, carry bags, sheets, and other industries use this type of plastic.
By application
The global bioplastics industry can be grouped into the following sub-segments based on application:
The global bioplastics industry can be grouped into the following regions:
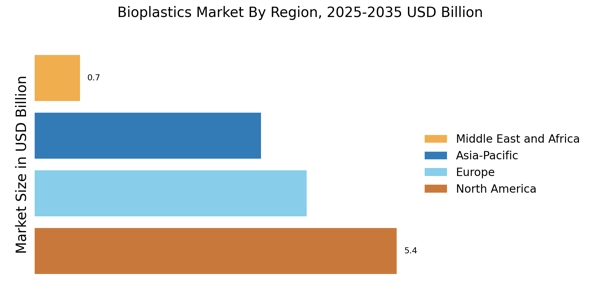
The European Union had the greatest bioplastics industry market share in 2019 at 33.7%. This was because the European Union has strict standards regarding the production and usage of plastics. It also has a large concentration of bioplastic companies.
The European Union as a whole has passed many laws and rules that make it much harder for companies and individuals to use plastics that have to be thrown away after only one use. Most companies in the European Union are also investing much more in the technologies that are needed to make bioplastics. These factors are also driving growth in this region. The European masses, in general, are aware of the bad effects that plastics have on the environment as they decompose and they are taking steps to try to discourage the production and usage of traditional plastics as much as possible.
The Asia-Pacific region had a bioplastics industry market share of 34.4% in 2018. This made it the region with the largest market share and size for that year. There were many factors that accounted for this. They were:
The North American region has the third-highest bioplastics industry market share. What accounts for this is the passage of new laws and legislation that makes using traditional plastics illegal.
The Latin American, Middle Eastern, and African markets are trailing in terms of market growth and share largely because of a lack of awareness of the many benefits of bioplastics.
Recent developments
Report overview
The CAGR for the bioplastics industry is projected to be 10% by 2027. The bioplastics market value is expected to be USD 11.68 billion by then! New advancements in technology have made it possible for companies to make plastic products out of naturally grown materials. Because they are environmentally friendly, more and more people around the world are preferring to use them every year. This is because people are becoming more aware of how sensitive the environment is and the pressing need to protect it.
What is also a major factor is the fact that governments around the world are becoming stricter regarding the ways in which companies are allowed to manufacture and use plastics. They are also severely restricting the chemicals that companies can use to make these plastics - hence the increased production, marketing, and usage of bioplastics.
The European Union has the greatest bioplastics market share. This is because most European governments are becoming much stricter about the processes that companies can use to make plastic products. They are also becoming much stricter in terms of the materials that these companies can use to make these plastics.
The Asia-Pacific region has the second-highest bioplastics market share. It has the highest bioplastics market growth rate of all of the regions in the world. There are many factors for this. One is because the masses in most Asia-Pacific nations are becoming better educated. They are becoming more aware of the environment and hence, more sensitive to it. These masses prefer to use products that are safer for the environment.
Report Attribute/Metric | Details |
---|---|
Market Size |
|
CAGR | CAGR of 10% (2022-2030) |
Base Year | 2021 |
Forecast Period | 2022-2030 |
Historical Data | 2019Β &Β 2020 |
Forecast Units | Value (USD Billion) |
Report Coverage | Revenue Forecast, Competitive Landscape, Growth Factors, and Trends |
Segments Covered | by Type, Application |
Geographies Covered | North America, Europe, Asia-Pacific, and Rest of the World (RoW) |
Key Vendors | Braskem (Brazil), Total Corbion PLA (The Netherlands), NatureWorks (US), Bio-On (Italy), Novamont (Italy), Toray Industries (Japan), Plantic Technologies (Australia), BASF (Germany), Biome Bioplastics (UK), Mitsubishi Chemical Corporation (Japan) |
Key Market Opportunities | Imposition of ban on the use of conventional plastics |
Key Market Drivers |
|
Frequently Asked Questions (FAQ) :
The global bioplastic market is expected to register a CAGR of 10% by the end of the forecast year 2023.
The global bioplastic market is segmented based on application as flexible packaging, rigid packaging, textile, horticulture, agriculture, automotive, consumer goods, electronics, construction, building, and others.
With a total market share of 34.4% as per the market share analysis compiled in 2018 Asia-Pacific region was the largest shareholder of the global bioplastic market in terms of size and volume of the market.
With a market share of 33.7% as per the market share analysis compiled in 2019, The European region was accounted to be the market-dominant in the global bioplastic market.