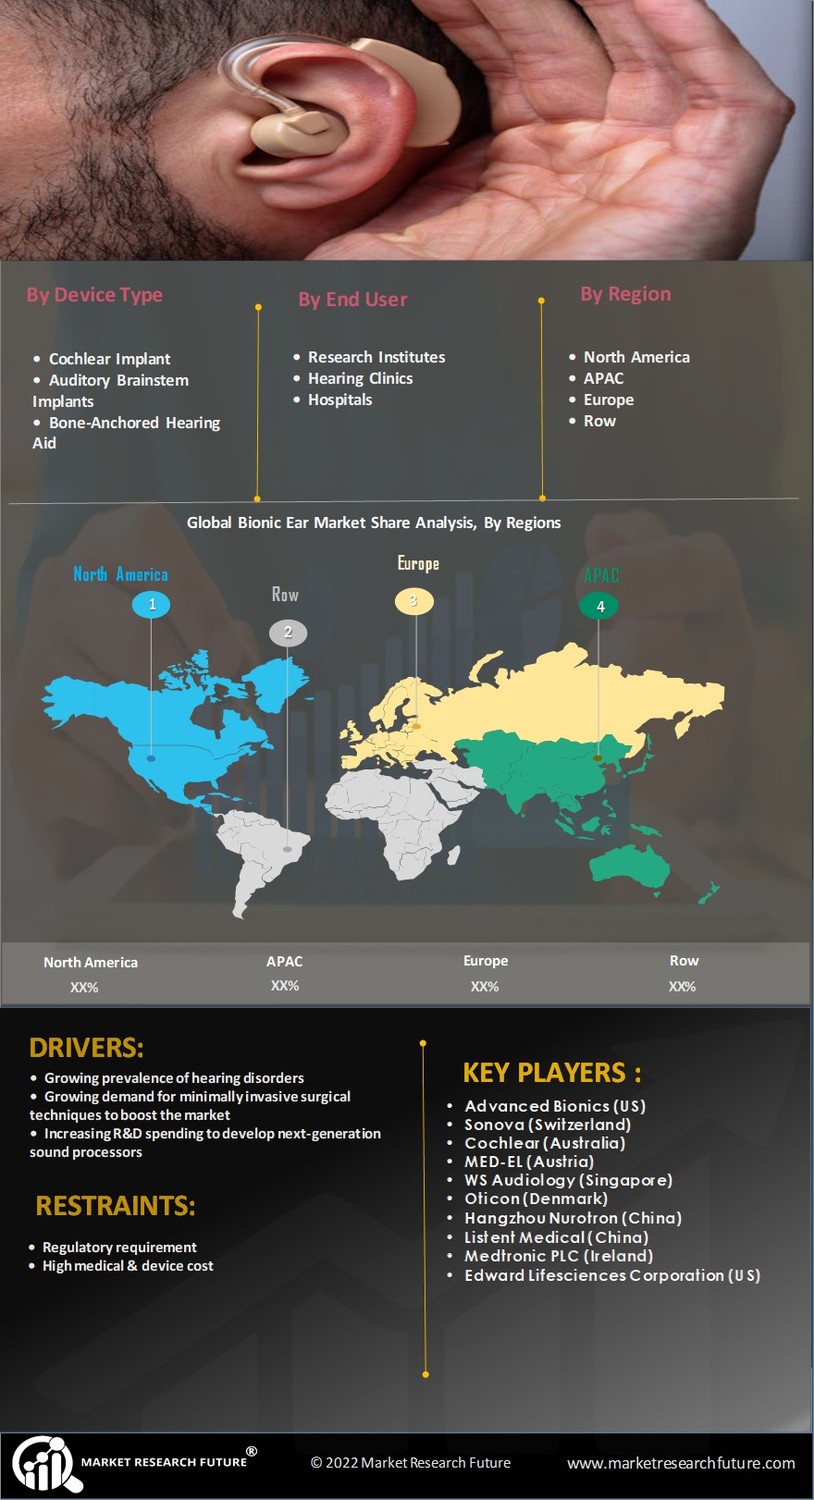
Certified Global Research Member
Isomar fd.webp Wcrc 57.webp
Key Questions Answered
  • Global Market Outlook
  • In-depth analysis of global and regional trends
  • Analyze and identify the major players in the market, their market share, key developments, etc.
  • To understand the capability of the major players based on products offered, financials, and strategies.
  • Identify disrupting products, companies, and trends.
  • To identify opportunities in the market.
  • Analyze the key challenges in the market.
  • Analyze the regional penetration of players, products, and services in the market.
  • Comparison of major players’ financial performance.
  • Evaluate strategies adopted by major players.
  • Recommendations
Why Choose Market Research Future?
  • Vigorous research methodologies for specific market.
  • Knowledge partners across the globe
  • Large network of partner consultants.
  • Ever-increasing/ Escalating data base with quarterly monitoring of various markets
  • Trusted by fortune 500 companies/startups/ universities/organizations
  • Large database of 5000+ markets reports.
  • Effective and prompt pre- and post-sales support.

Global Bionic Ear Market: By Device Type (Cochlear Implant, Auditory Brainstem Implants, Bone-Anchored Hearing Aid), By End User (Research Institutes, Hearing Clinics, Hospitals), and Region (North America, Europe, Asia-Pacific, Rest of the World)—Forecast to 2030


ID: MRFR/HC/9163-HCR | 120 Pages | Author: Rahul Gotadki| April 2024
Leading companies partner with us for data-driven Insights
client_1 client_2 client_3 client_4 client_5 client_6 client_7 client_8 client_9 client_10
Please fill in Business Email for Quick Response

TABLE OF CONTENTS

1. REPORT PROLOGUE

2. MARKET INTRODUCTION

2.1. Definition

2.2. Scope of the Study

2.2.1. Research Objective

2.2.2. Assumptions

2.2.3. Limitations

3. RESEARCH METHODOLOGY

3.1. Overview

3.2. Data Mining

3.3. Secondary Research

3.4. Primary Research

3.4.1. Primary Interviews and Information Gathering Process

3.4.2. Breakdown of Primary Respondents

3.5. Forecasting Techniques

3.6. Market Size Estimation

3.6.1. Bottom-Up Approach

3.6.2. Top-Down Approach

3.7. Data Triangulation

3.8. Validation

4. MARKET DYNAMICS

4.1. Overview

4.2. Drivers

4.3. Restraints

4.4. Opportunities

5. MARKET FACTOR ANALYSIS

5.1. Porter’s Five Forces Analysis

5.1.1. Bargaining Power of Suppliers

5.1.2. Bargaining Power of Buyers

5.1.3. Threat of New Entrants

5.1.4. Threat of Substitutes

5.1.5. Rivalry

5.2. Value Chain Analysis

5.3. COVID-19 Impact Analysis

5.3.1. Market Impact Analysis

5.3.2. Impact on Supply Chain

5.3.3. Regional Impact

5.3.4. Opportunity and Threat Analysis

6. GLOBAL BIONIC EAR MARKET, BY DEVICE TYPE

6.1. Overview

6.2. Cochlear implant

Market Estimates & Forecast, by Region, 2022–2030

Market Estimates & Forecast, by Country, 2022–2030

6.3. Auditory Brainstem Implants

Market Estimates & Forecast, by Region, 2022–2030

Market Estimates & Forecast, by Country, 2022–2030

6.4Bone-anchored hearing aid

Market Estimates & Forecast, by Region, 2022–2030

Market Estimates & Forecast, by Country, 2022–2030

7. GLOBAL BIONIC EAR MARKET, BY END USER

7.1. Overview

7.2. Research Institutes

Market Estimates & Forecast, by Region, 2022–2030

Market Estimates & Forecast, by Country, 2022–2030

7.3. Hearing Clinics

Market Estimates & Forecast, by Region, 2022–2030

Market Estimates & Forecast, by Country, 2022–2030

7.4. Hospitals

Market Estimates & Forecast, by Region, 2022–2030

Market Estimates & Forecast, by Country, 2022–2030

8. GLOBAL BIONIC EAR MARKET BY REGION

8.1. Overview

8.2. North America

8.2.1. US

8.2.2. Canada

8.3. Europe

8.3.1. Germany

8.3.2. France

8.3.3. Italy

8.3.4. Spain

8.3.5. UK

8.3.6. Rest of Europe

8.4. Asia-Pacific

8.4.1. Japan

8.4.2. China

8.4.3. India

8.4.4. Australia

8.4.5. South Korea

8.4.6. Rest of Asia-Pacific

8.5. Rest of the World

8.5.1. Middle East

8.5.2. Africa

8.5.3. Latin America

9. COMPANY LANDSCAPE

9.1. Overview

9.2. Competitive Analysis

9.3. Market Share Analysis

9.4. Major Growth Strategy in the Global Bionic Ear Market

9.5. Competitive Benchmarking

9.6. Leading Players in Terms of Number of Developments in the Global Bionic Ear Market

9.7. Key developments and Growth Strategies

9.7.1. New Product Launch/Service Deployment

9.7.2. Merger &Acquisitions

9.7.3. Joint Ventures

9.8. Major Players Financial Matrix

9.8.1. Sales & Operating Income, 2020

9.8.2. Major Players R&D Expenditure, 2020

10. COMPANY PROFILES

10.1. Advanced Bionics

10.1.1. Company Overview

10.1.2. Products Offered

10.1.3. Financial Overview

10.1.4. Key Developments

10.1.5. SWOT Analysis

10.1.6. Key Strategies

10.2. Sonova

10.2.1. Company Overview

10.2.2. Products Offered

10.2.3. Financial Overview

10.2.4. Key Developments

10.2.5. SWOT Analysis

10.2.6. Key Strategies

10.3. Cochlear

10.3.1. Company Overview

10.3.2. Products Offered

10.3.3. Financial Overview

10.3.4. Key Developments

10.3.5. SWOT Analysis

10.3.6. Key Strategies

10.4. MED-EL

10.4.1. Company Overview

10.4.2. Products Offered

10.4.3. Financial Overview

10.4.4. Key Developments

10.4.5. SWOT Analysis

10.4.6. Key Strategies

10.5. WS Audiology

10.5.1. Company Overview

10.5.2. Products Offered

10.5.3. Financial Overview

10.5.4. Key Developments

10.5.5. SWOT Analysis

10.5.6. Key Strategies

10.6. Oticon

10.6.1. Company Overview

10.6.2. Products Offered

10.6.3. Financial Overview

10.6.4. Key Developments

10.6.5. SWOT Analysis

10.6.6. Key Strategies

10.7. Hangzhou Nurotron

10.7.1. Company Overview

10.7.2. Products Offered

10.7.3. Financial Overview

10.7.4. Key Developments

10.7.5. SWOT Analysis

10.7.6. Key Strategies

10.8. Listent Medical

10.8.1. Company Overview

10.8.2. Products Offered

10.8.3. Financial Overview

10.8.4. Key Developments

10.8.5. SWOT Analysis

10.8.6. Key Strategies

10.9. Medtronic PLC

10.9.1. Company Overview

10.9.2. Products Offered

10.9.3. Financial Overview

10.9.4. Key Developments

10.9.5. SWOT Analysis

10.9.6. Key Strategies

10.10. Edward Lifesciences corporation

10.10.1. Company Overview

10.10.2. Products Offered

10.10.3. Financial Overview

10.10.4. Key Developments

10.10.5. SWOT Analysis

10.10.6. Key Strategies

10.11. Ekso Bionics

10.11.1. Company Overview

10.11.2. Products Offered

10.11.3. Financial Overview

10.11.4. Key Developments

10.11.5. SWOT Analysis

10.11.6. Key Strategies

10.12. Ossur

10.12.1. Company Overview

10.12.2. Products Offered

10.12.3. Financial Overview

10.12.4. Key Developments

10.12.5. SWOT Analysis

10.12.6. Key Strategies

10.13. LifeNet Health

10.13.1. Company Overview

10.13.2. Products Offered

10.13.3. Financial Overview

10.13.4. Key Developments

10.13.5. SWOT Analysis

10.13.6. Key Strategies

10.14. William Demant Holdings

10.14.1. Company Overview

10.14.2. Products Offered

10.14.3. Financial Overview

10.14.4. Key Developments

10.14.5. SWOT Analysis

10.14.6. Key Strategies

10.15. Terumo Corporation

10.15.1. Company Overview

10.15.2. Products Offered

10.15.3. Financial Overview

10.15.4. Key Developments

10.15.5. SWOT Analysis

10.15.6. Key Strategies

11. APPENDIX

11.1. References

11.2. Related Reports

LIST OF TABLES

TABLE 1 GLOBAL BIONIC EAR MARKET SYNOPSIS, 2022–2030

TABLE 2 GLOBAL BIONIC EAR MARKET ESTIMATES &FORECAST, 2022–2030(USD MILLION)

TABLE 3 GLOBAL BIONIC EAR MARKET BY DEVICE TYPE, 2022–2030 (USD MILLION)

TABLE 4 GLOBAL BIONIC EAR MARKET, BY END USER, 2022–2030 (USD MILLION)

TABLE 5 NORTH AMERICA: BIONIC EAR MARKET, BY COUNTRY, 2022–2030 (USD MILLION)

TABLE 6 NORTH AMERICA: BIONIC EAR MARKET, BY DEVICE TYPE, 2022–2030 (USD MILLION)

TABLE 7 NORTH AMERICA: BIONIC EAR MARKET, BY END USER, 2022–2030 (USD MILLION)

TABLE 8 US: BIONIC EAR MARKET BY DEVICE TYPE, 2022–2030 (USD MILLION)

TABLE 9 US: BIONIC EAR MARKET BY END USER, 2022–2030 (USD MILLION)

TABLE 10 CANADA: BIONIC EAR MARKET BY DEVICE TYPE, 2022–2030 (USD MILLION)

TABLE 11 CANADA: BIONIC EAR MARKET BY END USER, 2022–2030 (USD MILLION)

TABLE 12 EUROPE: BIONIC EAR MARKET BY COUNTRY, 2022–2030 (USD MILLION)

TABLE 13 EUROPE: BIONIC EAR MARKET BY DEVICE TYPE, 2022–2030 (USD MILLION)

TABLE 14 EUROPE: BIONIC EAR MARKET BY END USER, 2022–2030 (USD MILLION)

TABLE 15 GERMANY: BIONIC EAR MARKET BY DEVICE TYPE, 2022–2030 (USD MILLION)

TABLE 16 GERMANY: BIONIC EAR MARKET BY END USER, 2022–2030 (USD MILLION)

TABLE 17 FRANCE: BIONIC EAR MARKET BY DEVICE TYPE, 2022–2030 (USD MILLION)

TABLE 18 FRANCE: BIONIC EAR MARKET BY END USER, 2022–2030 (USD MILLION)

TABLE 19 ITALY: BIONIC EAR MARKET BY DEVICE TYPE, 2022–2030 (USD MILLION)

TABLE 20 ITALY: BIONIC EAR MARKET BY END USER, 2022–2030 (USD MILLION)

TABLE 21 SPAIN: BIONIC EAR MARKET BY DEVICE TYPE, 2022–2030 (USD MILLION)

TABLE 22 SPAIN: BIONIC EAR MARKET BY END USER, 2022–2030 (USD MILLION)

TABLE 23 UK: BIONIC EAR MARKET BY DEVICE TYPE, 2022–2030 (USD MILLION)

TABLE 24 UK: BIONIC EAR MARKET BY END USER, 2022–2030 (USD MILLION)

TABLE 25 REST OF EUROPE: BIONIC EAR MARKET BY DEVICE TYPE, 2022–2030 (USD MILLION)

TABLE 26 REST OF EUROPE: BIONIC EAR MARKET BY END USER, 2022–2030 (USD MILLION)

TABLE 27 ASIA-PACIFIC: BIONIC EAR MARKET BY COUNTRY, 2022–2030 (USD MILLION)

TABLE 28 ASIA-PACIFIC: BIONIC EAR MARKET BY DEVICE TYPE, 2022–2030 (USD MILLION)

TABLE 29 ASIA-PACIFIC: BIONIC EAR MARKET BY END USER, 2022–2030 (USD MILLION)

TABLE 30 JAPAN: BIONIC EAR MARKET BY DEVICE TYPE, 2022–2030 (USD MILLION)

TABLE 31 JAPAN: BIONIC EAR MARKET BY END USER, 2022–2030 (USD MILLION)

TABLE 32 CHINA: BIONIC EAR MARKET BY DEVICE TYPE, 2022–2030 (USD MILLION)

TABLE 33 CHINA: BIONIC EAR MARKET BY END USER, 2022–2030 (USD MILLION)

TABLE 34 INDIA: BIONIC EAR MARKET BY DEVICE TYPE, 2022–2030 (USD MILLION)

TABLE 35 INDIA: BIONIC EAR MARKET BY END USER, 2022–2030 (USD MILLION)

TABLE 36 AUSTRALIA: BIONIC EAR MARKET BY DEVICE TYPE, 2022–2030 (USD MILLION)

TABLE 37 AUSTRALIA: BIONIC EAR MARKET BY END USER, 2022–2030 (USD MILLION)

TABLE 38 SOUTH KOREA: BIONIC EAR MARKET BY DEVICE TYPE, 2022–2030 (USD MILLION)

TABLE 39 SOUTH KOREA: BIONIC EAR MARKET BY END USER, 2022–2030 (USD MILLION)

TABLE 40 REST OF ASIA-PACIFIC: BIONIC EAR MARKET BY DEVICE TYPE, 2022–2030 (USD MILLION)

TABLE 41 REST OF ASIA-PACIFIC: BIONIC EAR MARKET BY END USER, 2022–2030 (USD MILLION)

TABLE 42 REST OF THE WORLD: BIONIC EAR MARKET BY REGION, 2022–2030 (USD MILLION)

TABLE 43 REST OF THE WORLD: BIONIC EAR MARKET BY DEVICE TYPE, 2022–2030 (USD MILLION)

TABLE 44 REST OF THE WORLD: BIONIC EAR MARKET BY END USER, 2022–2030 (USD MILLION)

TABLE 45 MIDDLE EAST: BIONIC EAR MARKET BY DEVICE TYPE, 2022–2030 (USD MILLION)

TABLE 46 MIDDLE EAST: BIONIC EAR MARKET END USER, 2022–2030 (USD MILLION)

TABLE 47 AFRICA: BIONIC EAR MARKET BY DEVICE TYPE, 2022–2030 (USD MILLION)

TABLE 48 AFRICA: BIONIC EAR MARKET END USER, 2022–2030 (USD MILLION)

TABLE 49 LATIN AMERICA: BIONIC EAR MARKET BY DEVICE TYPE, 2022–2030 (USD MILLION)

TABLE 50 LATIN AMERICA: BIONIC EAR MARKET END USER, 2022–2030 (USD MILLION)

LIST OF FIGURES

FIGURE 1 RESEARCH PROCESS

FIGURE 2 MARKET STRUCTURE FOR THE GLOBAL BIONIC EAR MARKET

FIGURE 3 MARKET DYNAMICS FOR THE GLOBAL BIONIC EAR MARKET

FIGURE 4 GLOBAL BIONIC EAR MARKET SHARE, BY DEVICE TYPE, 2020 (%)

FIGURE 5 GLOBAL BIONIC EAR MARKET SHARE, BY END USER, 2020 (%)

FIGURE 6 GLOBAL BIONIC EAR MARKET SHARE, BY REGION, 2020 (%)

FIGURE 7 NORTH AMERICAS: BIONIC EAR MARKET SHARE, BY REGION, 2020 (%)

FIGURE 8 EUROPE: BIONIC EAR MARKET SHARE, BY REGION, 2020 (%)

FIGURE 9 ASIA-PACIFIC: BIONIC EAR MARKET SHARE, BY REGION, 2020 (%)

FIGURE 10 REST OF THE WORLD: BIONIC EAR MARKET SHARE, BY REGION, 2020 (%)

FIGURE 11 GLOBAL BIONIC EAR MARKET: COMPANY SHARE ANALYSIS, 2020 (%)

FIGURE 12 ADVANCED BIONICS KEY FINANCIALS

FIGURE 13 ADVANCED BIONICS SWOT ANALYSIS

FIGURE 14 SONOVAKEY FINANCIALS

FIGURE 15 SONOVASWOT ANALYSIS

FIGURE 16 COCHLEARKEY FINANCIALS

FIGURE 17 COCHLEAR SWOT ANALYSIS

FIGURE 18 MED-EL KEY FINANCIALS

FIGURE 19 MED-ELSWOT ANALYSIS

FIGURE 20 WS AUDIOLOGY KEY FINANCIALS

FIGURE 21 WS AUDIOLOGY SWOT ANALYSIS

FIGURE 22 OTICON KEY FINANCIALS

FIGURE 23 OTICON SWOT ANALYSIS

FIGURE 24 HANGZHOU NUROTRON KEY FINANCIALS

FIGURE 25 HANGZHOU NUROTRON SWOT ANALYSIS

FIGURE 26 LISTENT MEDICAL KEY FINANCIALS

FIGURE 27 LISTENT MEDICAL SWOT ANALYSIS

FIGURE 28 MEDTRONIC PLC KEY FINANCIALS

FIGURE 29 MEDTRONIC PLC SWOT ANALYSIS

FIGURE 30 EDWARD LIFESCIENCES CORPORATION KEY FINANCIALS

FIGURE 31 EDWARD LIFESCIENCES CORPORATION SWOT ANALYSIS

FIGURE 32 EKSO BIONICS KEY FINANCIALS

FIGURE 33 EKSO BIONICS SWOT ANALYSIS

FIGURE 34 OSSUR KEY FINANCIALS

FIGURE 35 OSSUR SWOT ANALYSIS

FIGURE 36 LIFENET HEALTH KEY FINANCIALS

FIGURE 37 LIFENET HEALTH SWOT ANALYSIS

FIGURE 38 WILLIAM DEMANT HOLDINGS KEY FINANCIALS

FIGURE 39 WILLIAM DEMANT HOLDINGS SWOT ANALYSIS

FIGURE 40 TERUMO CORPORATION KEY FINANCIALS

FIGURE 41 TERUMO CORPORATION SWOT ANALYSIS

Purchase Option
Single User $ 4,950
Multiuser License $ 5,950
Enterprise User $ 7,250
Compare Licenses
Tailored for You
  • Dedicated Research on any specifics segment or region.
  • Focused Research on specific players in the market.
  • Custom Report based only on your requirements.
  • Flexibility to add or subtract any chapter in the study.
  • Historic data from 2014 and forecasts outlook till 2040.
  • Flexibility of providing data/insights in formats (PDF, PPT, Excel).
  • Provide cross segmentation in applicable scenario/markets.